Spatial Data Analysis(一):线性回归
来源:https://github.com/Ziqi-Li/GEO4162C/tree/main
在此示例中,我们将介绍如何在 python 中拟合线性回归模型。 我们将使用的数据集是 2020 年县级选举投票数据以及来自 ACS 的社会经济数据。
import pandas as pd
import geopandas as gpd
voting_url = "https://raw.githubusercontent.com/Ziqi-Li/GEO4162C/main/data/voting_2021.csv"
voting = pd.read_csv(voting_url)
voting.shape
(3108, 22)
voting.head()
| county_id | state | county | NAME | proj_X | proj_Y | total_pop | new_pct_dem | sex_ratio | pct_black | ... | median_income | pct_65_over | pct_age_18_29 | gini | pct_manuf | ln_pop_den | pct_3rd_party | turn_out | pct_fb | pct_uninsured | |
|---|---|---|---|---|---|---|---|---|---|---|---|---|---|---|---|---|---|---|---|---|---|
| 0 | 17051 | 17 | 51 | Fayette County, Illinois | 597980.182064 | 1.796863e+06 | 21565 | 18.479911 | 113.6 | 4.7 | ... | 46650 | 18.8 | 14.899142 | 0.4373 | 14.9 | 3.392748 | 1.740255 | 59.066079 | 1.3 | 8.2 |
| 1 | 17107 | 17 | 107 | Logan County, Illinois | 559815.813333 | 1.920479e+06 | 29003 | 29.593095 | 97.2 | 6.9 | ... | 57308 | 18.0 | 17.256835 | 0.4201 | 12.4 | 3.847163 | 2.392057 | 57.395734 | 1.6 | 4.5 |
| 2 | 17165 | 17 | 165 | Saline County, Illinois | 650277.214895 | 1.660710e+06 | 23994 | 25.605949 | 96.9 | 2.6 | ... | 44090 | 19.9 | 13.586730 | 0.4692 | 8.7 | 4.128731 | 1.572384 | 59.078533 | 1.0 | 4.2 |
| 3 | 17097 | 17 | 97 | Lake County, Illinois | 654006.840698 | 2.174577e+06 | 701473 | 62.275888 | 99.8 | 6.8 | ... | 89427 | 13.7 | 15.823132 | 0.4847 | 16.3 | 7.308582 | 1.960338 | 71.156446 | 18.7 | 6.8 |
| 4 | 17127 | 17 | 127 | Massac County, Illinois | 640398.986258 | 1.599902e+06 | 14219 | 25.662005 | 89.5 | 5.8 | ... | 47481 | 20.8 | 12.370772 | 0.4097 | 7.4 | 4.067788 | 1.335682 | 62.372974 | 1.0 | 5.4 |
5 rows × 22 columns
shp_url = "https://raw.githubusercontent.com/Ziqi-Li/GEO4162C/main/data/County_shp_2018/County_shp_2018.shp"
shp = gpd.read_file(shp_url)
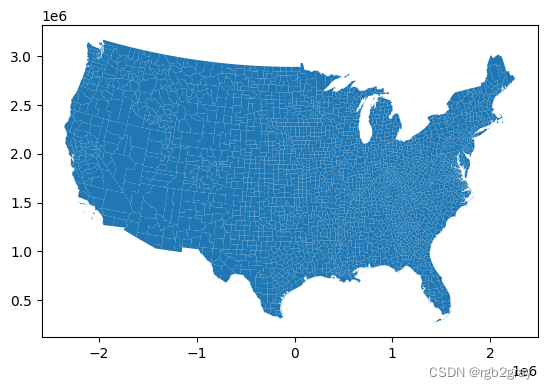
shp.plot()
<Axes: >
shp.head()
| STATEFP | COUNTYFP | COUNTYNS | AFFGEOID | GEOID | NAME | LSAD | ALAND | AWATER | geoid_int | geometry | |
|---|---|---|---|---|---|---|---|---|---|---|---|
| 0 | 39 | 071 | 01074048 | 0500000US39071 | 39071 | Highland | 06 | 1432479992 | 12194983 | 39071 | POLYGON ((1037181.007 1847418.019, 1034790.811... |
| 1 | 06 | 003 | 01675840 | 0500000US06003 | 06003 | Alpine | 06 | 1912292630 | 12557304 | 6003 | POLYGON ((-2057214.391 1981928.249, -2051788.3... |
| 2 | 12 | 033 | 00295737 | 0500000US12033 | 12033 | Escambia | 06 | 1701544502 | 563927612 | 12033 | POLYGON ((797106.710 901987.747, 797133.592 90... |
| 3 | 17 | 101 | 00424252 | 0500000US17101 | 17101 | Lawrence | 06 | 963936864 | 5077783 | 17101 | POLYGON ((697325.783 1756964.285, 694889.230 1... |
| 4 | 28 | 153 | 00695797 | 0500000US28153 | 28153 | Wayne | 06 | 2099745573 | 7255476 | 28153 | POLYGON ((664815.315 992438.494, 664464.412 99... |
使用公共键合并两个 DataFrame。
shp_df = shp.merge(voting,left_on="geoid_int",right_on="county_id")
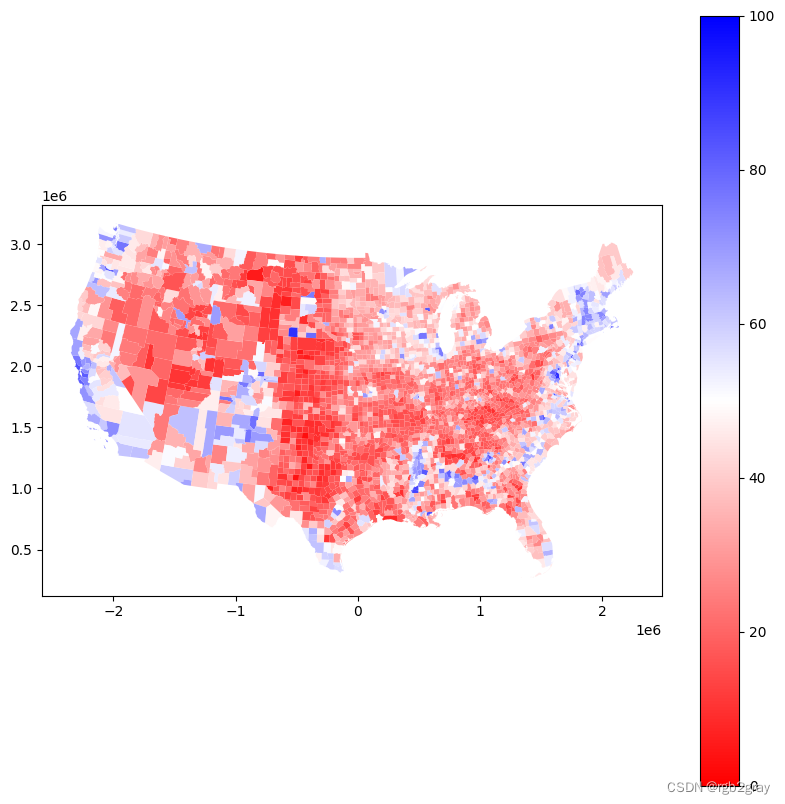
制作一张关于人们如何投票的地图。 非常熟悉的蓝红色景观。
shp_df.plot(column="new_pct_dem",cmap="bwr_r",vmin=0,vmax=100,legend=True,figsize=(10,10))
<Axes: >
线性回归
将使用“statsmodels”库来估计线性回归模型。
import statsmodels.formula.api as smf
shp_df.columns
Index(['STATEFP', 'COUNTYFP', 'COUNTYNS', 'AFFGEOID', 'GEOID', 'NAME_x',
       'LSAD', 'ALAND', 'AWATER', 'geoid_int', 'geometry', 'county_id',
       'state', 'county', 'NAME_y', 'proj_X', 'proj_Y', 'total_pop',
       'new_pct_dem', 'sex_ratio', 'pct_black', 'pct_hisp', 'pct_bach',
       'median_income', 'pct_65_over', 'pct_age_18_29', 'gini', 'pct_manuf',
       'ln_pop_den', 'pct_3rd_party', 'turn_out', 'pct_fb', 'pct_uninsured'],
      dtype='object')
import matplotlib.pyplot as plt
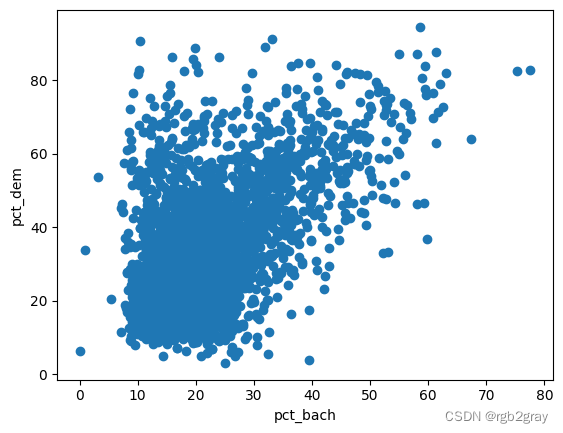
做一个简单的散点图,我们可以看到一点正相关。
plt.scatter(shp_df.pct_bach, shp_df.new_pct_dem)
plt.xlabel("pct_bach")
plt.ylabel("pct_dem")
Text(0, 0.5, 'pct_dem')
from scipy.stats import pearsonr
pearsonr(shp_df.pct_bach, shp_df.new_pct_dem)
PearsonRResult(statistic=0.533176728506252, pvalue=7.032775736251e-228)
现在让我们指定一个简单的模型:
Model_1: new_pct_dem ~ 1 + pct_bach
new_pct_dem: 因变量,投票给民主党的人的百分比
pct_bach: 自变量,拥有学士学位的人的百分比
1: 是添加截距,这个是经常需要的
model_1 = smf.ols(formula='new_pct_dem ~ 1 + pct_bach', data=shp_df).fit()
model_1.summary()
| Dep. Variable: | new_pct_dem | R-squared: | 0.284 |
|---|---|---|---|
| Model: | OLS | Adj. R-squared: | 0.284 |
| Method: | Least Squares | F-statistic: | 1234. |
| Date: | Fri, 17 Nov 2023 | Prob (F-statistic): | 7.03e-228 |
| Time: | 16:07:30 | Log-Likelihood: | -12560. |
| No. Observations: | 3108 | AIC: | 2.512e+04 |
| Df Residuals: | 3106 | BIC: | 2.514e+04 |
| Df Model: | 1 | ||
| Covariance Type: | nonrobust |
| coef | std err | t | P>|t| | [0.025 | 0.975] | |
|---|---|---|---|---|---|---|
| Intercept | 13.9652 | 0.618 | 22.615 | 0.000 | 12.754 | 15.176 |
| pct_bach | 0.9055 | 0.026 | 35.124 | 0.000 | 0.855 | 0.956 |
| Omnibus: | 376.503 | Durbin-Watson: | 1.927 |
|---|---|---|---|
| Prob(Omnibus): | 0.000 | Jarque-Bera (JB): | 603.255 |
| Skew: | 0.845 | Prob(JB): | 1.01e-131 |
| Kurtosis: | 4.342 | Cond. No. | 60.0 |
Notes:
[1] Standard Errors assume that the covariance matrix of the errors is correctly specified.
这给了我们回归函数:
pct_dem = 13.9652 + 0.9055*pct_bach
解释:
- Bach的%与DEM的%呈正相关。
- 增加1%Bach将增加0.9055%的人投票给DEM。
- 截距和 % Bach 的 p 值都非常小 (<0.05),表明系数/发现的关系在统计上都是显着的。
- R2 值 = 0.284 表明该模型具有一定程度的解释力。 请记住 0<=R2<=1。
import numpy as np
np.sqrt(0.284)
0.532916503778969
R2 的平方根也是皮尔逊相关系数。
现在让我们指定一个更复杂的模型:
Model_2: new_pct_dem ~ 1 + pct_bach + median_income + ln_pop_den
new_pct_dem: 因变量,投票给民主党的人的百分比
pct_bach: 自变量,拥有学士学位的人的百分比
median_income: 自变量,收入中位数
ln_pop_den: 自变量,人口密度的对数尺度
1: 是添加截距,这个是经常需要的
model_2 = smf.ols(formula='new_pct_dem ~ 1 + pct_bach + median_income + ln_pop_den', data=shp_df).fit()
model_2.summary()
| Dep. Variable: | new_pct_dem | R-squared: | 0.433 |
|---|---|---|---|
| Model: | OLS | Adj. R-squared: | 0.432 |
| Method: | Least Squares | F-statistic: | 789.2 |
| Date: | Fri, 17 Nov 2023 | Prob (F-statistic): | 0.00 |
| Time: | 16:07:30 | Log-Likelihood: | -12199. |
| No. Observations: | 3108 | AIC: | 2.441e+04 |
| Df Residuals: | 3104 | BIC: | 2.443e+04 |
| Df Model: | 3 | ||
| Covariance Type: | nonrobust |
| coef | std err | t | P>|t| | [0.025 | 0.975] | |
|---|---|---|---|---|---|---|
| Intercept | 17.3905 | 0.898 | 19.361 | 0.000 | 15.629 | 19.152 |
| pct_bach | 0.9890 | 0.034 | 29.145 | 0.000 | 0.923 | 1.056 |
| median_income | -0.0004 | 2.23e-05 | -15.804 | 0.000 | -0.000 | -0.000 |
| ln_pop_den | 3.5657 | 0.142 | 25.074 | 0.000 | 3.287 | 3.845 |
| Omnibus: | 483.110 | Durbin-Watson: | 1.926 |
|---|---|---|---|
| Prob(Omnibus): | 0.000 | Jarque-Bera (JB): | 843.802 |
| Skew: | 1.002 | Prob(JB): | 5.90e-184 |
| Kurtosis: | 4.580 | Cond. No. | 2.25e+05 |
Notes:
[1] Standard Errors assume that the covariance matrix of the errors is correctly specified.
[2] The condition number is large, 2.25e+05. This might indicate that there are
strong multicollinearity or other numerical problems.
这给了我们新的回归函数:
pct_dem = 17.3905 + 0.9890 * pct_bach + -0.0004 *median_income + 3.5657 * ln_pop_den
解释:
- %Bach,人口密度与%DEM呈正相关。
- 收入中位数与 % DEM 呈负相关。
- 增加 1% Bach将增加 0.9890% 的人投票给 DEM。
- 收入中位数每增加 1 美元,投票给 DEM 的人数就会减少 0.0004%。 这也意味着增加 10,000 美元将减少 4%。
- 所有变量的 p 值都非常小 (<0.05),表明所有系数/发现的关系在统计上都是显着的。
- R2 值 = 0.433,表明该模型与模型 1 相比具有更好的解释力。
诊断图
线性回归的四个假设是什么? 提示:线
残差与拟合图
#get the predicted value
pred = model_2.fittedvalues

#get the residual
resid = model_2.resid
shp_df.new_pct_dem
0       19.505057
1       66.111111
2       42.319648
3       22.505948
4       36.491793
          ...
3103    28.144652
3104    63.766385
3105    58.965517
3106    32.751442
3107    46.070656
Name: new_pct_dem, Length: 3108, dtype: float64
plt.scatter(shp_df.new_pct_dem,pred)
plt.xlabel("True % DEM")
plt.ylabel("Predicted % DEM")
Text(0, 0.5, 'Predicted % DEM')
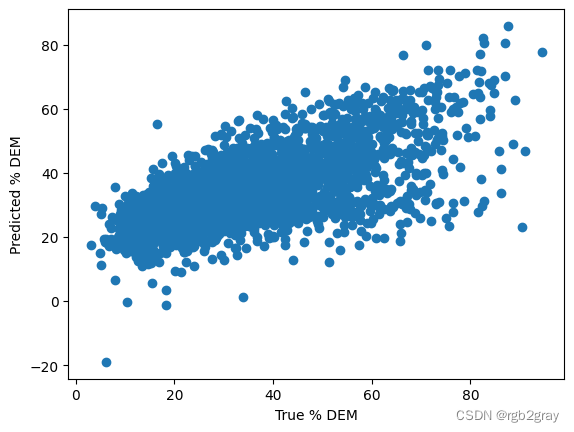
您可以看到任何明显的问题吗?
plt.scatter(pred, resid,alpha=0.5)

plt.axhline(y = 0.0, color = 'black', linestyle = '--')

plt.xlabel("Predicted value")
plt.ylabel("Residual")
plt.title("Model 2")
Text(0.5, 1.0, 'Model 2')
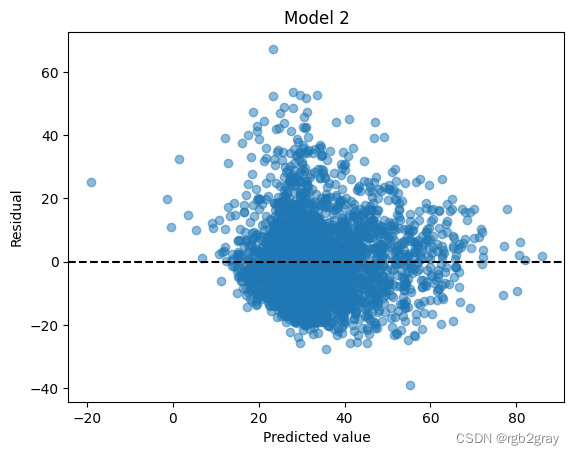
检查残余正态性。 是否歪斜?
plt.hist(resid)
(array([1.000e+00, 9.300e+01, 8.650e+02, 1.137e+03, 6.410e+02, 2.330e+02,
        9.500e+01, 3.200e+01, 1.000e+01, 1.000e+00]),
 array([-38.91209715, -28.29712822, -17.6821593 ,  -7.06719038,
          3.54777854,  14.16274746,  24.77771638,  35.3926853 ,
         46.00765422,  56.62262314,  67.23759207]),
 <BarContainer object of 10 artists>)

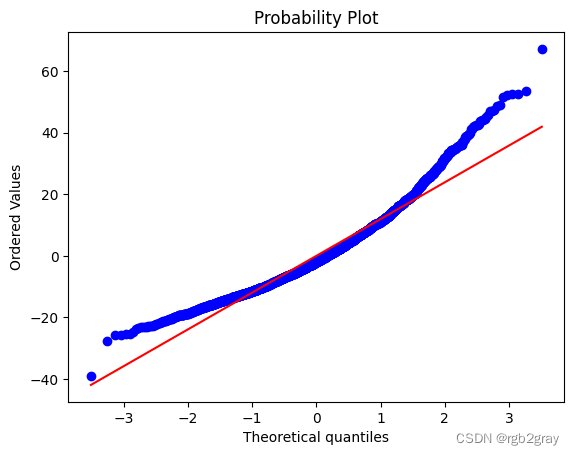
然后我们来画一个 Q-Q 图。 如果所有蓝点(残差)都位于代表完美正态分布的直线上,则期望是这样。 很明显,残差不正常。
import scipy.stats as stats

stats.probplot(resid, dist="norm", plot=plt)
((array([-3.51125824, -3.26814139, -3.13373139, ...,  3.13373139,
          3.26814139,  3.51125824]),
  array([-38.91209715, -27.53724546, -25.76653482, ...,  52.7401659 ,
          53.71192504,  67.23759207])),
 (11.948687014006548, 8.341427973378232e-12, 0.9739250994350543))
完整模型
让我们在模型中添加更多变量
shp_df.columns
Index(['STATEFP', 'COUNTYFP', 'COUNTYNS', 'AFFGEOID', 'GEOID', 'NAME_x',
       'LSAD', 'ALAND', 'AWATER', 'geoid_int', 'geometry', 'county_id',
       'state', 'county', 'NAME_y', 'proj_X', 'proj_Y', 'total_pop',
       'new_pct_dem', 'sex_ratio', 'pct_black', 'pct_hisp', 'pct_bach',
       'median_income', 'pct_65_over', 'pct_age_18_29', 'gini', 'pct_manuf',
       'ln_pop_den', 'pct_3rd_party', 'turn_out', 'pct_fb', 'pct_uninsured'],
      dtype='object')
formula = 'new_pct_dem ~ 1 + sex_ratio + pct_black + pct_hisp + pct_bach + median_income + pct_65_over + pct_age_18_29 + gini + pct_manuf + ln_pop_den + pct_3rd_party + turn_out + pct_fb + pct_uninsured'

model_3 = smf.ols(formula=formula, data=shp_df).fit()
model_3.summary()
| Dep. Variable: | new_pct_dem | R-squared: | 0.673 |
|---|---|---|---|
| Model: | OLS | Adj. R-squared: | 0.672 |
| Method: | Least Squares | F-statistic: | 455.1 |
| Date: | Fri, 17 Nov 2023 | Prob (F-statistic): | 0.00 |
| Time: | 16:07:34 | Log-Likelihood: | -11342. |
| No. Observations: | 3108 | AIC: | 2.271e+04 |
| Df Residuals: | 3093 | BIC: | 2.280e+04 |
| Df Model: | 14 | ||
| Covariance Type: | nonrobust |
| coef | std err | t | P>|t| | [0.025 | 0.975] | |
|---|---|---|---|---|---|---|
| Intercept | -25.5366 | 4.843 | -5.272 | 0.000 | -35.033 | -16.040 |
| sex_ratio | 0.0376 | 0.017 | 2.162 | 0.031 | 0.004 | 0.072 |
| pct_black | 0.5523 | 0.014 | 39.052 | 0.000 | 0.525 | 0.580 |
| pct_hisp | 0.3120 | 0.020 | 15.745 | 0.000 | 0.273 | 0.351 |
| pct_bach | 0.6819 | 0.039 | 17.542 | 0.000 | 0.606 | 0.758 |
| median_income | -0.0002 | 2.58e-05 | -8.428 | 0.000 | -0.000 | -0.000 |
| pct_65_over | 0.1804 | 0.058 | 3.103 | 0.002 | 0.066 | 0.294 |
| pct_age_18_29 | 0.1371 | 0.067 | 2.036 | 0.042 | 0.005 | 0.269 |
| gini | 18.0909 | 6.040 | 2.995 | 0.003 | 6.249 | 29.933 |
| pct_manuf | 0.0487 | 0.030 | 1.646 | 0.100 | -0.009 | 0.107 |
| ln_pop_den | 2.6681 | 0.154 | 17.328 | 0.000 | 2.366 | 2.970 |
| pct_3rd_party | 4.3480 | 0.234 | 18.582 | 0.000 | 3.889 | 4.807 |
| turn_out | 0.2263 | 0.026 | 8.750 | 0.000 | 0.176 | 0.277 |
| pct_fb | 0.1392 | 0.051 | 2.707 | 0.007 | 0.038 | 0.240 |
| pct_uninsured | -0.3402 | 0.044 | -7.683 | 0.000 | -0.427 | -0.253 |
| Omnibus: | 1000.163 | Durbin-Watson: | 1.910 |
|---|---|---|---|
| Prob(Omnibus): | 0.000 | Jarque-Bera (JB): | 8501.905 |
| Skew: | 1.283 | Prob(JB): | 0.00 |
| Kurtosis: | 10.686 | Cond. No. | 2.34e+06 |
Notes:
[1] Standard Errors assume that the covariance matrix of the errors is correctly specified.
[2] The condition number is large, 2.34e+06. This might indicate that there are
strong multicollinearity or other numerical problems.
该模型得到了进一步改进,R2 为 0.673。
#get the predicted value
pred_3 = model_3.fittedvalues

#get the residual
resid_3 = model_3.resid
plt.scatter(shp_df.new_pct_dem,pred_3)
plt.xlabel("True % DEM")
plt.ylabel("Predicted % DEM")
Text(0, 0.5, 'Predicted % DEM')
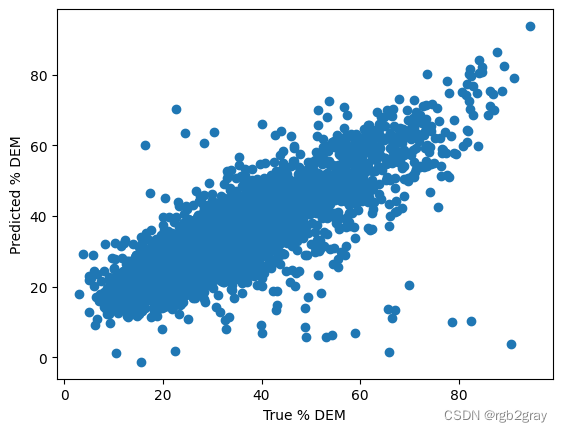
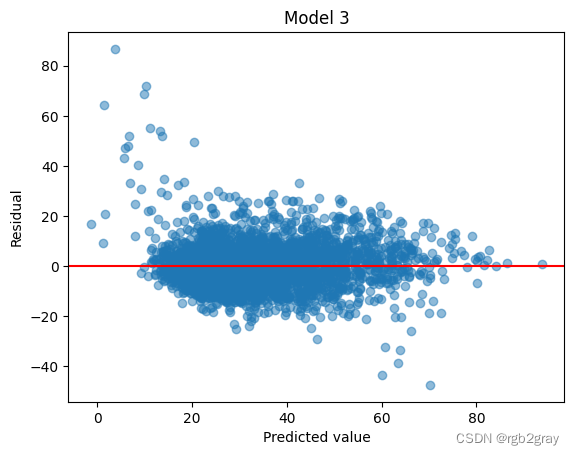
让我们重新制作这些诊断图,现在它们看起来好多了!
plt.scatter(pred_3, resid_3,alpha=0.5)

plt.axhline(y = 0.0, color = 'r', linestyle = '-')

plt.xlabel("Predicted value")
plt.ylabel("Residual")
plt.title("Model 3")
Text(0.5, 1.0, 'Model 3')
plt.hist(resid_3)
(array([3.000e+00, 1.200e+01, 5.960e+02, 1.866e+03, 5.510e+02, 6.300e+01,
        6.000e+00, 7.000e+00, 3.000e+00, 1.000e+00]),
 array([-47.50438204, -34.08283911, -20.66129618,  -7.23975325,
          6.18178968,  19.60333261,  33.02487554,  46.44641847,
         59.8679614 ,  73.28950433,  86.71104726]),
 <BarContainer object of 10 artists>)

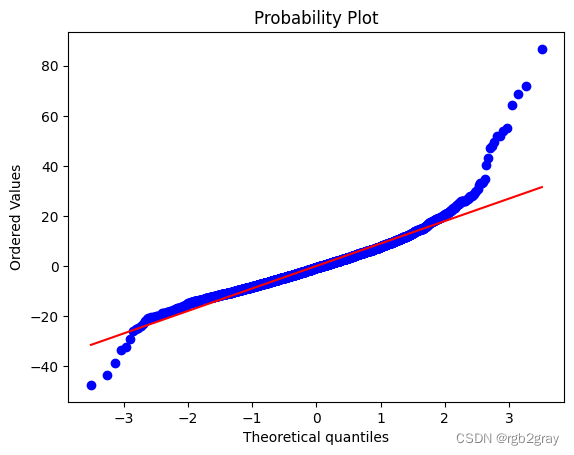
QQ 图表明,除了一些极值之外,大多数点都在直线上。
import scipy.stats as stats
stats.probplot(resid_3, dist="norm", plot=plt)
((array([-3.51125824, -3.26814139, -3.13373139, ...,  3.13373139,
          3.26814139,  3.51125824]),
  array([-47.50438204, -43.62464376, -38.82786172, ...,  68.71420089,
          72.06270506,  86.71104726])),
 (8.974562038717135, 3.0034852088946733e-12, 0.963803701208645))







![[C国演义] 第二十三章](https://img-blog.csdnimg.cn/cd4adb45c52c42e5b1b2e9e593320164.png)


