Mapbox地图数据平台
1.简介
Mapbox是移动的和Web应用程序的位置数据平台,适用于分层区位分析图,可自定义元素、色彩等,任何图层都可编辑.。Mapbox灵活的地图和位置构建块可以无缝集成到您的数据分析应用程序或数据可视化中。
平滑的矢量地图可扩展到数百万个数据点,提供类似视频游戏的可视化效果。自定义地图设计,或从专业设计的样式中挑选,通过使用Mapbox Studio更改颜色渐变、缩放等功能,为地图和数据图层设置动画和拉伸。
https://www.mapbox.com/
2.准备
你需要一个API访问令牌来配置Mapbox GL JS、Mobile和Mapbox web服务。此访问令牌将您的地图与Mapbox帐户关联起来
所以要先注册一个账号。
官网注册地址 https://account.mapbox.com/
注意点:
mapbox属于国外网站,禁止国内邮箱和电话等信息注册。这里采用下面这个方式。
https://www.bilibili.com/read/cv24878918/
3.启动首个demo
官网文档api
https://docs.mapbox.com/mapbox-gl-js/guides/
<!DOCTYPE html>
<html>
	<head>
		<meta charset="utf-8">
		<title>Check if Mapbox GL JS is supported</title>
		<meta name="viewport" content="initial-scale=1,maximum-scale=1,user-scalable=no">
		<link href="https://api.mapbox.com/mapbox-gl-js/v2.14.1/mapbox-gl.css" rel="stylesheet">
		<script src="https://api.mapbox.com/mapbox-gl-js/v2.14.1/mapbox-gl.js"></script>
		<style>
			body {
				margin: 0;
				padding: 0;
			}

			#map {
				position: absolute;
				top: 0;
				bottom: 0;
				width: 100%;
			}
		</style>
	</head>
	<body>
		<div id="map"></div>

		<script>
			mapboxgl.accessToken = '<输入你的token>';
			if (!mapboxgl.supported()) {
				alert('Your browser does not support Mapbox GL');
			} else {
				const map = new mapboxgl.Map({
					container: 'map',
					// Choose from Mapbox's core styles, or make your own style with Mapbox Studio
					style: 'mapbox://styles/mapbox/streets-v12',
					center: [-74.5, 40],
					zoom: 9
				});
			}
		</script>

	</body>
</html>
引入mapbox-gl.js库
在线库
<script src='https://api.mapbox.com/mapbox-gl-js/v2.11.0/mapbox-gl.js'></script>
<link href='https://api.mapbox.com/mapbox-gl-js/v2.11.0/mapbox-gl.css' rel='stylesheet' />
npm 形式安装
npm install --save mapbox-gl
然后引入
import 'mapbox-gl/dist/mapbox-gl.css';
import mapboxgl from 'mapbox-gl';
创建一个地图元素容器
<div id='map' style='width: 100%; height: 100%;'></div>
使用token并配置
mapboxgl.accessToken = '<输入你的token>';
创建一个地图示例
const map = new mapboxgl.Map({
    container: 'map',     // 地图容器 ID
    style: 'mapbox://styles/mapbox/streets-v12',     // 样式url
    center: [116.42396,39.91784],    // 中心位置[lng, lat]
    zoom: 16, // 缩放
    pitch: 35, // 倾斜角度
});
案例可参照
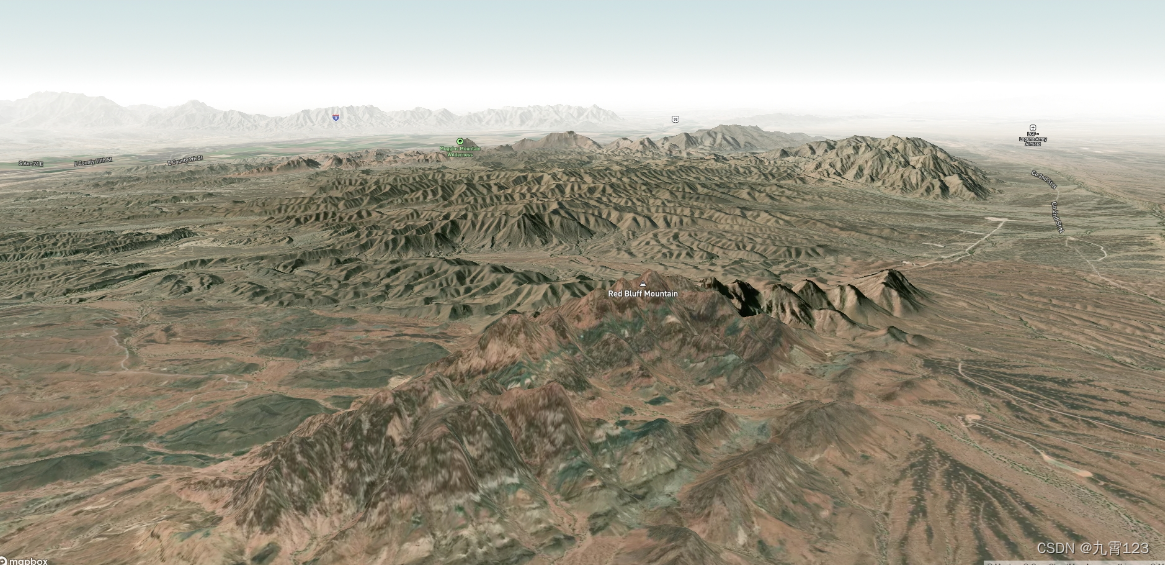
加载3D地形图
<!DOCTYPE html>
<html>
<head>
<meta charset="utf-8">
<title>Add 3D terrain to a map</title>
<meta name="viewport" content="initial-scale=1,maximum-scale=1,user-scalable=no">
<link href="https://api.mapbox.com/mapbox-gl-js/v2.14.1/mapbox-gl.css" rel="stylesheet">
<script src="https://api.mapbox.com/mapbox-gl-js/v2.14.1/mapbox-gl.js"></script>
<style>
body { margin: 0; padding: 0; }
#map { position: absolute; top: 0; bottom: 0; width: 100%; }
</style>
</head>
<body>
<div id="map"></div>

<script>
	mapboxgl.accessToken = '<输入你的token>';
    const map = new mapboxgl.Map({
        container: 'map',
        zoom: 14,
        center: [-114.26608, 32.7213],
        pitch: 80,
        bearing: 41,
        // Choose from Mapbox's core styles, or make your own style with Mapbox Studio
        style: 'mapbox://styles/mapbox/satellite-streets-v12'
    });

    map.on('style.load', () => {
        map.addSource('mapbox-dem', {
            'type': 'raster-dem',
            'url': 'mapbox://mapbox.mapbox-terrain-dem-v1',
            'tileSize': 512,
            'maxzoom': 14
        });
        // add the DEM source as a terrain layer with exaggerated height
        map.setTerrain({ 'source': 'mapbox-dem', 'exaggeration': 1.5 });
    });
</script>

</body>
</html>
插件和框架
(1)12个 Ul插件
Ul插件提供了与地图控件和其他用户可以触摸或交互的东西相关的特性和功能,如绘图工具、地
图导出工具、方向和地理编码控件等等。
12中插件 User interface plugins (12)
(2)9个插件
地图渲染插件提供与地图上显示的内容相关的特性和功能,如高级自定义图层、地图标签、数据可
视化等。Map Rendering Plugins (9) 9个插件
(3)9个框架集成
框架集成插件可以帮助您将Mapbox GLJS与外部框架结合使用。
例如:
应用与react结合的框架 react-mapbox-gl
应用与 angular结合的框架 angular-mapboxgl-directive
应用与 vue结合的框架
VueMapbox
https://soal.github.io/vue-mapbox/guide/
具体功能实现
1. 第一个案例
mapbox添加自定义图片marker标记点和气泡弹窗
2.mapbox加载超图rest图层
参考 超图的官方案例:加载 3857底图 ,点击查看源码,里面有超图的加载代码,和mapbox加载示例。
https://iclient.supermap.io/examples/mapboxgl/editor.html#01_tiledMapLayer
下面案例:是使用mapbox加载超图rest图层示例。
<!DOCTYPE html>
<html>
	<head>
		<meta charset="utf-8">
		<title>Add a WMS source</title>
		<meta name="viewport" content="initial-scale=1,maximum-scale=1,user-scalable=no">
		<link href="https://api.mapbox.com/mapbox-gl-js/v2.14.1/mapbox-gl.css" rel="stylesheet">
		<script src="https://api.mapbox.com/mapbox-gl-js/v2.14.1/mapbox-gl.js"></script>
		<style>
			body {
				margin: 0;
				padding: 0;
			}
			#map {
				position: absolute;
				top: 0;
				bottom: 0;
				width: 100%;
			}
		</style>
	</head>
	<body>
		<div id="map"></div>
		<script>
			mapboxgl.accessToken = '你的taken';
			const map = new mapboxgl.Map({
				container: 'map',
				// Choose from Mapbox's core styles, or make your own style with Mapbox Studio
				style: 'mapbox://styles/mapbox/light-v11',
				zoom: 8,
				center: [120, 30]
			});
			var attribution =
				"<a href='https://www.mapbox.com/about/maps/' target='_blank'>© Mapbox </a>" +
				" with <span>© <a href='https://iclient.supermap.io' target='_blank'>SuperMap iClient</a> | </span>" +
				" Map Data <span>© <a href='http://support.supermap.com.cn/product/iServer.aspx' target='_blank'>SuperMap iServer</a></span> ";

			map.on('load', () => {

				map.addSource('rastertiles', {
					attribution: attribution,
					type: 'raster',
					"tileSize": 256,
					tiles: ['https://iserver.supermap.io/iserver/services/map-china400/rest/maps/China/zxyTileImage.png?z={z}&x={x}&y={y}']
				});

				map.addLayer({
					"id": "simple-tiles",
					"type": "raster",
					"source": "rastertiles",
					"minzoom": 0,
					"maxzoom": 22
				});

			});
		</script>

	</body>
</html>
3.聚合点和单点的自定义图片并显示聚合数字text
功能:聚合点和单点都自定义图片,显示当前聚合总数。 并且点击可以获取撒点的数据。
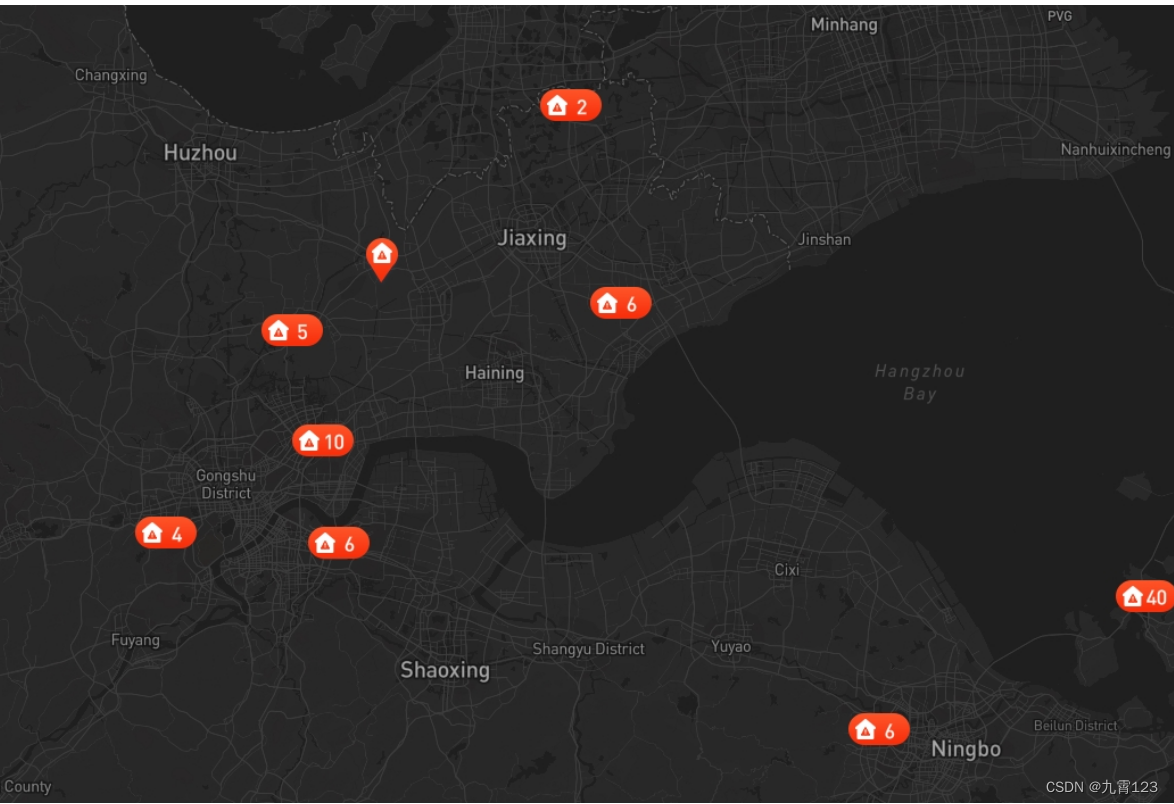
参考了mapbox的官网案例
聚合案例 https://docs.mapbox.com/mapbox-gl-js/example/cluster/
加载图片案例 https://docs.mapbox.com/mapbox-gl-js/example/add-image/
<!DOCTYPE html>
<html>
	<head>
		<meta charset="utf-8">
		<title>Create and style clusters</title>
		<meta name="viewport" content="initial-scale=1,maximum-scale=1,user-scalable=no">
		<link href="https://api.mapbox.com/mapbox-gl-js/v2.14.1/mapbox-gl.css" rel="stylesheet">
		<script src="https://api.mapbox.com/mapbox-gl-js/v2.14.1/mapbox-gl.js"></script>
		<script src="./json/point.js"></script>
		<style>
			body {
				margin: 0;
				padding: 0;
			}

			#map {
				position: absolute;
				top: 0;
				bottom: 0;
				width: 100%;
			}
		</style>
	</head>
	<body>
		<div id="map"></div>

		<script>
			mapboxgl.accessToken = '你的taken';
			const map = new mapboxgl.Map({
				container: 'map',
				// Choose from Mapbox's core styles, or make your own style with Mapbox Studio
				style: 'mapbox://styles/mapbox/dark-v11', //mapbox://styles/examples/cke97f49z5rlg19l310b7uu7j 动漫版
				center: [119.693901, 28.332140],
				zoom: 8
			});

			map.on('load', () => {
				// Add a new source from our GeoJSON data and
				// set the 'cluster' option to true. GL-JS will
				// add the point_count property to your source data.

				map.addSource('earthquakes', {
					type: 'geojson',
					// 指向GeoJSON数据。这个例子可视化了从2015 年12月22 日到2016 年1月21日的所
					// 有M1.0+级地震,这些地震记录由 USGS 的地震灾害项目记录。
					// data: 'https://docs.mapbox.com/mapbox-gl-js/assets/earthquakes.geojson',
					data: mypoints,
					cluster: true, //集群 :是
					clusterMaxZoom: 14, // Max zoom to cluster points on
					clusterRadius: 50 // Radius of each cluster when clustering points (defaults to 50)
				});
				// 添加聚合时的颜色圆形图案(聚合阶段显示)
				map.loadImage('http://127.0.0.1:8848/mapbox/img/house_jh.png', (error, image) => {
					if (error) throw error;
					// console.log(image)
					map.addImage('cat', image);

					map.addLayer({
						id: 'clusters',
						type: 'symbol',
						source: 'earthquakes',
						filter: ['has', 'point_count'],
						'layout': {
                            'text-field': ['get', 'point_count_abbreviated'],//文本内容来源字段
							"text-font": ["DIN Offc Pro Medium", "Arial Unicode MS Bold"], //字体
							"text-offset": [0.5, -0.5], //设置图标与图标注相对之间的距离
							"text-anchor": "top", //标记文本相对于定位点的位置
							"text-size": 18, //字号

							'icon-image': 'cat', // reference the image 引用图片
							'icon-size': 1,
							'visibility': 'visible',
						},
							paint: {
								"text-color": "#fff",
								"text-opacity": 1
							}
					});
				})
				// 小圆点 (聚合阶段单个时显示 放大到单个时出现)
				map.loadImage('http://127.0.0.1:8848/mapbox/img/house.png', (error, image) => {
					if (error) throw error;
					console.log(image)
					map.addImage('min_cat', image);
					map.addLayer({
						id: 'unclustered-point',
						type: 'symbol',
						source: 'earthquakes',
						filter: ['!', ['has', 'point_count']],
                        layout: {
						'icon-image': 'min_cat', // reference the image 引用图片
						'icon-size': 1,
						'visibility': 'visible',
						}
					});

				})


				// inspect a cluster on click
				map.on('click', 'clusters', (e) => {
					const features = map.queryRenderedFeatures(e.point, {
						layers: ['clusters']
					});
					// console.log(features)

					const clusterId = features[0].properties.cluster_id;
					 const point_count = features[0].properties.point_count,
					  clusterSource = map.getSource(/* cluster layer data source id */'earthquakes');

					  // Get Next level cluster Children
					  //
					  // clusterSource.getClusterChildren(clusterId, function(err, aFeatures){
					  //   console.log('getClusterChildren', err, aFeatures);
					  // });

					  // Get all points under a cluster
					  clusterSource.getClusterLeaves(clusterId, point_count, 0, function(err, aFeatures){
						  if (err) return;
					    // console.log('getClusterLeaves', err, aFeatures);
						     let points = [];
						     aFeatures.forEach( item =>{
								points.push(item.properties.parms)
							 })
							 console.log(points)
					  })

				});

				// When a click event occurs on a feature in
				// the unclustered-point layer, open a popup at
				// the location of the feature, with
				// description HTML from its properties.
				// 当单击事件发生在未聚集点图层中的某个要素上时在该要素的位置打开一个弹出窗口,描述为-HTML.from-its.properties。

				map.on('click', 'unclustered-point', (e) => {
					const coordinates = e.features[0].geometry.coordinates.slice();
					const mag = e.features[0].properties.mag;
					console.log(e.features[0].properties.parms)
					// const tsunami =
					// 	e.features[0].properties.tsunami === 1 ? 'yes' : 'no';
					// while (Math.abs(e.lngLat.lng - coordinates[0]) > 180) {
					// 	coordinates[0] += e.lngLat.lng > coordinates[0] ? 360 : -360;
					// }

					// new mapboxgl.Popup({
					// 	closeButton: false
					// }).setLngLat(coordinates).setHTML(
					// 	`magnitude: ${mag}<br>Was there a tsunami?: ${tsunami}`
					// ).addTo(map);
				});

				map.on('mouseenter', 'unclustered-point', (e) => {
					const coordinates = e.features[0].geometry.coordinates.slice(); //获取经纬度
					const roadCode = JSON.parse(e.features[0].properties.parms).resourceName;

					while (Math.abs(e.lngLat.lng - coordinates[0]) > 180) {
						coordinates[0] += e.lngLat.lng > coordinates[0] ? 360 : -360;
					}
					// console.log(coordinates)
					new mapboxgl.Popup().setLngLat(coordinates).setHTML(`${roadCode}`).addTo(map);
				});
				map.on('mouseleave', 'unclustered-point', (e) => {
					console.log(e.target._popups)
					if(e.target._popups.length){
						e.target._popups[0].remove()
					}
				});

				// 地图事件 监听图层id为clusters  鼠标进入事件
				// map.on('mouseenter', 'clusters', () => {
				// 	map.getCanvas().style.cursor = 'pointer';
				// });
				// 地图事件 监听图层id为clusters  鼠标离开事件
				// map.on('mouseleave', 'clusters', () => {
				// 	map.getCanvas().style.cursor = '';
				// });
			});
		</script>

	</body>
</html>
json数据
                    point.js文件
let mypoints = {
	type: "FeatureCollection",
	crs: {
		type: "name",
		properties: {
			name: "urn:ogc:def:crs:OGC:1.3:CRS84"
		}
	},
	features: [
		// {
		// 			"type": "Feature",
		// 			"properties": {
		// 				"id": "us2000b2nn",
		// 				"mag": 4.2,
		// 				"time": 1507422626990,
		// 				"felt": null,
		// 				"tsunami": 0
		// 			},
		// 			"geometry": {
		// 				"type": "Point",
		// 				"coordinates": [-87.6901, 12.0623, 46.41]
		// 			}
		// 		},
	]
}

let list = [{
		"distsCode": "331124",
		"fdObjectid": "00FB6AB46DCA4F838",
		"latitude": 28.332140,
		"resourceName": "占据一车道;该事件为施工导入;拥堵里程为:0.0km;",
		"interval": "0",
		"state": 0,
		"roadCode": "G40",
		"longitude": 119.693901
	},
	{
		"distsCode": "331124",
		"fdObjectid": "855B442A",
		"latitude": 28.347765,
		"resourceName": "占据硬路肩车道;该事件为施工导入;拥堵里程为:0.0km;",
		"interval": "0",
		"state": 0,
		"roadCode": "G4012",
		"longitude": 119.641747
	},
]
list.forEach(item =>{
	mypoints.features.push({
		type: "Feature",
	    properties: {
						id: item.fdObjectid,
						mag: 4.2,
					    parms:item,
					    state:item
					},
		geometry: {
				coordinates: [item.longitude, item.latitude, 46.41]
	}
	})
})
	},
	{
		"distsCode": "331124",
		"fdObjectid": "855B442A1F7C4693833906",
		"latitude": 28.347765,
		"resourceName": "占据硬路肩车道;该事件为施工导入;拥堵里程为:0.0km;",
		"interval": "0",
		"state": 0,
		"roadCode": "G401",
		"longitude": 119.641747
	},
]
list.forEach(item =>{
	mypoints.features.push({
		type: "Feature",
	    properties: {
						id: item.fdObjectid,
						mag: 4.2,
					    parms:item,
					    state:item
					},
		geometry: {
				coordinates: [item.longitude, item.latitude, 46.41]
	}
	})
})

