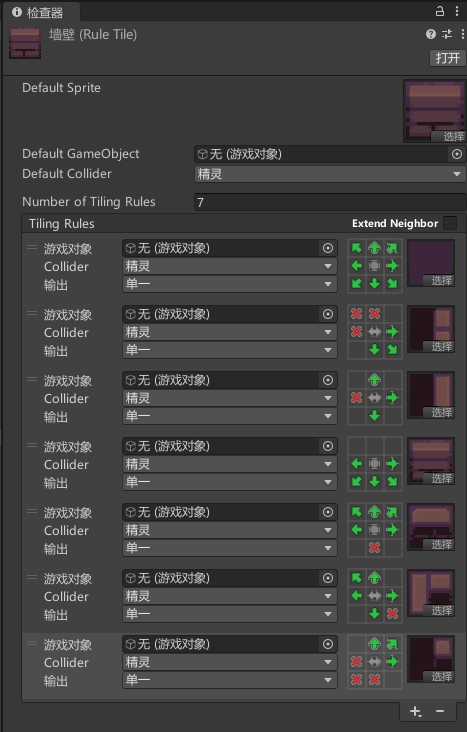
【用unity实现100个游戏之16】Unity中程序化生成的2D地牢5(附项目源码,完结)
news2026/2/12 12:52:49
本文来自互联网用户投稿,该文观点仅代表作者本人,不代表本站立场。本站仅提供信息存储空间服务,不拥有所有权,不承担相关法律责任。如若转载,请注明出处:http://www.coloradmin.cn/o/1241056.html
如若内容造成侵权/违法违规/事实不符,请联系多彩编程网进行投诉反馈,一经查实,立即删除!相关文章
跟着Cancer Cell 学作图| 配对棒棒糖图(Lollipop chart)
dotplot 本期图片 ❝ Doi:https://doi.org/10.1016/j.ccell.2022.02.013 ❞ ❝ Dotplot showing the association of cell populations with different tissue types (organ or tumor). The x axis represents cell types, and the y axis represents the different…
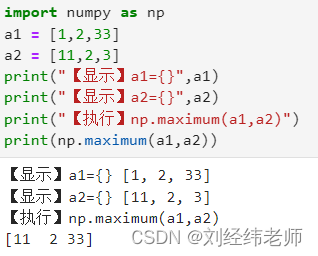
对比两个数组中对应位置的两个元素将每次对比的最大值用于构成新的数组np.maximum()
【小白从小学Python、C、Java】 【计算机等考500强证书考研】 【Python-数据分析】 对比两个数组中对应位置的两个元素 将每次对比的最大值用于构成新的数组 np.maximum()
选择题 以下代码的输出结果为? import numpy as np a1 [1,2,33] a2 [11,2,3] print("…
webshell之无扩展免杀
1.php加密
这里是利用phpjiami网站进行加密,进而达到加密效果 加密前: 查杀效果 可以看到这里D某和某狗都查杀
里用php加密后效果 查杀效果 可以看到这里只有D某会显示加密脚本,而某狗直接绕过
2.dezend加密 可以看到dezend加密的特征还是…
DockerHub 无法访问 - 解决办法
背景
DockerHub 镜像仓库地址 https://hub.docker.com/ 突然就无法访问了,且截至今日(2023/11)还无法访问。 这对我们来说,还是有一些影响的: ● 虽然 DockerHub 页面无法访问,但是还是可以下载镜像的,只是比较慢而已 ● 没法通过界面查询相关镜像,或者维护相关镜像了…
【JavaEE初阶】认识线程、创建线程
1. 认识线程(Thread)
1.1 概念
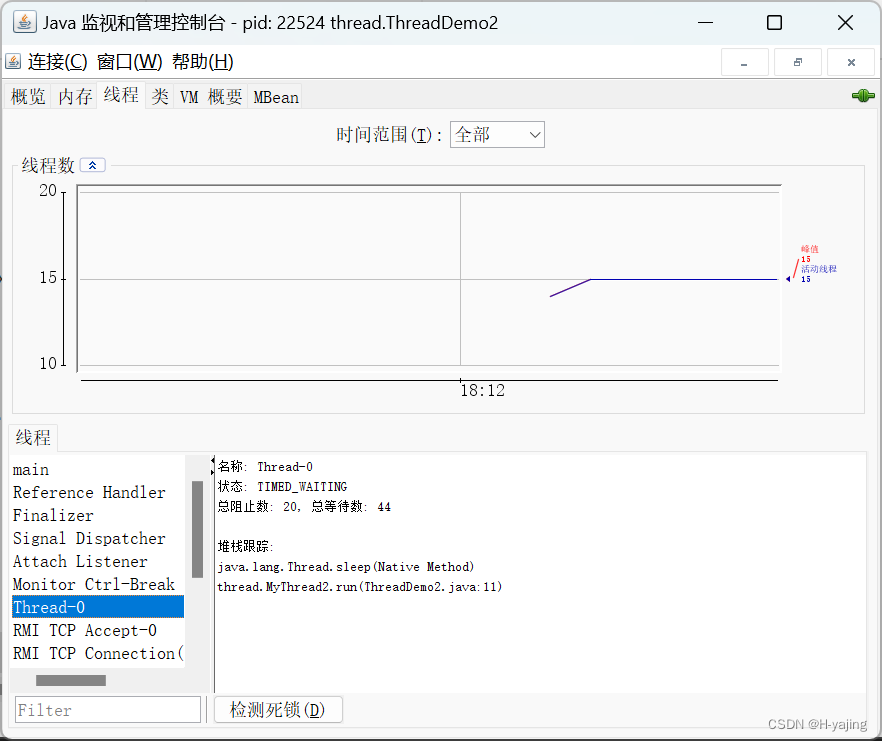
1) 线程是什么 一个线程就是一个 "执行流". 每个线程之间都可以按照顺序执行自己的代码. 多个线程之间 "同时" 执行着多份代码. 举例: 还是回到我们之前的银⾏的例⼦中。之前我们主要描…
ts实现合并数组对象中key相同的数据
背景
在平常的业务中,后端同学会返回以下类似的结构数据
// 后端返回的数据结构
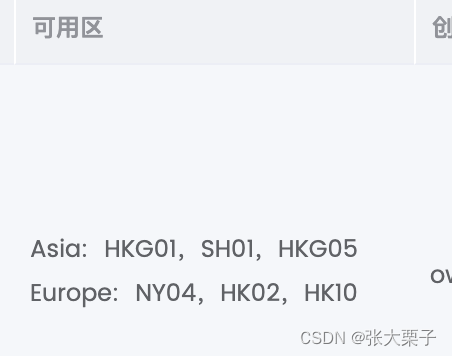
[{ id: 1, product_id: 1, pid_name: "Asia", name: "HKG01" },{ id: 2, product_id: 1, pid_name: "Asia", name: "SH01" },{ id: 3, pro…
为Oracle链接服务器使用分布式事务
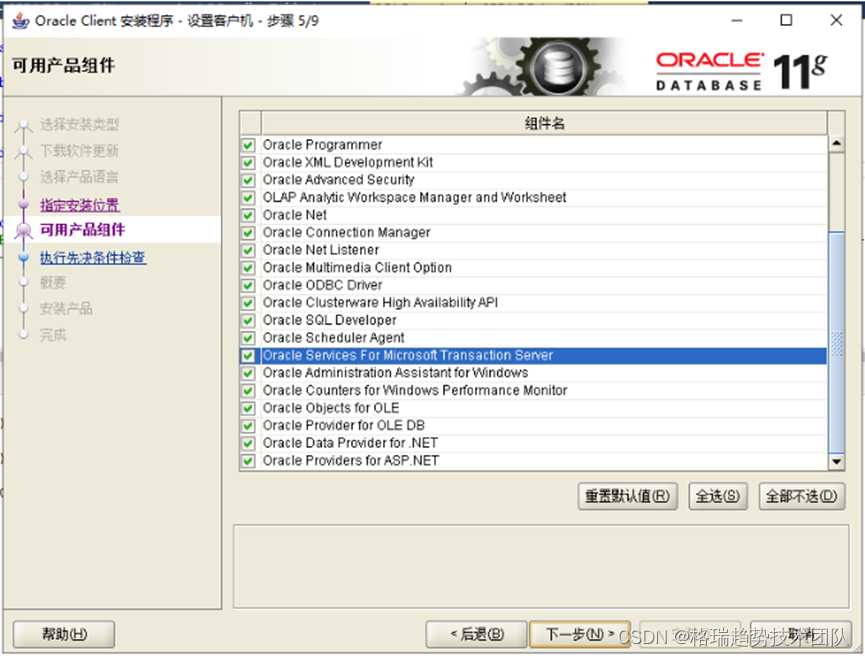
1 现象 在SQL Server中创建指向Oracle的链接服务器,SQL语句在事务中向链接服务器插入数据。返回链接服务器无法启动分布式事务的报错。 2 解决 在Windows平台下,SQL Server依赖分布式事务协调器(MSDTC)来使用分布式事务࿰…
关于 win11 系统下12代/13代英特尔大小核架构 CPU 的 VMware 优化:输入延迟、卡顿,大小核调度
关于 win11 系统下12代/13代英特尔大小核架构 CPU 的 VMware 优化:输入延迟、卡顿,大小核调度 一、前言二、VMware 的优化2.1 键鼠输入延迟问题的解决2.1.1 搜索内核隔离2.1.2 关闭内存完整性并重启2.1.3 搜索启用或关闭windows功能2.1.4 关闭 hyper-v 和…
ultralytics yolov8 实例分割 训练自有数据集
参考: https://docs.ultralytics.com/datasets/segment/coco/ http://www.bryh.cn/a/613333.html
1、数据下载与转换yolo格式
1)数据集下载: 参考:https://universe.roboflow.com/naumov-igor-segmentation/car-segmetarion 下载的是coco格式,需要转换
2)coco2yolo t…
不到十个例题带你拿下c++双指针算法(leetcode)
移动零问题
https://leetcode.cn/problems/move-zeroes/submissions/
1.题目解析
必须在原数组进行修改,不可以新建一个数组
非零元素相对顺序不变
2.算法原理
【数组划分】【数组分块】
这一类题会给我们一个数组,让我们划分区间,比如…
[项目管理-33/创业之路-87/管理者与领导者-127]:如何提升自己项目管理的能力和水平
目录
前言:
一、项目经理的角色定位
1.1 项目经理的职责
1.2 不同矩阵类型的项目,项目经理的职责
1.3 项目经理的角色定位
1.4 项目经理的发展路径
二、项目经理项目理论和知识结构
三、软件项目经理在计算机水平的提升
四、项目经理业务知识的…
海康Visionmaster-模块索引:MFC 模块索引异常解决 办法
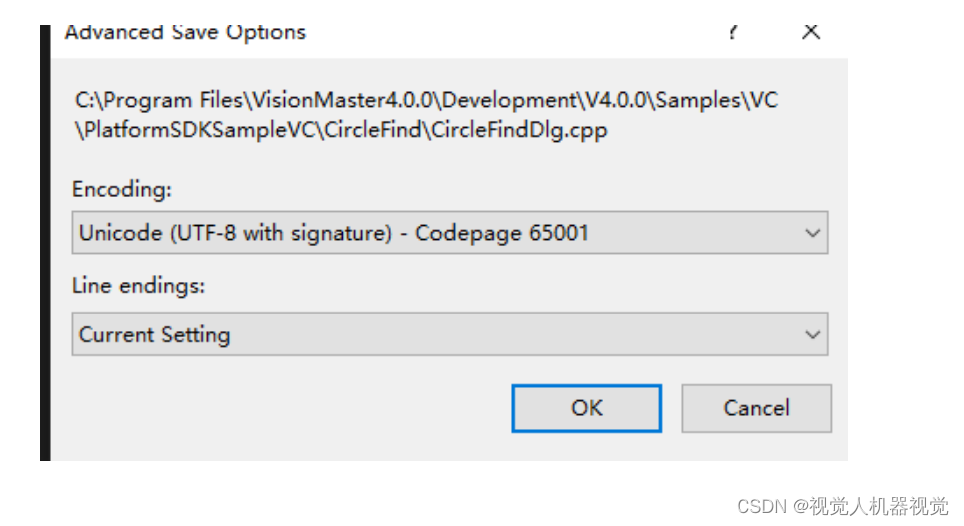
现象:文件编码格式为 UTF-8 不带签名编码格式,模块索引会出现 模块无法找到异常 更改文件类型为 UTF-8 带签名格式或 vs 默认 GBK2312 编码格式
顺序表基本操作全面解析
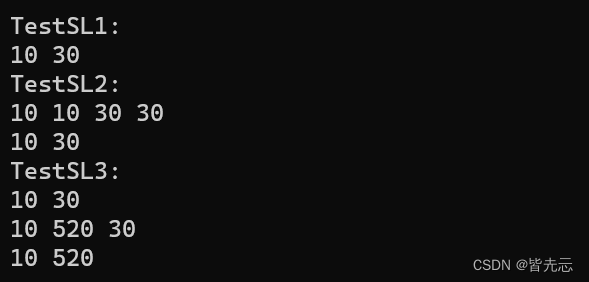
文章目录 1.线性表2.顺序表分类2.1 静态顺序表2.2 动态顺序表 3. 顺序表各接口实现1. 定义结构体(Seqlist)2. 结构体初始化(SLInit)3.检查容量 (SLCheckCapacity)4.打印数据 (SLPrintf)5.插入操作5.1 从数据头部插入(SLPushFront)5.2 从数据尾部插入(SLPushBack)5.3 从任意下标…








![[项目管理-33/创业之路-87/管理者与领导者-127]:如何提升自己项目管理的能力和水平](https://img-blog.csdnimg.cn/6a57e0c070d94ecc9b0ba63959c35c78.png)
