scipy.interpolate插值方法
import numpy as np
def func(x, y):
    return x*(1-x)*np.cos(4*np.pi*x) * np.sin(4*np.pi*y**2)**2

grid_x, grid_y = np.mgrid[0:1:100j, 0:1:200j]

rng = np.random.default_rng()
points = rng.random((1000, 2))
values = func(points[:,0], points[:,1])

from scipy.interpolate import griddata
grid_z0 = griddata(points, values, (grid_x, grid_y), method='nearest')
grid_z1 = griddata(points, values, (grid_x, grid_y), method='linear')
grid_z2 = griddata(points, values, (grid_x, grid_y), method='cubic')

from scipy import interpolate

tck = interpolate.bisplrep(points[:,0], points[:,1], values, s=0)
znew = interpolate.bisplev(grid_x, grid_y, tck)

plt.figure()
plt.pcolormesh(grid_x, grid_y, znew, shading='flat', **lims)
plt.colorbar()
plt.title("Interpolated function.")
plt.show()
2
import numpy as np
from scipy import interpolate
import matplotlib.pyplot as plt

x_edges, y_edges = np.mgrid[-1:1:21j, -1:1:21j]
x = x_edges[:-1, :-1] + np.diff(x_edges[:2, 0])[0] / 2.
y = y_edges[:-1, :-1] + np.diff(y_edges[0, :2])[0] / 2.
print(x_edges.shape, x.shape)

z = (x+y) * np.exp(-6.0*(x*x+y*y))
plt.figure()
lims = dict(cmap='RdBu_r', vmin=-0.25, vmax=0.25)
plt.pcolormesh(x_edges, y_edges, z, shading='flat', **lims)
plt.colorbar()
plt.title("Sparsely sampled function.")
plt.show()
3
xnew_edges, ynew_edges = np.mgrid[-1:1:71j, -1:1:71j]
xnew = xnew_edges[:-1, :-1] + np.diff(xnew_edges[:2, 0])[0] / 2.
ynew = ynew_edges[:-1, :-1] + np.diff(ynew_edges[0, :2])[0] / 2.

grid_x, grid_y = xnew, ynew
points = np.hstack((x.reshape(-1, 1), y.reshape(-1, 1)))
z = z.reshape(-1, 1)
print(points.shape, z.shape)
from scipy.interpolate import griddata
grid_z0 = griddata(points, z, (grid_x, grid_y), method='nearest').squeeze()
grid_z1 = griddata(points, z, (grid_x, grid_y), method='linear').squeeze()
grid_z2 = griddata(points, z, (grid_x, grid_y), method='cubic').squeeze()


print(grid_x.shape, grid_z0.shape)
plt.figure()
lims = dict(cmap='RdBu_r', vmin=-0.25, vmax=0.25)
plt.pcolormesh(xnew_edges, ynew_edges, grid_z0, shading='flat', **lims)
plt.colorbar()
plt.title("Sparsely sampled function.")
plt.show()

plt.figure()
lims = dict(cmap='RdBu_r', vmin=-0.25, vmax=0.25)
plt.pcolormesh(xnew_edges, ynew_edges, grid_z1, shading='flat', **lims)
plt.colorbar()
plt.title("Sparsely sampled function.")
plt.show()


plt.figure()
lims = dict(cmap='RdBu_r', vmin=-0.25, vmax=0.25)
plt.pcolormesh(xnew_edges, ynew_edges, grid_z2, shading='flat', **lims)
plt.colorbar()
plt.title("Sparsely sampled function.")
plt.show()

from scipy.interpolate import RegularGridInterpolator
print(points.shape, z.shape)

points1 = [np.linspace(-1, 1, 20), np.linspace(-1, 1, 20)]
interpg = RegularGridInterpolator(points1, z.reshape([20,20]))
test_points = np.array([grid_x.ravel(), grid_y.ravel()]).T
print( grid_x.shape)
im = interpg(test_points).reshape(70,70)

print(grid_x.shape, im.shape)
plt.figure()

lims = dict(cmap='RdBu_r', vmin=-0.25, vmax=0.25)
plt.pcolormesh(xnew_edges, ynew_edges, im, shading='flat', **lims)
plt.colorbar()
plt.title("Sparsely sampled function.")
plt.show()
4
import numpy as np
from scipy.interpolate import Rbf
import matplotlib.pyplot as plt
from matplotlib import cm

# 2-d tests - setup scattered data
rng = np.random.default_rng()
x = rng.random(400)*4.0-2.0
y = rng.random(400)*4.0-2.0
z = x*np.exp(-x**2-y**2)
edges = np.linspace(-2.0, 2.0, 101)
centers = edges[:-1] + np.diff(edges[:2])[0] / 2.
XI, YI = np.meshgrid(centers, centers)

# use RBF
rbf = Rbf(x, y, z, epsilon=2)
ZI = rbf(XI, YI)

# plot the result
plt.figure()
plt.subplot(1, 1, 1)
X_edges, Y_edges = np.meshgrid(edges, edges)
lims = dict(cmap='RdBu_r', vmin=-0.4, vmax=0.4)
plt.pcolormesh(X_edges, Y_edges, ZI, shading='flat', **lims)
plt.scatter(x, y, 100, z, edgecolor='w', lw=0.1, **lims)
plt.title('RBF interpolation - multiquadrics')
plt.xlim(-2, 2)
plt.ylim(-2, 2)
plt.colorbar()
plt.show()

points1 = np.array([x.ravel(), y.ravel()]).T
points2 = np.array([XI.ravel(), XI.ravel()]).T
grid_z2 = griddata(points1, z, points2, method='cubic').reshape(100, 100)
print(ZI.shape, grid_z2.shape)
# plot the result
plt.figure()
plt.subplot(1, 1, 1)
X_edges, Y_edges = np.meshgrid(edges, edges)
lims = dict(cmap='RdBu_r', vmin=-0.4, vmax=0.4)
plt.pcolormesh(X_edges, Y_edges, grid_z2, shading='flat', **lims)
plt.scatter(x, y, 100, z, edgecolor='w', lw=0.1, **lims)
plt.title('RBF interpolation - multiquadrics')
plt.xlim(-2, 2)
plt.ylim(-2, 2)
plt.colorbar()
5
import matplotlib.pyplot as plt
from scipy.interpolate import RegularGridInterpolator
def F(u, v):
    return u * np.cos(u * v) + v * np.sin(u * v)

fit_points = [np.linspace(0, 3, 8), np.linspace(0, 3, 8)]
values = F(*np.meshgrid(*fit_points, indexing='ij'))
print(fit_points, values.shape)

ut, vt = np.meshgrid(np.linspace(0, 3, 80), np.linspace(0, 3, 80), indexing='ij')
true_values = F(ut, vt)
test_points = np.array([ut.ravel(), vt.ravel()]).T
print(ut.shape, true_values.shape, test_points.shape)
1.1 1D
from scipy.interpolate import interp1d
1.2 2D, multivariate data
from scipy.interpolate import interp2d
from scipy.interpolate import griddata
可以应用在2Dlut,3Dlut的生成上面,当我们已经有了一些map point, 通过这些map point可以得到,输入grid data,可以得到一个查找表。
1.3 Multivariate data interpolation on a regular grid
from scipy.interpolate import RegularGridInterpolator
已知一些grid上的值。
可以应用在2Dlut,3Dlut,当我们已经有了一个多维查找表,然后整个图像作为输入,得到查找和插值后的输出。
sklearn.neighbors 最近邻相关算法,分类和插值
主要介绍 sklearn.neighbors 相关方法
1. 查找最近邻元素
from sklearn.neighbors import NearestNeighbors
import numpy as np

'''
找到K近邻
X是训练集,NearestNeighbors 拟合
Y是输入,输出与Y最近的训练集中的样本和距离
'''

# x 是离散的一些二维点
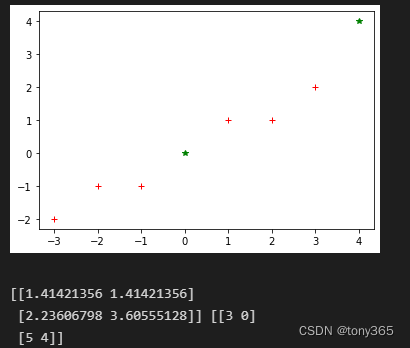
X = np.array([[-1, -1], [-2, -1], [-3, -2], [1, 1], [2, 1], [3, 2]])
# 最近邻模型,n_neighbors=2 表示2个最近邻,algorithm可以选择使用的算法,结果是一致的,效率高低不同, metric 选择度量方法
nbrs = NearestNeighbors(n_neighbors=2, algorithm='ball_tree', metric='euclidean').fit(X) # ['auto', 'ball_tree', 'kd_tree', 'brute']


Y = np.array([[0, 0], [4, 4]])
plt.figure()
plt.plot(X[..., 0], X[..., 1], 'r+', Y[..., 0], Y[..., 1], 'g*',)
plt.show()

# 查找 Y的2个最近邻的距离  和  索引
distances, indices = nbrs.kneighbors(Y)
print(distances, indices)
输出距离Y最近的2个元素索引和距离
输出邻接矩阵 和 可选的度量方法
# 输出邻接矩阵,稀疏图
nbrs.kneighbors_graph(Y).toarray()
# 输出可以使用的距离指标
from sklearn.neighbors import KDTree, BallTree
print(sorted(KDTree.valid_metrics))
print(sorted(BallTree.valid_metrics))
output:

2. 最近邻分类
最近邻分类,并不进行建模。
scikit-learn 实现了两种不同的最近邻分类器:
KNeighborsClassifier实现基于 查询点的k个最近邻居,其中k是由用户指定的整数值。
RadiusNeighborsClassifier根据固定半径内的邻居数量确定分类,其中r是由用户指定的浮点值。
k-neighbors 分类KNeighborsClassifier 是最常用的技术。k值的最优选择 高度依赖于数据:一般来说,一个更大的k 抑制噪声的影响,但使分类边界不那么明显。
在数据未均匀采样的情况下,基于半径的邻居分类RadiusNeighborsClassifier可能是更好的选择。用户指定固定半径r,使得稀疏邻域中的点使用较少的最近邻进行分类。
对于高维参数空间,由于所谓的“维数灾难”,这种方法变得不太有效。
基本的最近邻分类使用统一权重:也就是说,分配给查询点的值是根据最近邻的简单多数票计算得出的。在某些情况下,最好对邻居进行加权,使得更近的邻居对拟合的贡献更大。
这可以通过weights关键字来完成。默认值 为每个邻居分配统一的权重。 可以提供用户定义的距离函数来计算权重。weights = ‘uniform’ 或者 weights = ‘distance’
使用方法:
n_neighbors = 15
weights = 'distance'
clf = neighbors.KNeighborsClassifier(n_neighbors, weights=weights)
clf.fit(X, y)
clf.predict(input)
3. 最近邻回归
同理,也有最近邻回归
scikit-learn 实现了两个不同的邻居回归器:
KNeighborsRegressor实现基于 查询点的k个最近邻居,其中k是由用户指定的整数值。
RadiusNeighborsRegressor基于固定半径内的邻居实现学习查询点,其中r是由用户指定的浮点值。
使用方法:
n_neighbors = 5
weights = 'uniform'
knn = neighbors.KNeighborsRegressor(n_neighbors, weights=weights)
y_ = knn.fit(X, y).predict(input)
4. NearestCentroid 最近邻质心分类
NearestCentroid
如果我们不再是求解到所有样本的距离,而是求解到不同类别样本中心的距离,距离哪个样本中心最近,我们即认为该待预测样本属于哪个类,这就是NearestCentroid算法.
该算法能降低计算量,但是对于不是中心分布的样本来说,准确率不高。
from sklearn.neighbors import NearestCentroid
import numpy as np
X = np.array([[-1, -1], [-2, -1], [-3, -2], [1, 1], [2, 1], [3, 2]])
y = np.array([1, 1, 1, 2, 2, 2])
clf = NearestCentroid()
clf.fit(X, y)

print(clf.predict([[-0.8, -1]]))
shrink_threshold 参数
粗略理解是 类别中心的特征值 除以 类内方差, 再减去 shrink_threshold 参数,如果大于0,说明该特征方差较大,将被去除,避免影响分类结果。
目的在于去除noisy features,使用后效果有优化
如果有误,还请指正
shrinkage = 0.2
clf = NearestCentroid(shrink_threshold=shrinkage)
clf.fit(X, y)
y_pred = clf.predict(X)
5. Neighborhood Components Analysis 邻域成分分析
这篇博客解释的比较清楚 https://blog.csdn.net/Forlogen/article/details/104641190
Neighborhood Components Analysis 是将数据映射到另一个空间,(也可以理解为改变度量距离的函数)

在矩阵A的转换下,计算softmax 概率, 然后把同一类的概率加起来,希望这个概率大。

目标是希望正确分类的概率最大
目标函数为

目前使用 scipy 的 L-BFGS-B 进行Q的求解。 通过设置Q 的维度,可以达到降维的目的。
先使用 Neighborhood Components Analysis 进行转换,再应用KNeighborsClassifier 效果会更好, 因为Neighborhood Components Analysis 将样本转换到一个更好的表达空间。
如果用NCA降维,和LDA,PCA效果比较
NCA分数最高

代码如下:
# License: BSD 3 clause

import numpy as np
import matplotlib.pyplot as plt
from sklearn import datasets
from sklearn.model_selection import train_test_split
from sklearn.decomposition import PCA
from sklearn.discriminant_analysis import LinearDiscriminantAnalysis
from sklearn.neighbors import KNeighborsClassifier, NeighborhoodComponentsAnalysis
from sklearn.pipeline import make_pipeline
from sklearn.preprocessing import StandardScaler

n_neighbors = 3
random_state = 0

# Load Digits dataset
X, y = datasets.load_digits(return_X_y=True)

# Split into train/test
X_train, X_test, y_train, y_test = train_test_split(
    X, y, test_size=0.5, stratify=y, random_state=random_state
)

dim = len(X[0])
n_classes = len(np.unique(y))

# Reduce dimension to 2 with PCA
pca = make_pipeline(StandardScaler(), PCA(n_components=2, random_state=random_state))

# Reduce dimension to 2 with LinearDiscriminantAnalysis
lda = make_pipeline(StandardScaler(), LinearDiscriminantAnalysis(n_components=2))

# Reduce dimension to 2 with NeighborhoodComponentAnalysis
nca = make_pipeline(
    StandardScaler(),
    NeighborhoodComponentsAnalysis(n_components=2, random_state=random_state),
)

# Use a nearest neighbor classifier to evaluate the methods
knn = KNeighborsClassifier(n_neighbors=n_neighbors)

# Make a list of the methods to be compared
dim_reduction_methods = [("PCA", pca), ("LDA", lda), ("NCA", nca)]

# plt.figure()
for i, (name, model) in enumerate(dim_reduction_methods):
    plt.figure()
    # plt.subplot(1, 3, i + 1, aspect=1)

    # Fit the method's model
    model.fit(X_train, y_train)

    # Fit a nearest neighbor classifier on the embedded training set
    knn.fit(model.transform(X_train), y_train)

    # Compute the nearest neighbor accuracy on the embedded test set
    acc_knn = knn.score(model.transform(X_test), y_test)

    # Embed the data set in 2 dimensions using the fitted model
    X_embedded = model.transform(X)

    # Plot the projected points and show the evaluation score
    plt.scatter(X_embedded[:, 0], X_embedded[:, 1], c=y, s=30, cmap="Set1")
    plt.title(
        "{}, KNN (k={})\nTest accuracy = {:.2f}".format(name, n_neighbors, acc_knn)
    )
plt.show()
6. 参考
[1]https://scikit-learn.org/stable/modules/neighbors.html


