👨🎓个人主页:研学社的博客
💥💥💞💞欢迎来到本博客❤️❤️💥💥
🏆博主优势:🌞🌞🌞博客内容尽量做到思维缜密,逻辑清晰,为了方便读者。
⛳️座右铭:行百里者,半于九十。
📋📋📋本文目录如下:🎁🎁🎁
目录
💥1 概述
📚2 运行结果
🌈3 Matlab代码实现
🎉4 参考文献
💥1 概述
LQ/QR分解方法,用于估计具有基频和多次谐波的目标信号的观测中存在的加性背景噪声。
📚2 运行结果
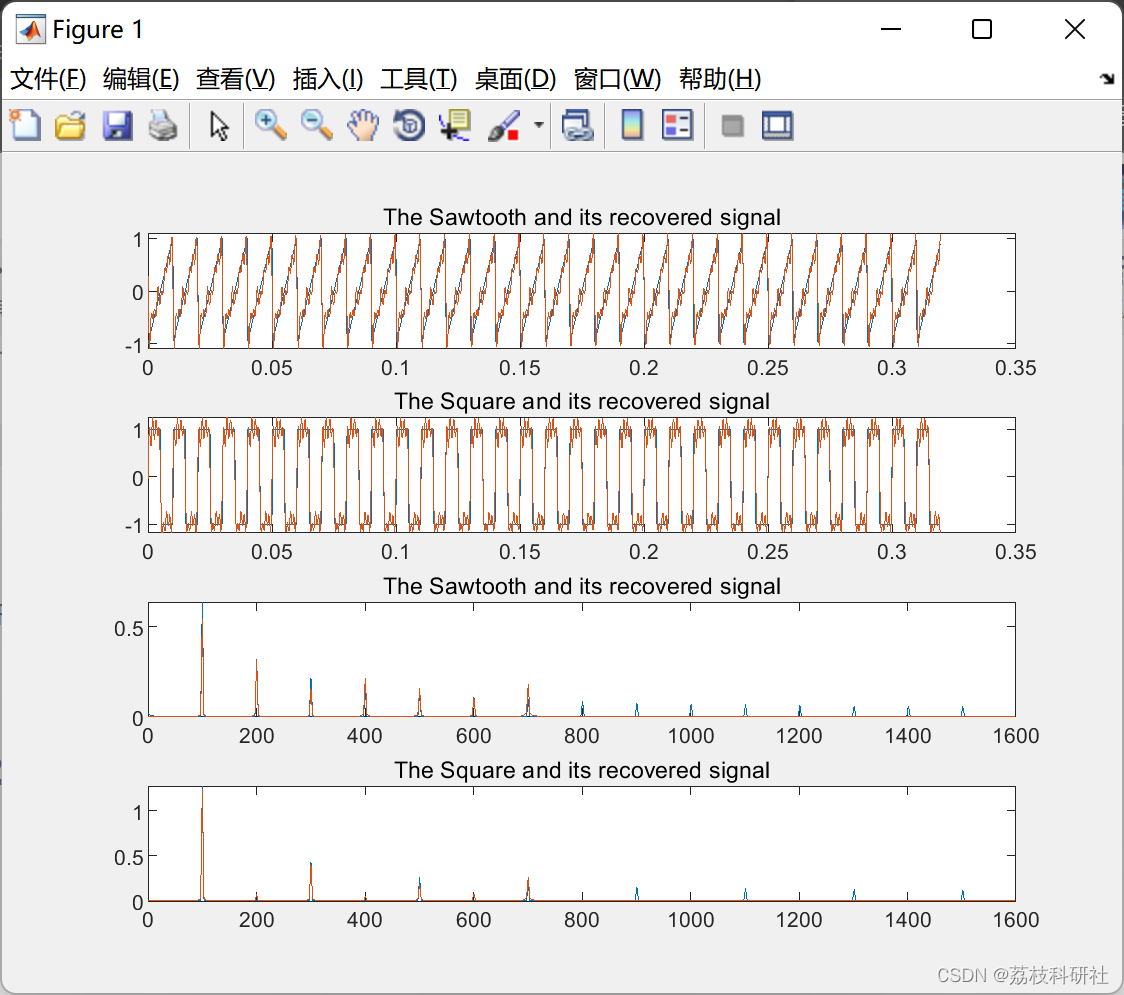
部分代码:
%In this example, QR noise estimation is used to recover
% two signals from a background noise.
% The tageted signals have a fundamental frequency at 100Hz
% and a number of harmonics at 200, 300, ..., 700Hz.
% 1. Create the trageted signals:
t=[0:1023]'*(1/3202);
S1=sawtooth(2*pi*100*t);
S2=square(2*pi*100*t);
% 2. Add a random noise:
O1=S1+randn(1024,1);
O2=S2+randn(1024,1);
% 3. Recover the targeted signals using QR noise estimation:
R1=QR_noise_estimation(O1,[100:100:700]);
R2=QR_noise_estimation(O2,[100:100:700]);
% Plot the time-series results:
subplot(411);plot([t t],[S1 R1])
title('The Sawtooth and its recovered signal')
subplot(412);plot([t t],[S2 R2])
title('The Square and its recovered signal')
% Obtain the frequency domain of results:
f=linspace(0,3201,1024)';
f=f(1:512);
F1=abs(fft([S1 R1])/512);
F1=F1(1:512,:);
F2=abs(fft([S2 R2])/512);
F2=F2(1:512,:);
% MSE performance:
MSE=[sqrt(mean((S1-R1).^2)), sqrt(mean((S2-R2).^2))]
% Plot the frequency domain results:
subplot(413);plot([f f],F1)
title('The Sawtooth and its recovered signal')
subplot(414);plot([f f],F2)
title('The Square and its recovered signal')
saveas(gcf, 'fig1.fig')
🌈3 Matlab代码实现
🎉4 参考文献
部分理论来源于网络,如有侵权请联系删除。





![[思维模式-13]:《复盘》-1- “知”篇 - 认识复盘](https://img-blog.csdnimg.cn/08f31da6b7904e6f9ee678d9c24c5f74.png)


