目录
一、使用前提
1、安装
2、创建文件
二、LineView.vue文件【相当于一个组件】
1、导入
2、methods方法下写init(){}方法进行选择
3、methods方法下写setOptioin(option)
4、init()函数调用
5、整合完整代码
三、IndexView.vue文件【实现组件引入显示】
1、引入
2、注册
3、显示
四、数据操作
1、series系列
2、title标题
3、legend图例
4、tooltip提示框
五、地图
1、前期准备
2、设置配置项
3、点击事件
六、动态数据渲染
1、问题提出
2、解决方案
整篇文章将通过实例讲述ECharts的基本使用
官网:快速上手 - Handbook - Apache ECharts
一、使用前提
1、安装
npm install echarts --save2、创建文件
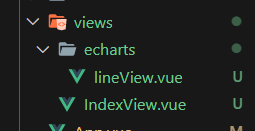
(1)在views文件夹下=》创建echarts=》创建LineView.vue文件
(2)在views文件夹下=》创建IndexView.vue【用于所有图片的展示】
二、LineView.vue文件【相当于一个组件】
1、导入
//5.0以上版本
import * as echarts from 'echarts'
//5.0以下
import  echarts from 'echarts'
2、methods方法下写init(){}方法进行选择
(1)获取dom元素
const dom = document.getElementById('')(2)初始化表
this.chart = echarts.init(dom)(3)配置项单独封装出去
this.setOptions()3、methods方法下写setOptioin(option)
(1)option的定义
const option = {
  xAxis: {
    type: "category",
    data: ["Mon", "Tue", "Wed", "Thu", "Fri", "Sat", "Sun"],
  },
  yAxis: {
    type: "value",
  },
  series: [
    {
      data: [150, 230, 224, 218, 135, 147, 260],
      type: "line",
    },
  ],
};
(2)option的作用
//作用:保证两样都有执行
option && this.chart.setOption(option)
4、init()函数调用
属于dom渲染,根据生命周期,要在mounted()调用
mounted() {
  this.init()
},
5、整合完整代码
<template>
  <div>
    <div id="line"></div>
  </div>
</template>

<script>
import * as echarts from "echarts";

export default {
  name: "LineView",

  data() {
    return {};
  },

  mounted() {
    this.init();
  },

  methods: {
    init() {
      // 获取dom元素
      var dom = document.getElementById("line");
      // 初始化表
      this.chart = echarts.init(dom);
      // 设置配置项
      this.setOptions();
    },
    setOptions() {
      const option = {
        xAxis: {
          type: "category",
          data: ["Mon", "Tue", "Wed", "Thu", "Fri", "Sat", "Sun"],
        },
        yAxis: {
          type: "value",
        },
        series: [
          {
            data: [150, 230, 224, 218, 135, 147, 260],
            type: "line",
          },
        ],
      };

      option && this.chart.setOption(option);
    },
  },
};
</script>

<style lang="scss" scoped>
#line {
  width: 500px;
  height: 500px;
}
</style>
三、IndexView.vue文件【实现组件引入显示】
1、引入
import lineView from './echarts/lineView.vue';2、注册
components:{
    lineView
},
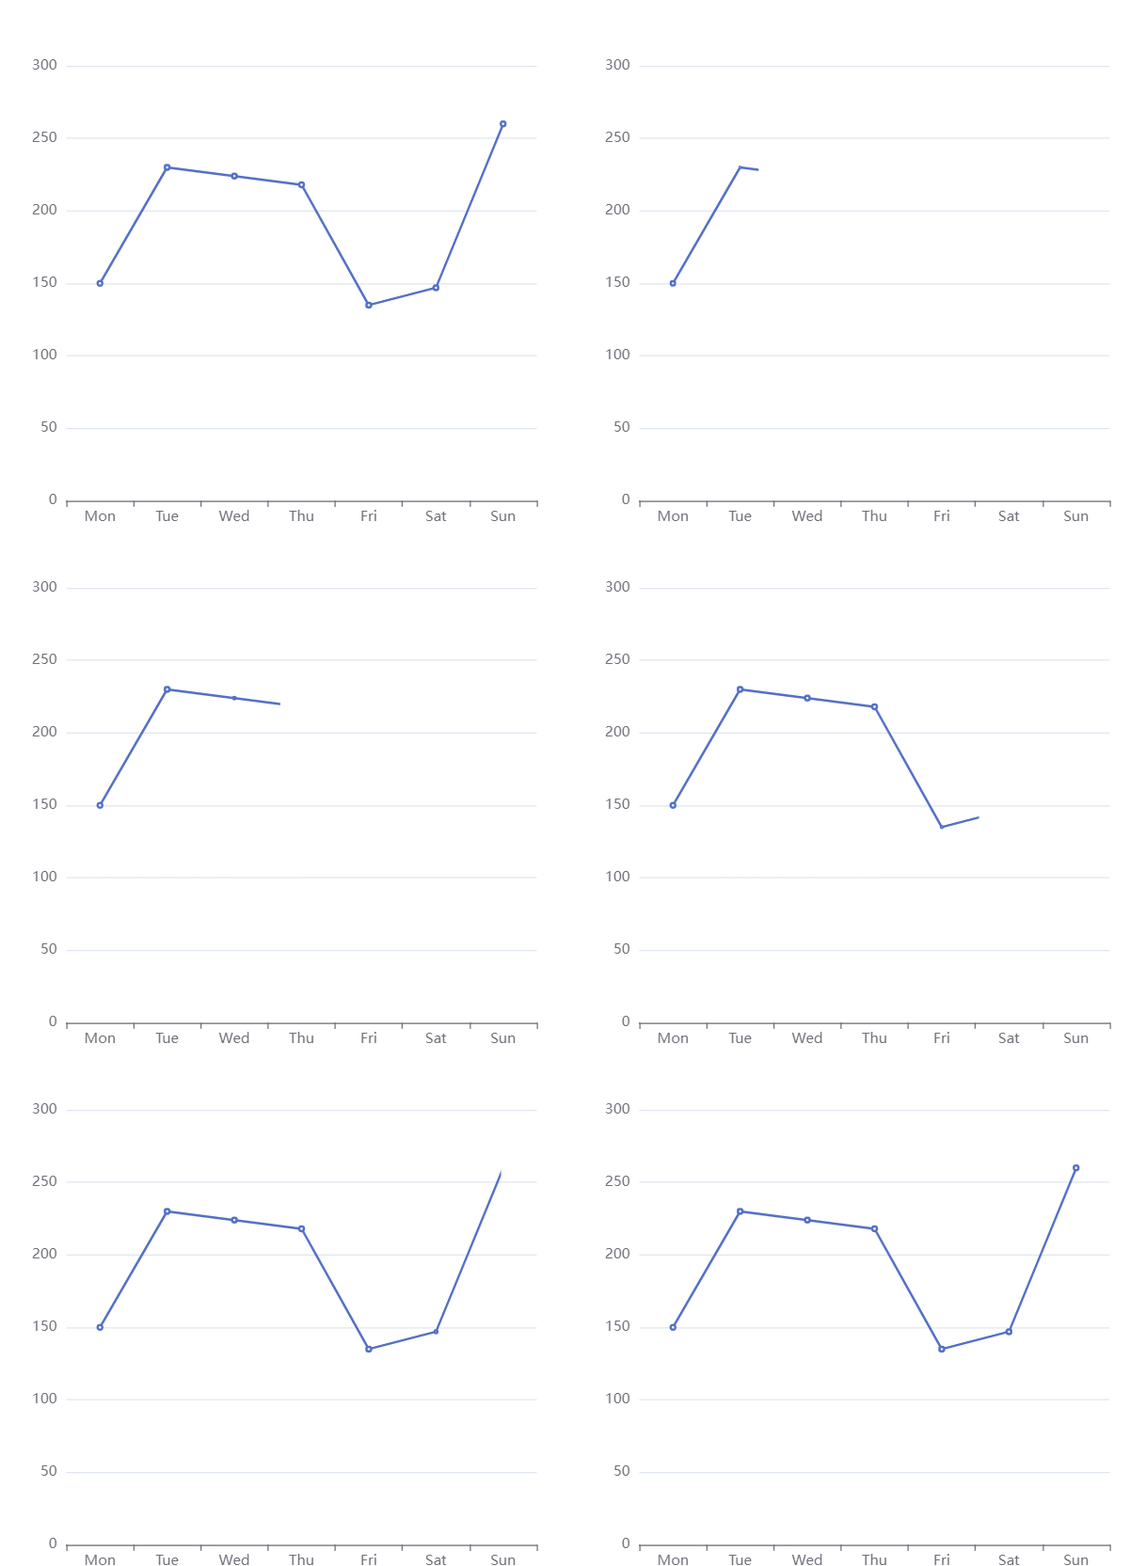
3、显示
<div class="index">
    <!-- 折线图 -->
    <div class="line">
    <lineView></lineView>
    </div>
</div>
.index {
width: 100%;
height: 100%;
.line {
width: 500px;
height: 500px;
}
}
四、数据操作
1、series系列
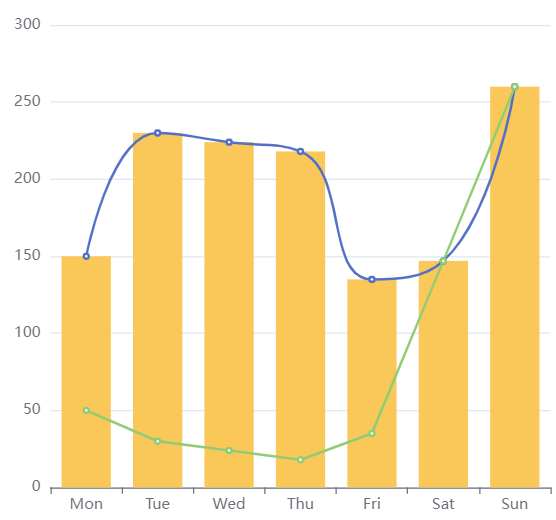
(1)折线图、柱状图
series: [
  {
    data: [150, 230, 224, 218, 135, 147, 260],//数据
    type: "line",//折线图
    smooth: true,//平滑
  },
  {
    data: [50, 30, 24, 18, 35, 147, 260],
    type: "line",//折线图
  },
  {
    data: [150, 230, 224, 218, 135, 147, 260],
    type: "bar",//柱状图
  },
],
(2)饼图
IndexView.vue
<template>
  <div>
    <div class="index">
      <!-- 折线图 -->
      <div class="line">
        <lineView></lineView>
      </div>
      <!-- 饼图 -->
      <div class="pie">
        <pieView></pieView>
      </div>
    </div>
  </div>
</template>

<script>
import lineView from "./echarts/lineView.vue";
import pieView from "./echarts/PieView.vue";

export default {
  name: "IndexView",

  components: {
    lineView,
    pieView,
  },

  data() {
    return {};
  },

  mounted() {},

  methods: {},
};
</script>

<style lang="scss" scoped>
.index {
  width: 100%;
  height: 100%;
  display: flex;
  .line {
    width: 500px;
    height: 500px;
  }
  .pie {
    width: 500px;
    height: 500px;
  }
}
</style>
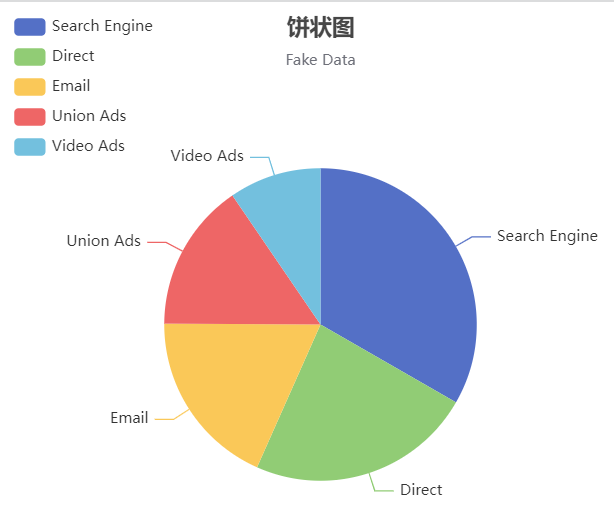
PieView.vue
<template>
  <div>
    <div id="PiePage"></div>
  </div>
</template>

<script>
import * as echarts from "echarts";

export default {
  name: "PieView",

  data() {
    return {};
  },

  mounted() {
    this.init();
  },

  methods: {
    init() {
      // 获取dom元素
      var dom = document.getElementById("PiePage");
      // 初始化表
      this.chart = echarts.init(dom);
      // 设置配置项
      this.setOptions();
    },
    setOptions() {
      const option = {
        title: {
          text: "饼状图",
          subtext: "Fake Data",
          left: "center",
        },
        tooltip: {
          trigger: "item",
        },
        legend: {
          orient: "vertical",
          left: "left",
        },
        series: [
          {
            name: "Access From",
            type: "pie",
            radius: '50%', //饼状大小
            data: [
              //数据
              { value: 1048, name: "Search Engine" },
              { value: 735, name: "Direct" },
              { value: 580, name: "Email" },
              { value: 484, name: "Union Ads" },
              { value: 300, name: "Video Ads" },
            ],
            emphasis: {
              //高亮状态
              itemStyle: {
                //样式
                shadowBlur: 10,
                shadowOffsetX: 0,
                shadowColor: "rgba(0, 0, 0, 0.5)",
              },
            },
          },
        ],
      };

      option && this.chart.setOption(option);
    },
  },
};
</script>

<style lang="scss" scoped>
#PiePage {
  width: 500px;
  height: 500px;
}
</style>
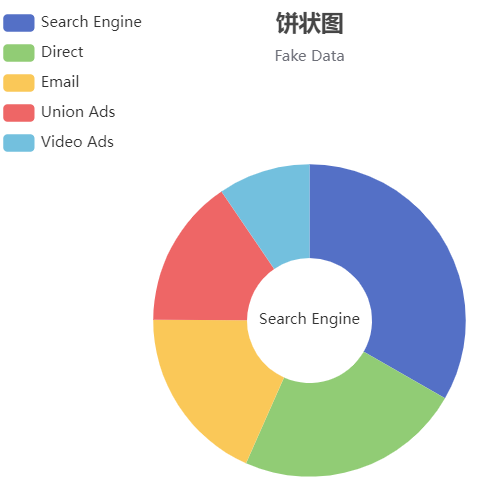
①通过radius指定外半径、内半径
series: [
  {
    name: "Access From",
    type: "pie",
    radius: ['20%','50%'],//[内半径, 外半径]
    data: [
      { value: 1048, name: "Search Engine" },
      { value: 735, name: "Direct" },
      { value: 580, name: "Email" },
      { value: 484, name: "Union Ads" },
      { value: 300, name: "Video Ads" },
    ],
    emphasis: {
      itemStyle: {
        shadowBlur: 10,
        shadowOffsetX: 0,
        shadowColor: "rgba(0, 0, 0, 0.5)",
      },
    },
  },
],
②文本标签
const option = {
  title: {
    text: "饼状图",
    subtext: "Fake Data",
    left: "center",
  },
  tooltip: {
    trigger: "item",
  },
  legend: {
    orient: "vertical",
    left: "left",
  },
  series: [
    {
      name: "Access From",
      type: "pie",
      radius: ["20%", "50%"], //[内半径, 外半径]
      data: [
        //数据
        { value: 1048, name: "Search Engine" },
        { value: 735, name: "Direct" },
        { value: 580, name: "Email" },
        { value: 484, name: "Union Ads" },
        { value: 300, name: "Video Ads" },
      ],
      label:{
        show:true,
        position:'center'
      },
      emphasis: {
        //高亮状态
        itemStyle: {
          //样式
          shadowBlur: 10,
          shadowOffsetX: 0,
          shadowColor: "rgba(0, 0, 0, 0.5)",
        },
      },
    },
  ],
};
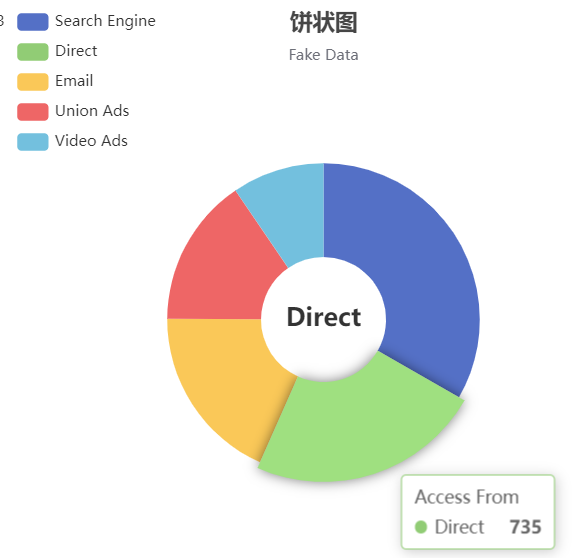
③emphasis高亮状态
const option = {
  title: {
    text: "饼状图",
    subtext: "Fake Data",
    left: "center",
  },
  tooltip: {
    trigger: "item",
  },
  legend: {
    orient: "vertical",
    left: "left",
  },
  series: [
    {
      name: "Access From",
      type: "pie",
      radius: ["20%", "50%"], //[内半径, 外半径]
      data: [
        //数据
        { value: 1048, name: "Search Engine" },
        { value: 735, name: "Direct" },
        { value: 580, name: "Email" },
        { value: 484, name: "Union Ads" },
        { value: 300, name: "Video Ads" },
      ],
      label:{
        show:false,
        position:'center'
      },
      //高亮状态
      emphasis: {
        //文字样式
        label:{
          show:true,
          fontSize:20,
          fontWeight:'bold'
        },
        //样式
        itemStyle: {
          shadowBlur: 10,
          shadowOffsetX: 0,
          shadowColor: "rgba(0, 0, 0, 0.5)",
        },
      },
    },
  ],
};
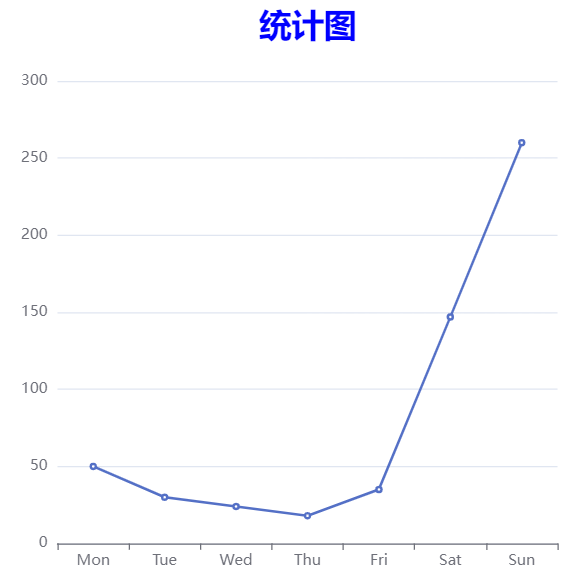
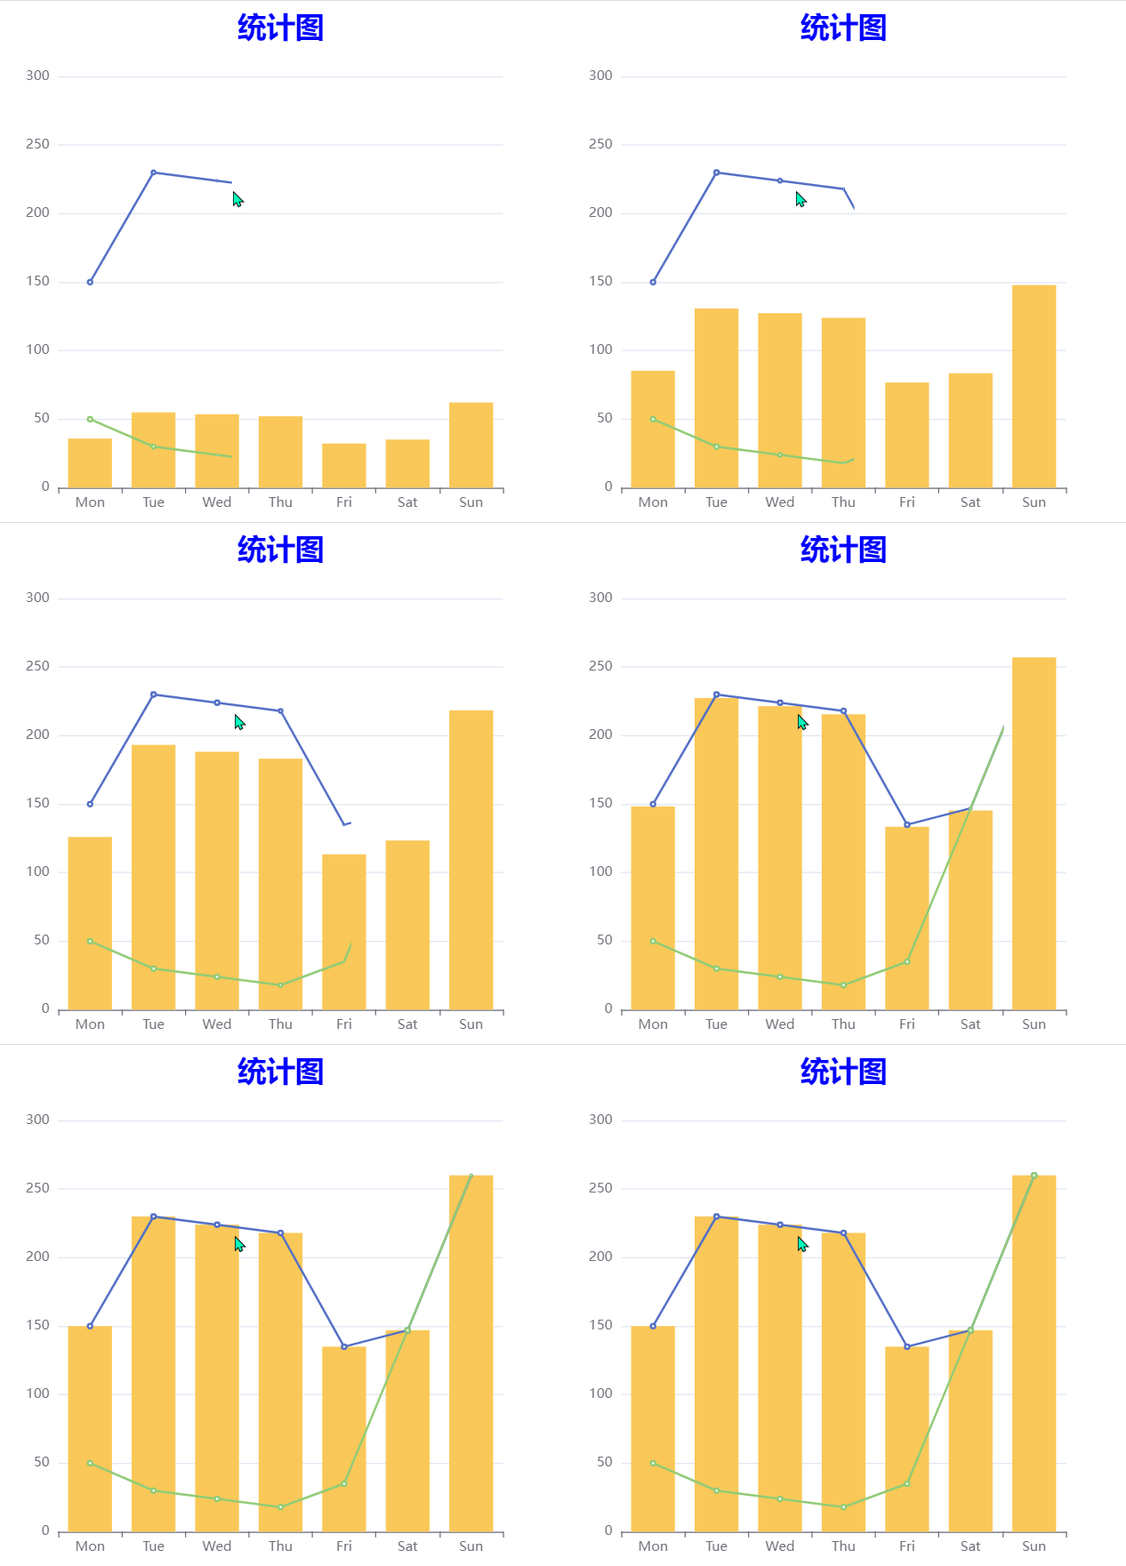
2、title标题
const option = {
  title:{
    text:'统计图',
    link:'https://www.baidu.com/',//跳转路径
    target:'blank',//在新页面打开
    textStyle:{
      color:"blue",
      fontSize:'26',
      fontWeight:"bold",
    },
    left:'center',
  },
  xAxis: {
    type: "category",
    data: ["Mon", "Tue", "Wed", "Thu", "Fri", "Sat", "Sun"],
  },
  yAxis: {
    type: "value",
  },
  series: [
    {
      data: [150, 230, 224, 218, 135, 147, 260],
      type: "line", //折线图
    },
    {
      data: [50, 30, 24, 18, 35, 147, 260],
      type: "line", //折线图
    },
    {
      data: [150, 230, 224, 218, 135, 147, 260],
      type: "bar", //柱状图
    },
  ],
};
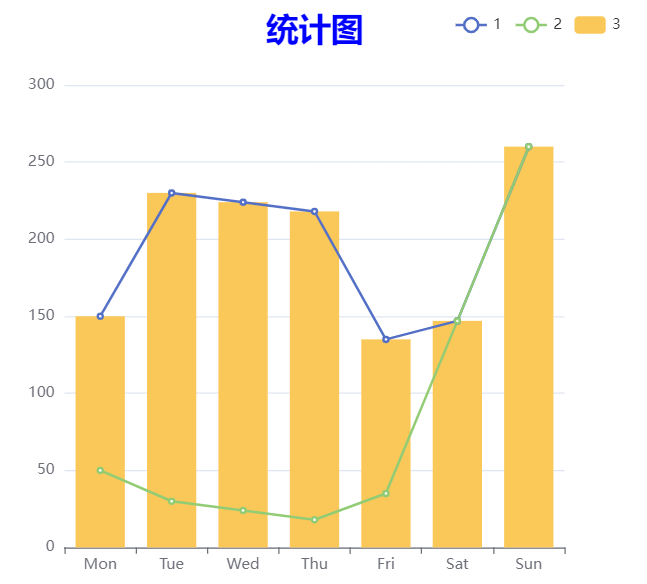
3、legend图例
const option = {
  title:{
    text:'统计图',
    link:'https://www.baidu.com/',//跳转路径
    target:'blank',//在新页面打开
    textStyle:{
      color:"blue",
      fontSize:'26',
      fontWeight:"bold",
    },
    left:'center',
  },
  legend: {
    data: ['1', '2', '3'],//对应的系列
    left:'right',
  },
  xAxis: {
    type: "category",
    data: ["Mon", "Tue", "Wed", "Thu", "Fri", "Sat", "Sun"],
  },
  yAxis: {
    type: "value",
  },
  series: [
    {
      name:'1',//对应图例
      data: [150, 230, 224, 218, 135, 147, 260],
      type: "line", //折线图
    },
    {
      name:'2',
      data: [50, 30, 24, 18, 35, 147, 260],
      type: "line", //折线图
    },
    {
      name:'3',
      data: [150, 230, 224, 218, 135, 147, 260],
      type: "bar", //柱状图
    },
  ],
};
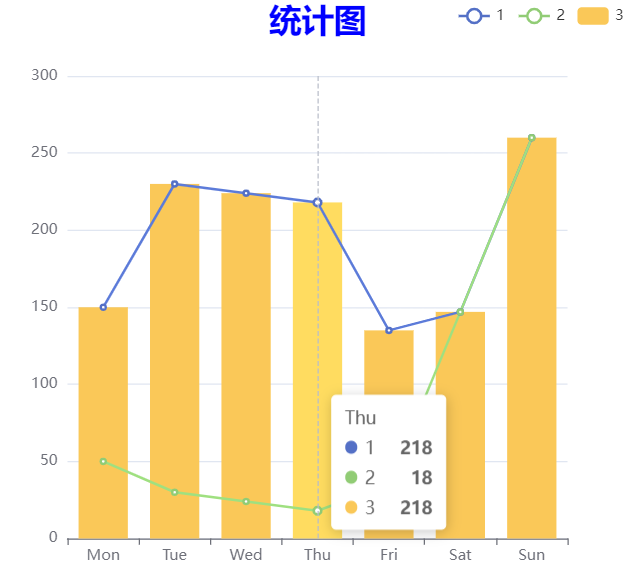
4、tooltip提示框
const option = {
  title:{
    text:'统计图',
    link:'https://www.baidu.com/',//跳转路径
    target:'blank',//在新页面打开
    textStyle:{
      color:"blue",
      fontSize:'26',
      fontWeight:"bold",
    },
    left:'center',
  },
  legend: {
    data: ['1', '2', '3'],//对应的系列
    left:'right',
  },
  tooltip:{
    show:true,//展示
    trigger:'axis',//同时显示三种数据,方便对比
  },
  xAxis: {
    type: "category",
    data: ["Mon", "Tue", "Wed", "Thu", "Fri", "Sat", "Sun"],
  },
  yAxis: {
    type: "value",
  },
  series: [
    {
      name:'1',//对应图例
      data: [150, 230, 224, 218, 135, 147, 260],
      type: "line", //折线图
    },
    {
      name:'2',
      data: [50, 30, 24, 18, 35, 147, 260],
      type: "line", //折线图
    },
    {
      name:'3',
      data: [150, 230, 224, 218, 135, 147, 260],
      type: "bar", //柱状图
    },
  ],
};
五、地图
1、前期准备
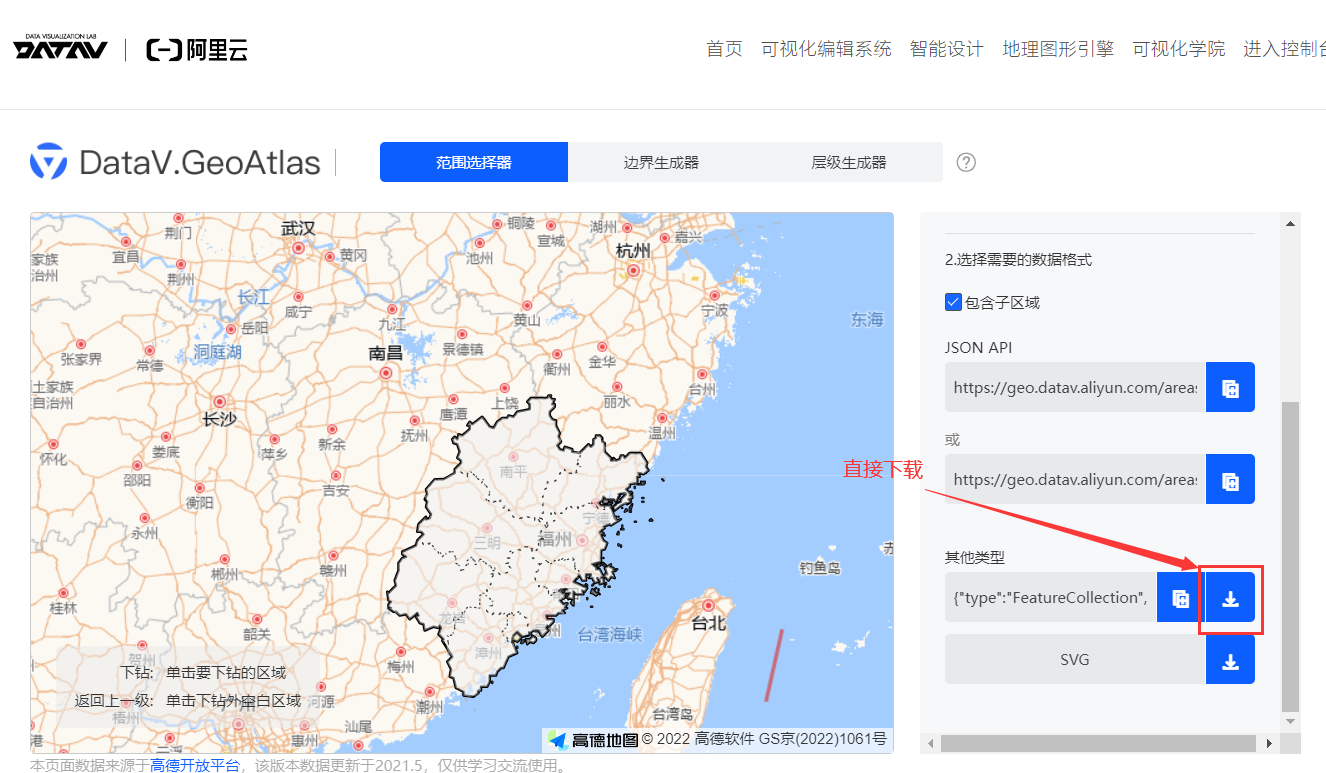
(1)获取JSON格式地图信息文档
DataV.GeoAtlas地理小工具系列由阿里云DataV数据可视化团队出品,多年深耕数据可视化领域,数据大屏业务开拓者和领航者。致力用震撼而清晰的视觉语言,让更多人读懂大数据,受惠数据驱动的决策方式。![]() http://datav.aliyun.com/portal/school/atlas/area_selector?spm=a2crr.23498931.0.0.29b915ddWQjcfk(2)下载需要的数据,小编以福建省为例子
http://datav.aliyun.com/portal/school/atlas/area_selector?spm=a2crr.23498931.0.0.29b915ddWQjcfk(2)下载需要的数据,小编以福建省为例子
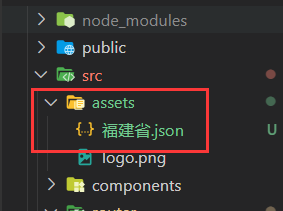
(3)放入静态文件夹assets中
(4)引入、注册地图
<template>
  <div>
    <div id="MapPage"></div>
  </div>
</template>

<script>
import * as echarts from 'echarts';
// 引入
import map from "@/assets/福建省.json";

export default {
  name: 'ThreeTwoMapView',

  data() {
    return {

    };
  },

  mounted() {

  },

  methods: {
    init(){
      const dom = document.getElementById('MapPage')
      this.chart = echarts.init(dom)
      // 注册地图
      echarts.registerMap('Fujian',map)
      // 设置配置项
      this.setOption()
    },
    setOption(){
      const option = {

      }

      option && this.chart.setOption(option);
    }
  },
};
</script>

<style lang="scss" scoped>
#MapPage{
  width: 500px;
  height: 500px;
}
</style>
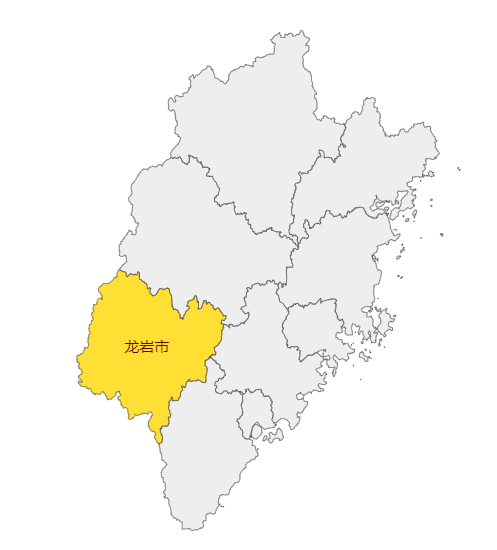
2、设置配置项
setOption(){
  const option = {
    series:[
      {
        name:'福建省',
        type:"map",
        map:'Fujian',
      }
    ]
  }

  option && this.chart.setOption(option);
}
(1)roam鼠标拖拽缩放、偏移
const option = {
  series:[
    {
      name:'福建省',
      type:"map",
      map:'Fujian',
      roam:true,
    }
  ]
}
(2)scaleLimit缩放限制
const option = {
  series: [
    {
      name: "福建省",
      type: "map",
      map: "Fujian",
      roam: true,//是否可缩放、偏移
      zoom:0.5,//初始缩放比例
      scaleLimit:{//缩放限制
        min:0.5,
        max:10,
      }
    },
  ],
};
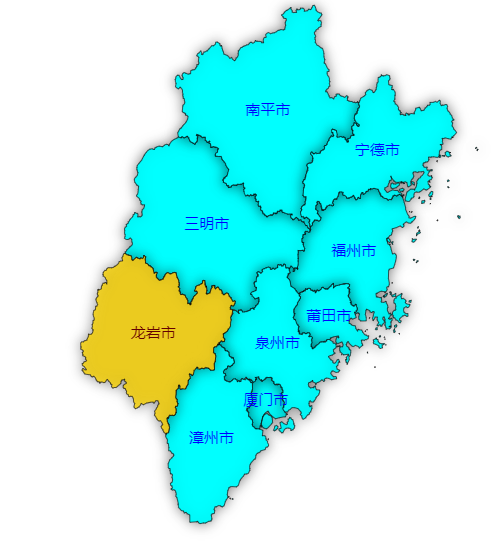
(3)itemStyle图形样式
const option = {
  series: [
    {
      name: "福建省",
      type: "map",
      map: "Fujian",
      roam: true,//是否可缩放、偏移
      zoom:0.5,//初始缩放比例
      scaleLimit:{//缩放限制
        min:0.5,
        max:10,
      },
      // 文本标签
      label:{
        show:true,
        color:"#0000ff"
      },
      // 图形样式
      itemStyle:{
        areaColor:"#00ffff",//区域颜色
        borderColor:'black',//描边颜色
        shadowColor:'rgba(0,0,0,0.5)',//阴影颜色
        shadowBlur:10,//阴影的模糊大小
      }
    },
  ],
};
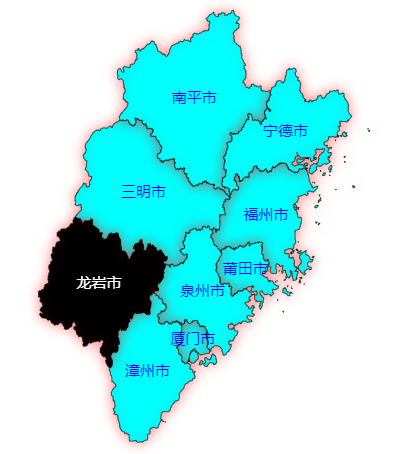
(4)emphasis高亮
const option = {
  series: [
    {
      name: "福建省",
      type: "map",
      map: "Fujian",
      roam: true,//是否可缩放、偏移
      zoom:0.5,//初始缩放比例
      scaleLimit:{//缩放限制
        min:0.5,
        max:10,
      },
      // 文本标签
      label:{
        show:true,
        color:"#0000ff"
      },
      // 图形样式
      itemStyle:{
        areaColor:"#00ffff",//区域颜色
        borderColor:'black',//描边颜色
        shadowColor:'rgba(255,0,0,0.5)',//阴影颜色
        shadowBlur:10,//阴影的模糊大小
      },
      // 高亮
      emphasis:{
        label:{
          show:true,
          color:'#fff'
        },
        // 图形样式
        itemStyle:{
          areaColor:"#000",//区域颜色
          borderColor:'black',//描边颜色
        },
      }
    },
  ],
};
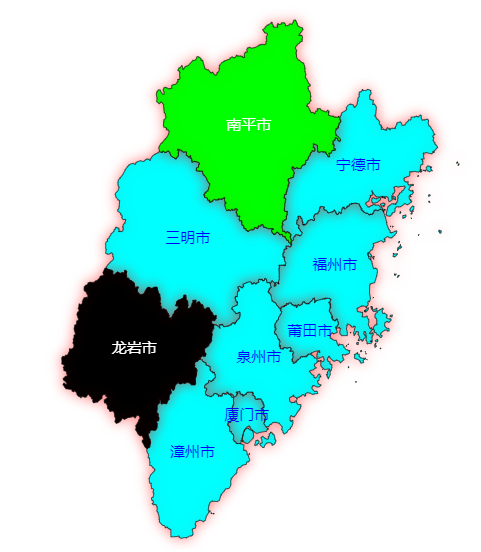
(5)选中
// 选中
select:{
  label:{
    show:true,
    color:'#fff'
  },
  // 图形样式
  itemStyle:{
    areaColor:"#0f0",//区域颜色
    borderColor:'black',//描边颜色
  },
},
3、点击事件
init() {
  const dom = document.getElementById("MapPage");
  this.chart = echarts.init(dom);
  // 注册地图
  echarts.registerMap("Fujian", map);
  // 点击
  this.chart.on("click", (params) => {
    console.log(params);
  });
  // 设置配置项
  this.setOption();
},
六、动态数据渲染
1、问题提出
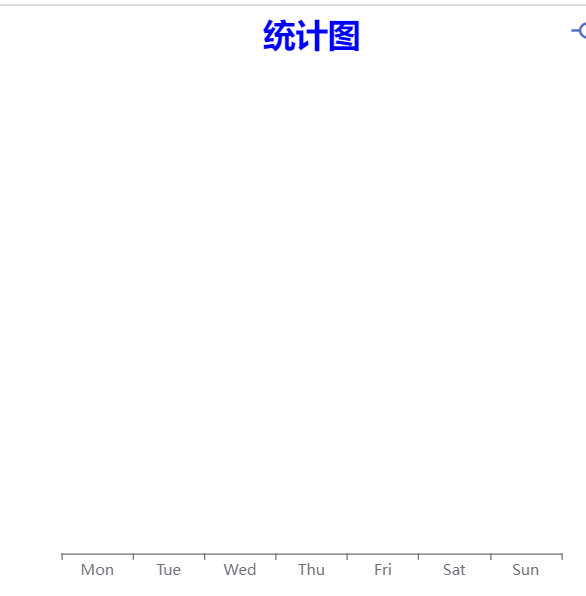
当data数据是动态的,在created的dom还没有渲染时,异步获取数据,发现图并不能绘制成功
export default {
  name: "LineView",

  data() {
    return {
      arr:[],//动态数据
    };
  },

  created(){
    // dom还没有渲染
    this.arrApi()
  },

  mounted() {
    this.init();
  },

  methods: {
    init() {
      // 获取dom元素
      var dom = document.getElementById("line");
      // 初始化表
      this.chart = echarts.init(dom);
      // 设置配置项
      this.setOptions();
    },
    setOptions() {
      const option = {
        title: {
          text: "统计图",
          link: "https://www.baidu.com/", //跳转路径
          target: "blank", //在新页面打开
          textStyle: {
            color: "blue",
            fontSize: "26",
            fontWeight: "bold",
          },
          left: "center",
        },
        legend: {
          data: ["1", "2", "3"], //对应的系列
          left: "right",
        },
        tooltip: {
          show: true, //展示
          trigger: "axis", //同时显示三种数据,方便对比
        },
        xAxis: {
          type: "category",
          data: ["Mon", "Tue", "Wed", "Thu", "Fri", "Sat", "Sun"],
        },
        yAxis: {
          type: "value",
        },
        series: [
          {
            name: "1", //对应图例
            data: this.arr,
            type: "line", //折线图
          },
        ],
      };

      option && this.chart.setOption(option);
    },
    // 模拟异步请求获取数据
    arrApi(){
      setTimeout(()=>{
        this.arr = [50, 30, 24, 18, 35, 147, 260]
      })
    }
  },
};
2、解决方案
监听数据变化时,再次绘制即可
// 监听数据变化
watch:{
  arr:{
    handler(newV,oldV){
      console.log(newV,oldV);
      this.setOptions()//再次调用配置项
    }
  }
}, 