Python海洋专题五之水深地形图海岸填充
海洋与大气科学
上期读取nc水深文件,并出图
但是存在一些不完美,本期修饰
本期内容
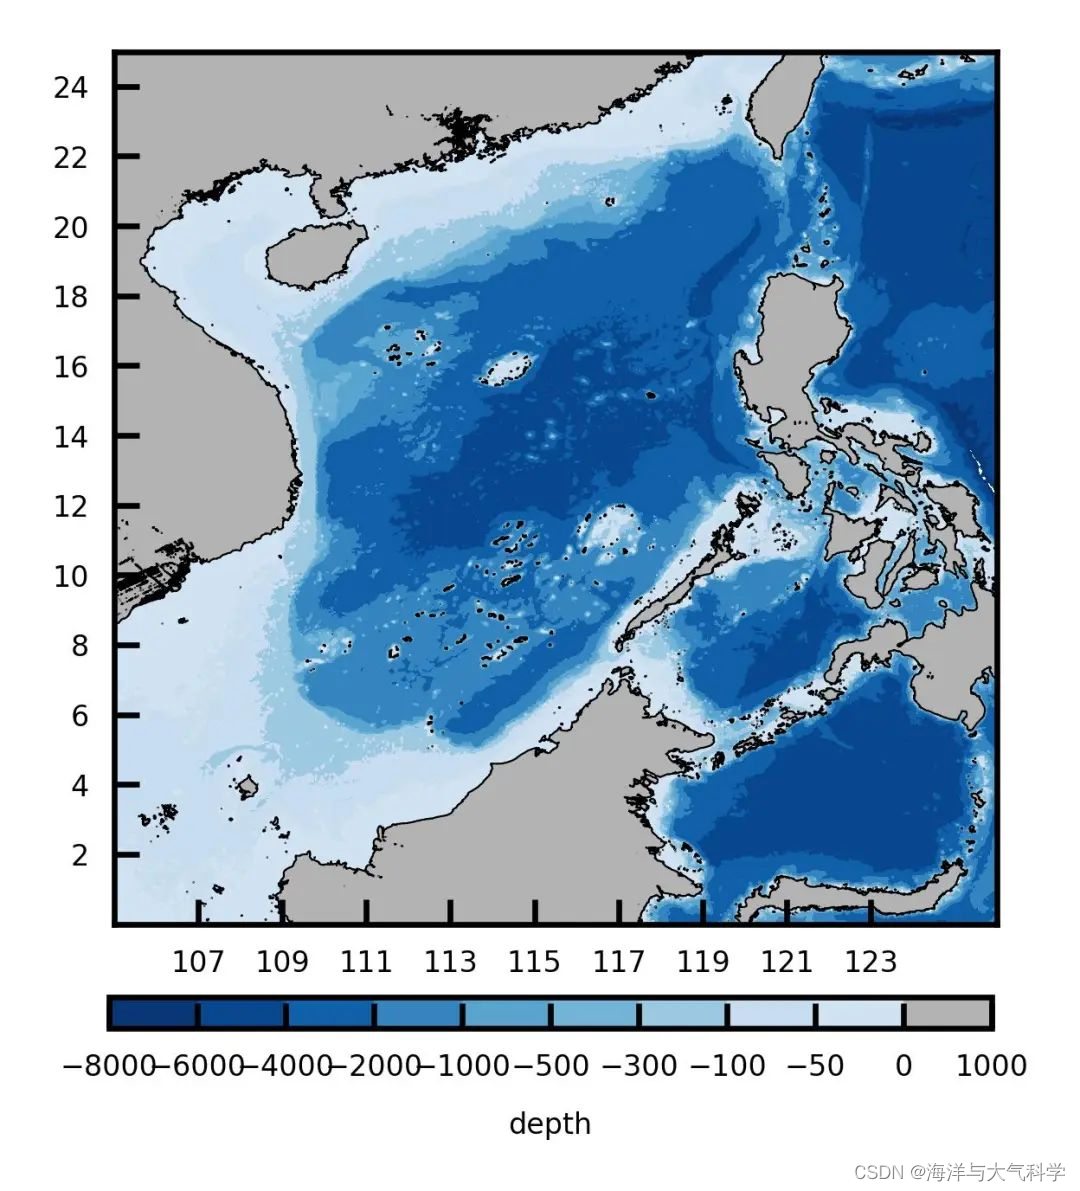
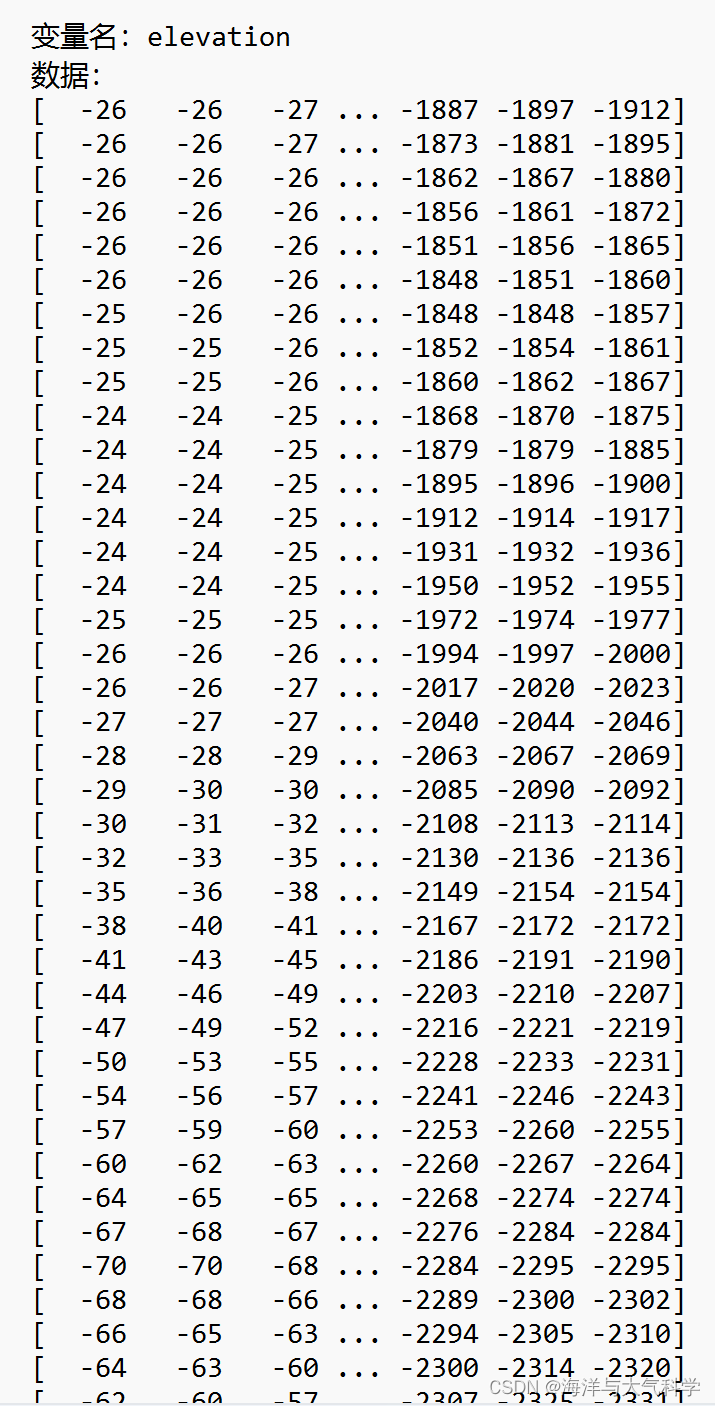
障眼法:把大于零的数据填充为陆地的灰色;
把等于零的数据画等深线为陆地和海洋的分界线!为海岸线。
效果图
参考文献及其在本文中的作用
1:matplotlib的colorbar设置显示的刻度个数和指定的刻度值_plt.bar显示个数-CSDN博客
其作用设置colorbar的刻度。
全文代码
# -*- coding: utf-8 -*-
# %%
# Importing related function packages
import pandas as pd
# import os
# from PIL import Image

import matplotlib.pyplot as plt  # https://matplotlib.org/
import numpy as np
from netCDF4 import Dataset
import matplotlib as mpl
# import palettes
from palettable.cartocolors.sequential import DarkMint_7
from palettable.colorbrewer.sequential import GnBu_9
from palettable.colorbrewer.sequential import Blues_9
from pylab import *
import matplotlib.ticker as ticker

def reverse_colourmap(cmap, name='my_cmap_r'):
    reverse = []
    k = []

    for key in cmap._segmentdata:
        k.append(key)
        channel = cmap._segmentdata[key]
        data = []

        for t in channel:
            data.append((1 - t[0], t[2], t[1]))
        reverse.append(sorted(data))

    LinearL = dict(zip(k, reverse))
    my_cmap_r = mpl.colors.LinearSegmentedColormap(name, LinearL)
    return my_cmap_r


# read data
a = Dataset('D:\pycharm_work\data\scs_etopo.nc')
print(a)
lon = a.variables['lon'][:]
lat = a.variables['lat'][:]
ele = a.variables['elevation'][:]
# plot figure
cmap = GnBu_9.mpl_colormap
cmap_r = reverse_colourmap(cmap)
print(Blues_9.colors)
ele[ele > 0] = 1000
#%% 图五
fig = plt.figure(dpi=300, figsize=(2, 2), facecolor='w', edgecolor='blue')
mngr = plt.get_current_fig_manager()  # 获取当前figure manager
mngr.window.wm_geometry("+58+51")  # 调整窗口在屏幕上弹出的位置
ax = fig.add_axes([0.08, 0.15, 0.85, 0.84])  # [距离左边,下边,坐标轴宽度,坐标轴高度] 范围(0, 1)
# 改变文字大小参数-fontsize
plt.xticks(np.arange(105, 125, 2), fontsize= 4)
plt.yticks(np.arange(0, 25, 2), fontsize= 4)
 # 绘制地图
#画0的等值线为海岸线。
cmarker=plt.contour(lon, lat, ele[:, :], levels=0, colors='k',linewidths=0.25)
levels = [-8000,  -6000,  -4000,  -2000, -1000, -500,  -300, -100,-50, 0, 1000]  # 创建分级
#color = [[0,51/255,102/255],[0,76/255,153/255],[0,102/255,204/255],[0,128/255,255/255],[51/255,153/255,255/255],[102/255,178/255,255/255],[153/255,204/255,255/255],[204/255,229/255,255/255],[160/255,160/255,160/255]] # 设置色带
color = [[0.0313725490196078,   0.211764705882353, 0.466666666666667],[0.0313725490196078,    0.274509803921569, 0.556862745098039],[0.0627450980392157,    0.376470588235294, 0.662745098039216],[0.203921568627451, 0.521568627450980, 0.749019607843137],[0.349019607843137, 0.639215686274510, 0.815686274509804],[0.454901960784314, 0.701960784313725, 0.847058823529412],[0.611764705882353, 0.788235294117647, 0.882352941176471],[0.784313725490196, 0.862745098039216, 0.941176470588235],[0.819607843137255, 0.886274509803922, 0.949019607843137],[0.7,0.7,0.7]]
plt.contourf(lon, lat, ele[:, :], levels=levels, colors=color)
# ------tick向内
tick_params(direction='in')
# -------colorbar调整
position = fig.add_axes([0.075, 0.05, 0.85, 0.03])#位置[左,下,右,上]
cb = plt.colorbar(label="depth", cax=position, orientation='horizontal')#方向
cb.ax.tick_params(labelsize=4) #设置colorbar刻度字体大小。
cb.set_label('depth',fontsize= 4,color='k' )#设置colorbar的标签字体及其大小
# 设置colorbar的刻度
cb.set_ticks([-8000,  -6000,  -4000,  -2000, -1000, -500,  -300, -100,-50, 0, 1000] )
cb.update_ticks()
# ------tick向内
tick_params(direction='in')
plt.savefig('scs_elevation.jpg', dpi=600, bbox_inches='tight', pad_inches=0.1)  # 输出地图,并设置边框空白紧密
plt.show()
图片




![buuctf-[WUSTCTF2020]CV Maker](https://img-blog.csdnimg.cn/b89cf572a8b544f79d35ad553c93897c.png)
