App用户细分是根据用户与App的互动方式对用户进行分组的任务。它有助于找到保留用户,找到营销活动的用户群,并解决许多其他需要基于相似特征搜索用户的业务问题。这篇文章中,将带你完成使用Python进行机器学习的App用户细分任务。
App用户细分
在App用户细分的问题中,我们需要根据用户与App的互动方式对用户进行分组。因此,为了解决这个问题,我们需要根据用户如何使用App来获得有关用户的数据。
导入必要的Python库和数据集:
import plotly.graph_objects as go
import plotly.express as px
import plotly.io as pio
import pandas as pd
pio.templates.default = "plotly_white"

data = pd.read_csv("userbehaviour.csv")
print(data.head())
输出
   userid  Average Screen Time  Average Spent on App (INR)  Left Review  \
0    1001                 17.0                       634.0            1
1    1002                  0.0                        54.0            0
2    1003                 37.0                       207.0            0
3    1004                 32.0                       445.0            1
4    1005                 45.0                       427.0            1

   Ratings  New Password Request  Last Visited Minutes       Status
0        9                     7                  2990    Installed
1        4                     8                 24008  Uninstalled
2        8                     5                   971    Installed
3        6                     2                   799    Installed
4        5                     6                  3668    Installed
让我们先来看看所有用户的最高、最低和平均屏幕时间:
print(f'Average Screen Time = {data["Average Screen Time"].mean()}')
print(f'Highest Screen Time = {data["Average Screen Time"].max()}')
print(f'Lowest Screen Time = {data["Average Screen Time"].min()}')
输出
Average Screen Time = 24.39039039039039
Highest Screen Time = 50.0
Lowest Screen Time = 0.0
现在让我们来看看所有用户的最高、最低和平均支出金额:
print(f'Average Spend of the Users = {data["Average Spent on App (INR)"].mean()}')
print(f'Highest Spend of the Users = {data["Average Spent on App (INR)"].max()}')
print(f'Lowest Spend of the Users = {data["Average Spent on App (INR)"].min()}')
输出
Average Spend of the Users = 424.4154154154154
Highest Spend of the Users = 998.0
Lowest Spend of the Users = 0.0
现在我们来看看活跃用户和卸载了APP的用户的消费能力和屏幕时间的关系:
figure = px.scatter(data_frame = data,
                    x="Average Screen Time",
                    y="Average Spent on App (INR)",
                    size="Average Spent on App (INR)",
                    color= "Status",
                    title = "Relationship Between Spending Capacity and Screentime",
                    trendline="ols")
figure.show()

卸载该App的用户平均每天屏幕时间不到5分钟,平均花费不到100。我们还可以看到平均屏幕时间与仍在使用该App的用户的平均支出之间存在线性关系。
现在我们来看看用户给出的评分和平均屏幕时间之间的关系:
figure = px.scatter(data_frame = data,
                    x="Average Screen Time",
                    y="Ratings",
                    size="Ratings",
                    color= "Status",
                    title = "Relationship Between Ratings and Screentime",
                    trendline="ols")
figure.show()

所以我们可以看到,卸载该应用的用户给该应用的评分最多为5分。与评分更高的用户相比,他们的屏幕时间非常低。所以,这描述了那些不喜欢花更多时间的用户对App的评价很低,并在某个时候卸载它。
App用户细分–查找保留和丢失的用户
现在,让我们继续进行App用户细分,以找到App保留和永远失去的用户。这里将使用机器学习中的K-means聚类算法来完成这项任务:
clustering_data = data[["Average Screen Time", "Left Review",
                        "Ratings", "Last Visited Minutes",
                        "Average Spent on App (INR)",
                        "New Password Request"]]

from sklearn.preprocessing import MinMaxScaler
for i in clustering_data.columns:
    MinMaxScaler(i)

from sklearn.cluster import KMeans
kmeans = KMeans(n_clusters=3)
clusters = kmeans.fit_predict(clustering_data)
data["Segments"] = clusters

print(data.head(10))
输出
   userid  Average Screen Time  Average Spent on App (INR)  Left Review  \
0    1001                 17.0                       634.0            1
1    1002                  0.0                        54.0            0
2    1003                 37.0                       207.0            0
3    1004                 32.0                       445.0            1
4    1005                 45.0                       427.0            1
5    1006                 28.0                       599.0            0
6    1007                 49.0                       887.0            1
7    1008                  8.0                        31.0            0
8    1009                 28.0                       741.0            1
9    1010                 28.0                       524.0            1

   Ratings  New Password Request  Last Visited Minutes       Status  Segments
0        9                     7                  2990    Installed         0
1        4                     8                 24008  Uninstalled         2
2        8                     5                   971    Installed         0
3        6                     2                   799    Installed         0
4        5                     6                  3668    Installed         0
5        9                     4                  2878    Installed         0
6        9                     6                  4481    Installed         0
7        2                     1                  1715    Installed         0
8        8                     2                   801    Installed         0
9        8                     4                  4621    Installed         0
现在让我们来看看我们得到的数据划分:
print(data[“Segments”].value_counts())
输出
0    910
1     45
2     44
Name: Segments, dtype: int64
现在让我们重命名这些数据段,以便更好地理解:
data["Segments"] = data["Segments"].map({0: "Retained", 1:
    "Churn", 2: "Needs Attention"})
进行数据可视化:
PLOT = go.Figure()
for i in list(data["Segments"].unique()):


    PLOT.add_trace(go.Scatter(x = data[data["Segments"]== i]['Last Visited Minutes'],
                                y = data[data["Segments"] == i]['Average Spent on App (INR)'],
                                mode = 'markers',marker_size = 6, marker_line_width = 1,
                                name = str(i)))
PLOT.update_traces(hovertemplate='Last Visited Minutes: %{x} <br>Average Spent on App (INR): %{y}')


PLOT.update_layout(width = 800, height = 800, autosize = True, showlegend = True,
                   yaxis_title = 'Average Spent on App (INR)',
                   xaxis_title = 'Last Visited Minutes',
                   scene = dict(xaxis=dict(title = 'Last Visited Minutes', titlefont_color = 'black'),
                                yaxis=dict(title = 'Average Spent on App (INR)', titlefont_color = 'black')))
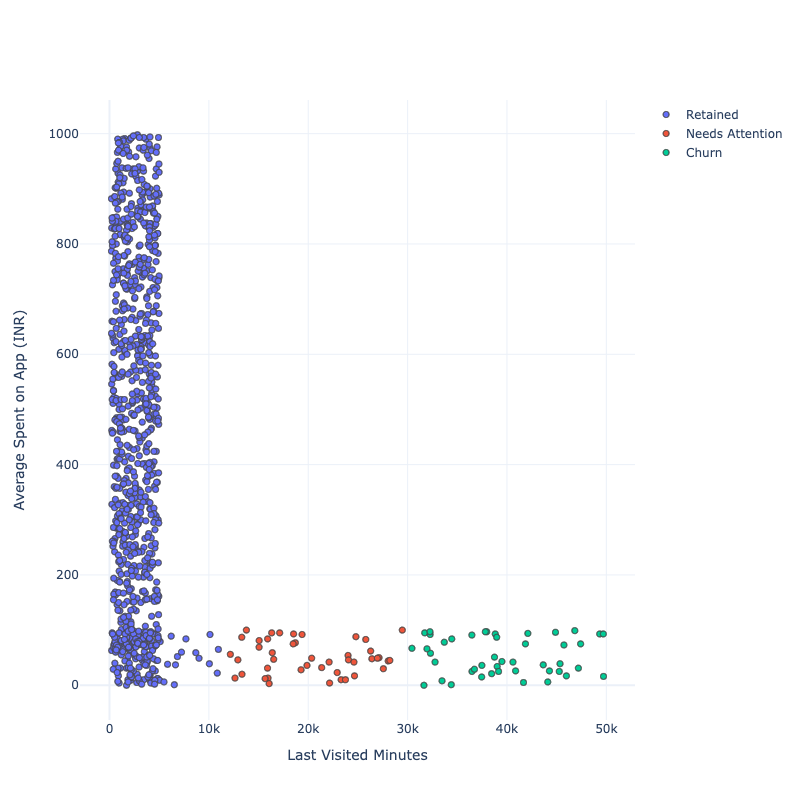
蓝色部分显示了App随着时间的推移保留的用户部分。红色部分表示刚刚卸载App或即将卸载App的用户部分。绿色部分表示App丢失的用户部分。
总结
这就是你如何根据用户与App的互动方式来细分用户。App用户细分可以帮助企业找到留存用户,找到营销活动的用户细分,并解决许多其他需要基于相似特征搜索用户的业务问题。以上是使用Python进行App用户细分的任务。
