接前一篇文章:BCC源码内容概览(4)
本文参考官网中的Contents部分的介绍。
BCC源码根目录的文件,其中一些是同时包含C和Python的单个文件,另一些是.c和.py的成对文件,还有一些是目录。
工具(Tools)
eBPF工具概览图如下:
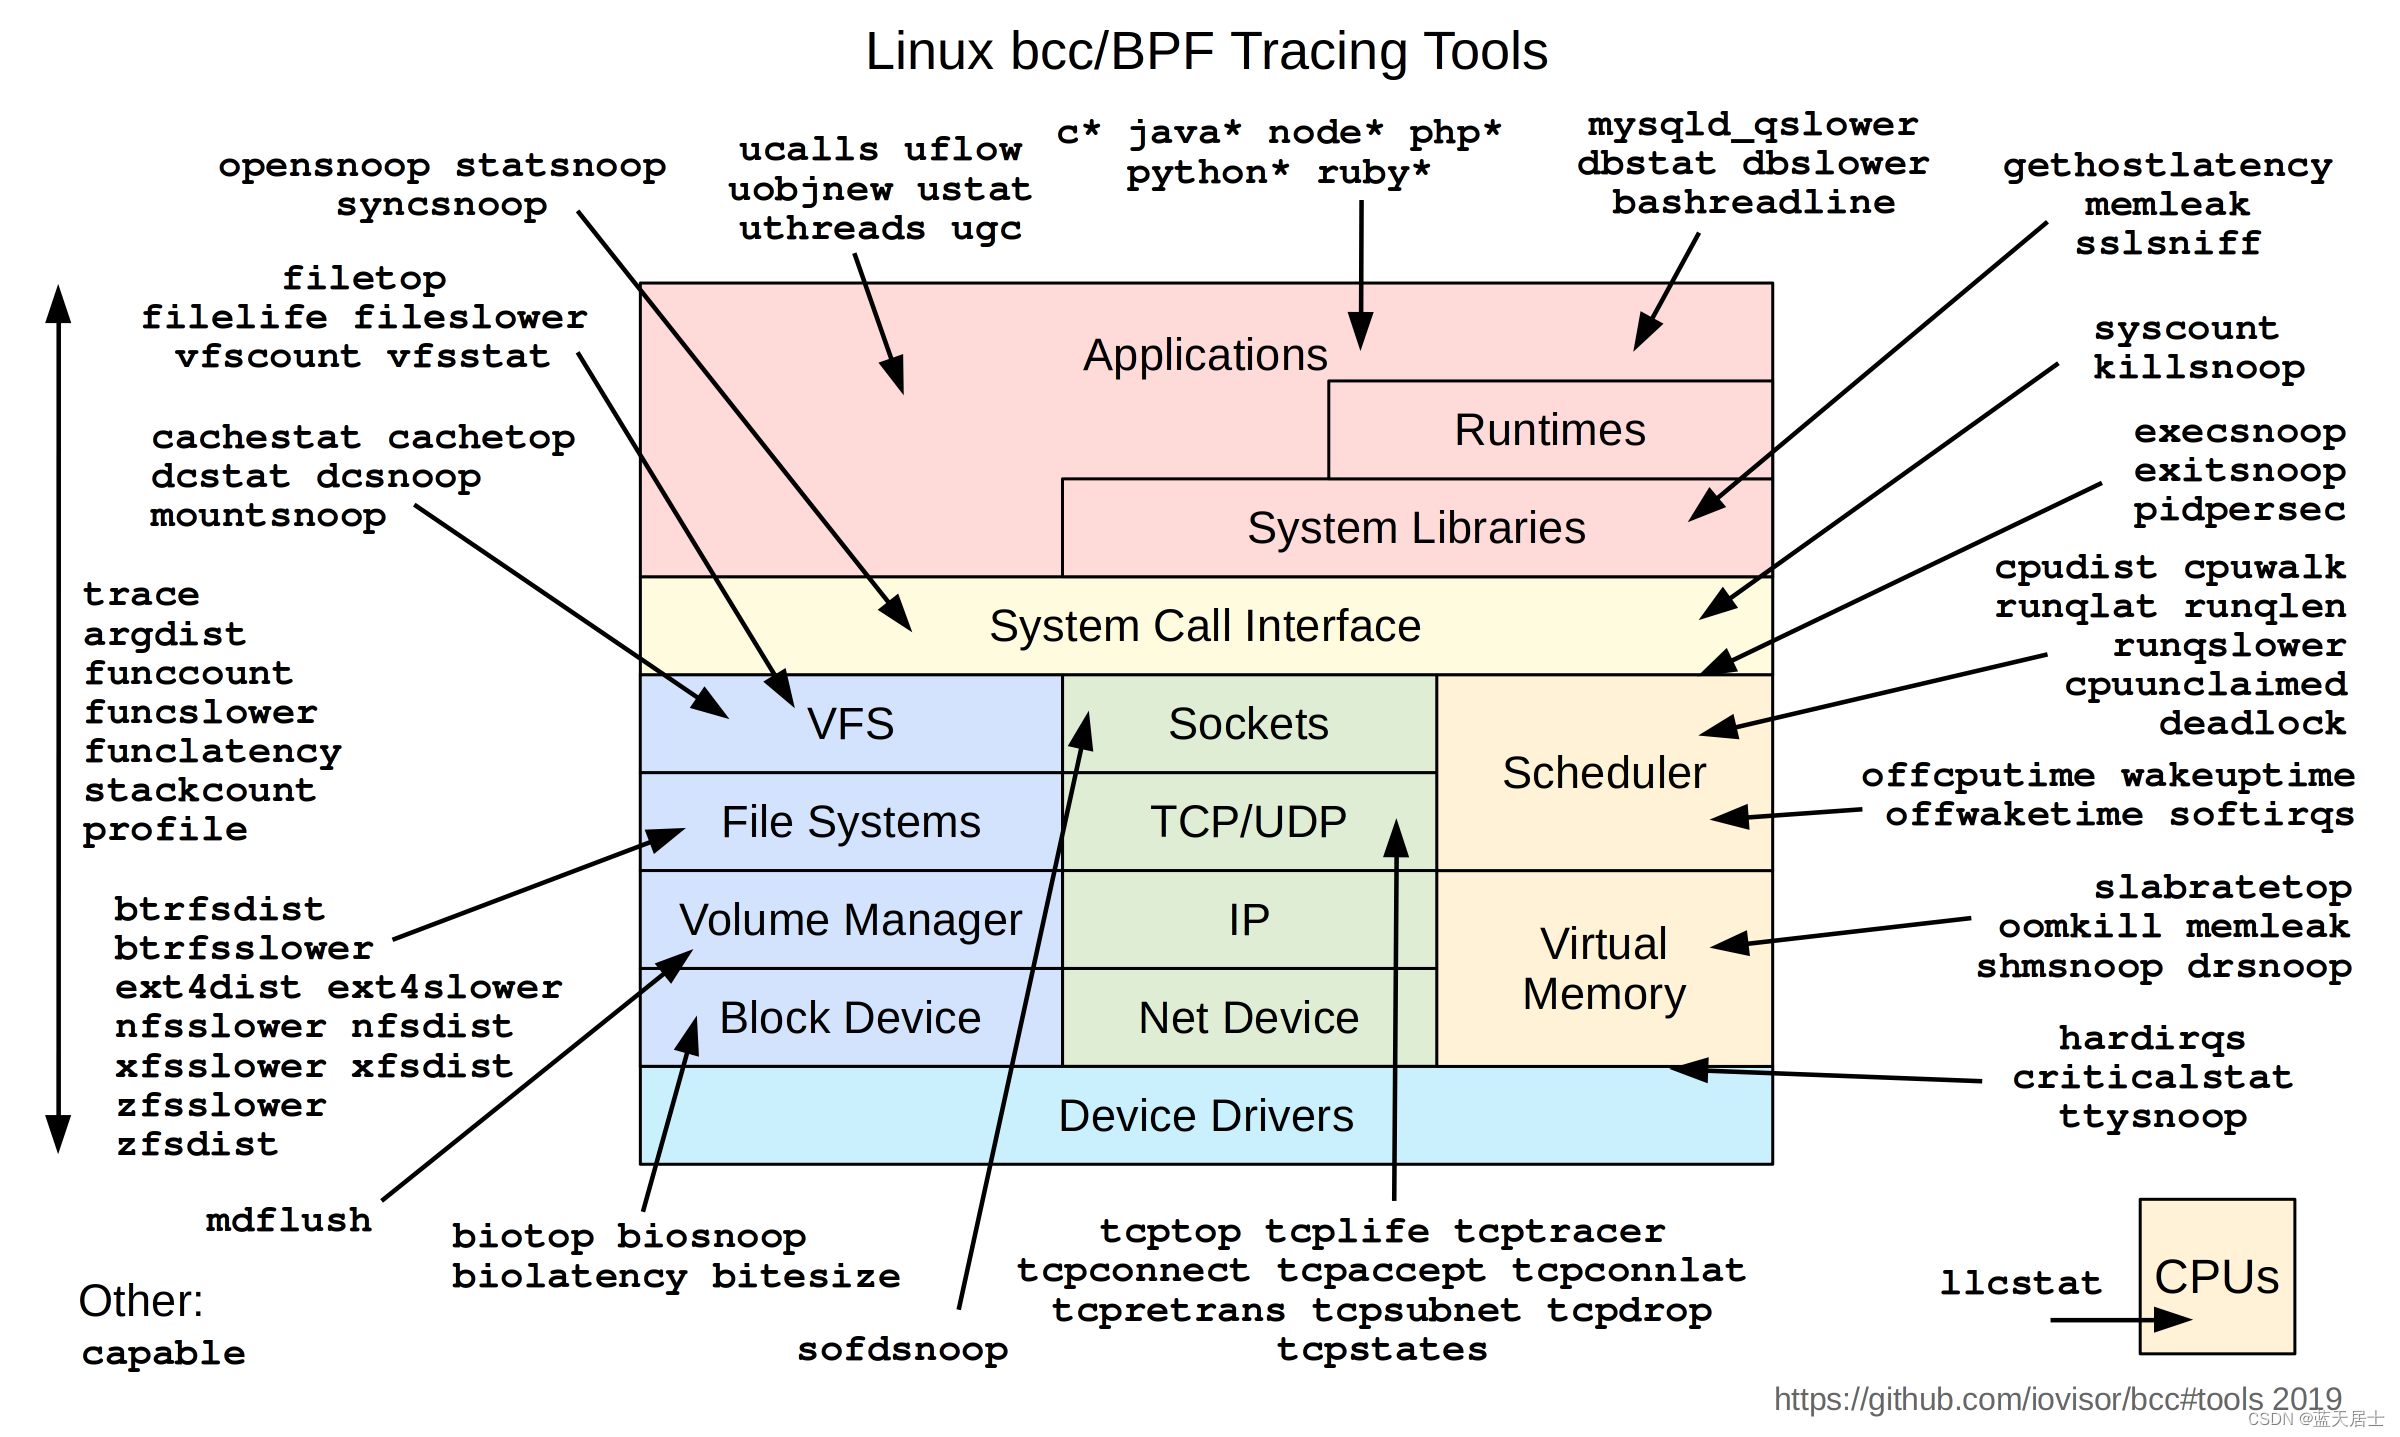
tools目录下的文件:
- tools/argdist
将函数参数值显示为直方图或频率计数。
bcc/tools/argdist_example.txt文件内容如下:
Demonstrations of argdist.
argdist probes functions you specify and collects parameter values into a
histogram or a frequency count. This can be used to understand the distribution
of values a certain parameter takes, filter and print interesting parameters
without attaching a debugger, and obtain general execution statistics on
various functions.
For example, suppose you want to find what allocation sizes are common in
your application:
# ./argdist -p 2420 -c -C 'p:c:malloc(size_t size):size_t:size'
[01:42:29]
p:c:malloc(size_t size):size_t:size
COUNT EVENT
[01:42:30]
p:c:malloc(size_t size):size_t:size
COUNT EVENT
[01:42:31]
p:c:malloc(size_t size):size_t:size
COUNT EVENT
1 size = 16
[01:42:32]
p:c:malloc(size_t size):size_t:size
COUNT EVENT
2 size = 16
[01:42:33]
p:c:malloc(size_t size):size_t:size
COUNT EVENT
3 size = 16
[01:42:34]
p:c:malloc(size_t size):size_t:size
COUNT EVENT
4 size = 16
^C
It seems that the application is allocating blocks of size 16. The COUNT
column contains the number of occurrences of a particular event, and the
EVENT column describes the event. In this case, the "size" parameter was
probed and its value was 16, repeatedly.
Now, suppose you wanted a histogram of buffer sizes passed to the write()
function across the system:
# ./argdist -c -H 'p:c:write(int fd, void *buf, size_t len):size_t:len'
[01:45:22]
p:c:write(int fd, void *buf, size_t len):size_t:len
len : count distribution
0 -> 1 : 0 | |
2 -> 3 : 2 |************* |
4 -> 7 : 0 | |
8 -> 15 : 2 |************* |
16 -> 31 : 0 | |
32 -> 63 : 6 |****************************************|
[01:45:23]
p:c:write(int fd, void *buf, size_t len):size_t:len
len : count distribution
0 -> 1 : 0 | |
2 -> 3 : 11 |*************** |
4 -> 7 : 0 | |
8 -> 15 : 4 |***** |
16 -> 31 : 0 | |
32 -> 63 : 28 |****************************************|
64 -> 127 : 12 |***************** |
[01:45:24]
p:c:write(int fd, void *buf, size_t len):size_t:len
len : count distribution
0 -> 1 : 0 | |
2 -> 3 : 21 |**************** |
4 -> 7 : 0 | |
8 -> 15 : 6 |**** |
16 -> 31 : 0 | |
32 -> 63 : 52 |****************************************|
64 -> 127 : 26 |******************** |
^C
It seems that most writes fall into three buckets: very small writes of 2-3
bytes, medium writes of 32-63 bytes, and larger writes of 64-127 bytes.
But these are writes across the board -- what if you wanted to focus on writes
to STDOUT?
# ./argdist -c -H 'p:c:write(int fd, void *buf, size_t len):size_t:len:fd==1'
[01:47:17]
p:c:write(int fd, void *buf, size_t len):size_t:len:fd==1
len : count distribution
0 -> 1 : 0 | |
2 -> 3 : 0 | |
4 -> 7 : 0 | |
8 -> 15 : 1 |****************************************|
16 -> 31 : 0 | |
32 -> 63 : 1 |****************************************|
[01:47:18]
p:c:write(int fd, void *buf, size_t len):size_t:len:fd==1
len : count distribution
0 -> 1 : 0 | |
2 -> 3 : 0 | |
4 -> 7 : 0 | |
8 -> 15 : 2 |************* |
16 -> 31 : 0 | |
32 -> 63 : 3 |******************** |
64 -> 127 : 6 |****************************************|
[01:47:19]
p:c:write(int fd, void *buf, size_t len):size_t:len:fd==1
len : count distribution
0 -> 1 : 0 | |
2 -> 3 : 0 | |
4 -> 7 : 0 | |
8 -> 15 : 3 |********* |
16 -> 31 : 0 | |
32 -> 63 : 5 |*************** |
64 -> 127 : 13 |****************************************|
^C
The "fd==1" part is a filter that is applied to every invocation of write().
Only if the filter condition is true, the value is recorded.
You can also use argdist to trace kernel functions. For example, suppose you
wanted a histogram of kernel allocation (kmalloc) sizes across the system,
printed twice with 3 second intervals:
# ./argdist -i 3 -n 2 -H 'p::__kmalloc(size_t size):size_t:size'
[01:50:00]
p::__kmalloc(size_t size):size_t:size
size : count distribution
0 -> 1 : 0 | |
2 -> 3 : 0 | |
4 -> 7 : 0 | |
8 -> 15 : 6 |****************************************|
[01:50:03]
p::__kmalloc(size_t size):size_t:size
size : count distribution
0 -> 1 : 0 | |
2 -> 3 : 0 | |
4 -> 7 : 0 | |
8 -> 15 : 22 |****************************************|
16 -> 31 : 0 | |
32 -> 63 : 0 | |
64 -> 127 : 5 |********* |
128 -> 255 : 2 |*** |
Occasionally, numeric information isn't enough and you want to capture strings.
What are the strings printed by puts() across the system?
# ./argdist -i 10 -n 1 -C 'p:c:puts(char *str):char*:str'
[01:53:54]
p:c:puts(char *str):char*:str
COUNT EVENT
2 str = Press ENTER to start.
It looks like the message "Press ENTER to start." was printed twice during the
10 seconds we were tracing.
What about reads? You could trace gets() across the system and print the
strings input by the user (note how "r" is used instead of "p" to attach a
probe to the function's return):
# ./argdist -i 10 -n 1 -C 'r:c:gets():char*:(char*)$retval:$retval!=0'
[02:12:23]
r:c:gets():char*:$retval:$retval!=0
COUNT EVENT
1 (char*)$retval = hi there
3 (char*)$retval = sasha
8 (char*)$retval = hello
Similarly, we could get a histogram of the error codes returned by read():
# ./argdist -i 10 -c 1 -H 'r:c:read()'
[02:15:36]
r:c:read()
retval : count distribution
0 -> 1 : 29 |****************************************|
2 -> 3 : 11 |*************** |
4 -> 7 : 0 | |
8 -> 15 : 3 |**** |
16 -> 31 : 2 |** |
32 -> 63 : 22 |****************************** |
64 -> 127 : 5 |****** |
128 -> 255 : 0 | |
256 -> 511 : 1 |* |
512 -> 1023 : 1 |* |
1024 -> 2047 : 0 | |
2048 -> 4095 : 2 |** |
In return probes, you can also trace the latency of the function (unless it is
recursive) and the parameters it had on entry. For example, we can identify
which processes are performing slow synchronous filesystem reads -- say,
longer than 0.1ms (100,000ns):
# ./argdist -C 'r::__vfs_read():u32:$PID:$latency > 100000'
[01:08:48]
r::__vfs_read():u32:$PID:$latency > 100000
COUNT EVENT
1 $PID = 10457
21 $PID = 2780
[01:08:49]
r::__vfs_read():u32:$PID:$latency > 100000
COUNT EVENT
1 $PID = 10457
21 $PID = 2780
^C
It looks like process 2780 performed 21 slow reads.
You can print the name of the process. This is helpful for short lived processes
and for easier identification of processes response. For example, we can identify
the process using the epoll I/O multiplexing system call
# ./argdist -C 't:syscalls:sys_exit_epoll_wait():char*:$COMM'
[19:57:56]
t:syscalls:sys_exit_epoll_wait():char*:$COMM
COUNT EVENT
4 $COMM = b'node'
[19:57:57]
t:syscalls:sys_exit_epoll_wait():char*:$COMM
COUNT EVENT
2 $COMM = b'open5gs-sgwud'
3 $COMM = b'open5gs-sgwcd'
3 $COMM = b'open5gs-nrfd'
3 $COMM = b'open5gs-udmd'
4 $COMM = b'open5gs-scpd'
Occasionally, entry parameter values are also interesting. For example, you
might be curious how long it takes malloc() to allocate memory -- nanoseconds
per byte allocated. Let's go:
# ./argdist -H 'r:c:malloc(size_t size):u64:$latency/$entry(size);ns per byte' -n 1 -i 10
[01:11:13]
ns per byte : count distribution
0 -> 1 : 0 | |
2 -> 3 : 4 |***************** |
4 -> 7 : 3 |************* |
8 -> 15 : 2 |******** |
16 -> 31 : 1 |**** |
32 -> 63 : 0 | |
64 -> 127 : 7 |******************************* |
128 -> 255 : 1 |**** |
256 -> 511 : 0 | |
512 -> 1023 : 1 |**** |
1024 -> 2047 : 1 |**** |
2048 -> 4095 : 9 |****************************************|
4096 -> 8191 : 1 |**** |
It looks like a tri-modal distribution. Some allocations are extremely cheap,
and take 2-15 nanoseconds per byte. Other allocations are slower, and take
64-127 nanoseconds per byte. And some allocations are slower still, and take
multiple microseconds per byte.
You could also group results by more than one field. For example, __kmalloc
takes an additional flags parameter that describes how to allocate memory:
# ./argdist -c -C 'p::__kmalloc(size_t size, gfp_t flags):gfp_t,size_t:flags,size'
[03:42:29]
p::__kmalloc(size_t size, gfp_t flags):gfp_t,size_t:flags,size
COUNT EVENT
1 flags = 16, size = 152
2 flags = 131280, size = 8
7 flags = 131280, size = 16
[03:42:30]
p::__kmalloc(size_t size, gfp_t flags):gfp_t,size_t:flags,size
COUNT EVENT
1 flags = 16, size = 152
6 flags = 131280, size = 8
19 flags = 131280, size = 16
[03:42:31]
p::__kmalloc(size_t size, gfp_t flags):gfp_t,size_t:flags,size
COUNT EVENT
2 flags = 16, size = 152
10 flags = 131280, size = 8
31 flags = 131280, size = 16
[03:42:32]
p::__kmalloc(size_t size, gfp_t flags):gfp_t,size_t:flags,size
COUNT EVENT
2 flags = 16, size = 152
14 flags = 131280, size = 8
43 flags = 131280, size = 16
^C
The flags value must be expanded by hand, but it's still helpful to eliminate
certain kinds of allocations or visually group them together.
argdist also has basic support for kernel tracepoints. It is sometimes more
convenient to use tracepoints because they are documented and don't vary a lot
between kernel versions. For example, let's trace the net:net_dev_start_xmit
tracepoint and print out the protocol field from the tracepoint structure:
# argdist -C 't:net:net_dev_start_xmit():u16:args->protocol'
[13:01:49]
t:net:net_dev_start_xmit():u16:args->protocol
COUNT EVENT
8 args->protocol = 2048
^C
Note that to discover the format of the net:net_dev_start_xmit tracepoint, you
use the tplist tool (tplist -v net:net_dev_start_xmit).
Occasionally, it is useful to filter certain expressions by string. This is not
trivially supported by BPF, but argdist provides a STRCMP helper you can use in
filter expressions. For example, to get a histogram of latencies opening a
specific file, run this:
# argdist -c -H 'r:c:open(char *file):u64:$latency/1000:STRCMP("test.txt",$entry(file))'
[02:16:38]
[02:16:39]
[02:16:40]
$latency/1000 : count distribution
0 -> 1 : 0 | |
2 -> 3 : 0 | |
4 -> 7 : 0 | |
8 -> 15 : 0 | |
16 -> 31 : 2 |****************************************|
[02:16:41]
$latency/1000 : count distribution
0 -> 1 : 0 | |
2 -> 3 : 0 | |
4 -> 7 : 0 | |
8 -> 15 : 1 |********** |
16 -> 31 : 4 |****************************************|
[02:16:42]
$latency/1000 : count distribution
0 -> 1 : 0 | |
2 -> 3 : 0 | |
4 -> 7 : 0 | |
8 -> 15 : 1 |******** |
16 -> 31 : 5 |****************************************|
[02:16:43]
$latency/1000 : count distribution
0 -> 1 : 0 | |
2 -> 3 : 0 | |
4 -> 7 : 0 | |
8 -> 15 : 1 |******** |
16 -> 31 : 5 |****************************************|
Here's a final example that finds how many write() system calls are performed
by each process on the system:
# argdist -c -C 'p:c:write():int:$PID;write per process' -n 2
[06:47:18]
write by process
COUNT EVENT
3 $PID = 8889
7 $PID = 7615
7 $PID = 2480
[06:47:19]
write by process
COUNT EVENT
9 $PID = 8889
23 $PID = 7615
23 $PID = 2480
USAGE message:
# argdist -h
usage: argdist [-h] [-p PID] [-z STRING_SIZE] [-i INTERVAL] [-n COUNT] [-v]
[-c] [-T TOP] [-H specifier] [-C[specifier] [-I header]
Trace a function and display a summary of its parameter values.
optional arguments:
-h, --help show this help message and exit
-p PID, --pid PID id of the process to trace (optional)
-t TID, --tid TID id of the thread to trace (optional)
-z STRING_SIZE, --string-size STRING_SIZE
maximum string size to read from char* arguments
-i INTERVAL, --interval INTERVAL
output interval, in seconds (default 1 second)
-d DURATION, --duration DURATION
total duration of trace, in seconds
-n COUNT, --number COUNT
number of outputs
-v, --verbose print resulting BPF program code before executing
-c, --cumulative do not clear histograms and freq counts at each interval
-T TOP, --top TOP number of top results to show (not applicable to
histograms)
-H specifier, --histogram specifier
probe specifier to capture histogram of (see examples
below)
-C specifier, --count specifier
probe specifier to capture count of (see examples
below)
-I header, --include header
additional header files to include in the BPF program
as either full path, or relative to current working directory,
or relative to default kernel header search path
Probe specifier syntax:
{p,r,t,u}:{[library],category}:function(signature)[:type[,type...]:expr[,expr...][:filter]][#label]
Where:
p,r,t,u -- probe at function entry, function exit, kernel tracepoint,
or USDT probe
in exit probes: can use $retval, $entry(param), $latency
library -- the library that contains the function
(leave empty for kernel functions)
category -- the category of the kernel tracepoint (e.g. net, sched)
signature -- the function's parameters, as in the C header
type -- the type of the expression to collect (supports multiple)
expr -- the expression to collect (supports multiple)
filter -- the filter that is applied to collected values
label -- the label for this probe in the resulting output
EXAMPLES:
argdist -H 'p::__kmalloc(u64 size):u64:size'
Print a histogram of allocation sizes passed to kmalloc
argdist -p 1005 -C 'p:c:malloc(size_t size):size_t:size:size==16'
Print a frequency count of how many times process 1005 called malloc
with an allocation size of 16 bytes
argdist -C 'r:c:gets():char*:$retval#snooped strings'
Snoop on all strings returned by gets()
argdist -H 'r::__kmalloc(size_t size):u64:$latency/$entry(size)#ns per byte'
Print a histogram of nanoseconds per byte from kmalloc allocations
argdist -C 'p::__kmalloc(size_t size, gfp_t flags):size_t:size:flags&GFP_ATOMIC'
Print frequency count of kmalloc allocation sizes that have GFP_ATOMIC
argdist -p 1005 -C 'p:c:write(int fd):int:fd' -T 5
Print frequency counts of how many times writes were issued to a
particular file descriptor number, in process 1005, but only show
the top 5 busiest fds
argdist -p 1005 -H 'r:c:read()'
Print a histogram of error codes returned by read() in process 1005
argdist -C 'r::__vfs_read():u32:$PID:$latency > 100000'
Print frequency of reads by process where the latency was >0.1ms
argdist -C 'r::__vfs_read():u32:$COMM:$latency > 100000'
Print frequency of reads by process name where the latency was >0.1ms
argdist -H 'r::__vfs_read(void *file, void *buf, size_t count):size_t:$entry(count):$latency > 1000000'
Print a histogram of read sizes that were longer than 1ms
argdist -H \
'p:c:write(int fd, const void *buf, size_t count):size_t:count:fd==1'
Print a histogram of buffer sizes passed to write() across all
processes, where the file descriptor was 1 (STDOUT)
argdist -C 'p:c:fork()#fork calls'
Count fork() calls in libc across all processes
Can also use funccount.py, which is easier and more flexible
argdist -H 't:block:block_rq_complete():u32:args->nr_sector'
Print histogram of number of sectors in completing block I/O requests
argdist -C 't:irq:irq_handler_entry():int:args->irq'
Aggregate interrupts by interrupt request (IRQ)
argdist -C 'u:pthread:pthread_start():u64:arg2' -p 1337
Print frequency of function addresses used as a pthread start function,
relying on the USDT pthread_start probe in process 1337
argdist -H 'p:c:sleep(u32 seconds):u32:seconds' \
-H 'p:c:nanosleep(struct timespec *req):long:req->tv_nsec'
Print histograms of sleep() and nanosleep() parameter values
argdist -p 2780 -z 120 \
-C 'p:c:write(int fd, char* buf, size_t len):char*:buf:fd==1'
Spy on writes to STDOUT performed by process 2780, up to a string size
of 120 characters
argdist -I 'kernel/sched/sched.h' \
-C 'p::__account_cfs_rq_runtime(struct cfs_rq *cfs_rq):s64:cfs_rq->runtime_remaining'
Trace on the cfs scheduling runqueue remaining runtime. The struct cfs_rq is defined
in kernel/sched/sched.h which is in kernel source tree and not in kernel-devel
package. So this command needs to run at the kernel source tree root directory
so that the added header file can be found by the compiler.
argdist -C 'p::do_sys_open(int dfd, const char __user *filename, int flags,
umode_t mode):char*:filename:STRCMP("sample.txt", filename)'
Trace open of the file "sample.txt". It should be noted that 'filename'
passed to the do_sys_open is a char * user pointer. Hence parameter
'filename' should be tagged with __user for kprobes (const char __user
*filename). This information distinguishes if the 'filename' should be
copied from userspace to the bpf stack or from kernel space to the bpf
stack.在笔者电脑上实际运行结果如下:
~/eBPF/BCC/bcc/tools$ sudo ./argdist.py -c -H 'p:c:write(int fd, void *buf, size_t len):size_t:len:fd==1'
[10:23:54]
     len                 : count     distribution
         0 -> 1          : 0        |                                        |
         2 -> 3          : 0        |                                        |
         4 -> 7          : 0        |                                        |
         8 -> 15         : 1        |****************************************|
[10:23:55]
     len                 : count     distribution
         0 -> 1          : 0        |                                        |
         2 -> 3          : 0        |                                        |
         4 -> 7          : 0        |                                        |
         8 -> 15         : 2        |********************                    |
        16 -> 31         : 0        |                                        |
        32 -> 63         : 1        |**********                              |
        64 -> 127        : 4        |****************************************|
[10:23:56]
     len                 : count     distribution
         0 -> 1          : 0        |                                        |
         2 -> 3          : 0        |                                        |
         4 -> 7          : 0        |                                        |
         8 -> 15         : 3        |**********                              |
        16 -> 31         : 0        |                                        |
        32 -> 63         : 2        |*******                                 |
        64 -> 127        : 11       |****************************************|
[10:23:57]
     len                 : count     distribution
         0 -> 1          : 0        |                                        |
         2 -> 3          : 0        |                                        |
         4 -> 7          : 0        |                                        |
         8 -> 15         : 4        |********                                |
        16 -> 31         : 0        |                                        |
        32 -> 63         : 3        |******                                  |
        64 -> 127        : 19       |****************************************|
       128 -> 255        : 0        |                                        |
       256 -> 511        : 1        |**                                      |
       512 -> 1023       : 0        |                                        |
      1024 -> 2047       : 0        |                                        |
      2048 -> 4095       : 0        |                                        |
      4096 -> 8191       : 8        |****************                        |
- tools/bashreadline
打印系统范围内输入的bash命令。
bcc/tools/bashreadline.txt文件内容如下:
Demonstrations of bashreadline, the Linux eBPF/bcc version.


This prints bash commands from all running bash shells on the system. For
example:

# ./bashreadline
TIME      PID    COMMAND
05:28:25  21176  ls -l
05:28:28  21176  date
05:28:35  21176  echo hello world
05:28:43  21176  foo this command failed
05:28:45  21176  df -h
05:29:04  3059   echo another shell
05:29:13  21176  echo first shell again

When running the script on Arch Linux, you may need to specify the location
of libreadline.so library:

# ./bashreadline -s /lib/libreadline.so
TIME      PID    COMMAND
11:17:34  28796  whoami
11:17:41  28796  ps -ef
11:17:51  28796  echo "Hello eBPF!"


The entered command may fail. This is just showing what command lines were
entered interactively for bash to process.

It works by tracing the return of the readline() function using uprobes
(specifically a uretprobe).
但是在笔者电脑上实际运行,结果如下:
~/eBPF/BCC/bcc/tools$ sudo ./bashreadline.py
[sudo] penghao 的密码:Traceback (most recent call last):
  File "/home/penghao/eBPF/BCC/bcc/tools/./bashreadline.py", line 66, in <module>
    b.attach_uretprobe(name=name, sym="readline", fn_name="printret")
  File "/usr/lib/python3.11/site-packages/bcc/__init__.py", line 1412, in attach_uretprobe
    (path, addr) = BPF._check_path_symbol(name, sym, addr, pid)
                   ^^^^^^^^^^^^^^^^^^^^^^^^^^^^^^^^^^^^^^^^^^^^
  File "/usr/lib/python3.11/site-packages/bcc/__init__.py", line 978, in _check_path_symbol
    raise Exception("could not determine address of symbol %s in %s"
Exception: could not determine address of symbol readline in /bin/bash


