本篇博客背景为JavaScript。在ECharts在线编码快速上手,绘制相关前端可视化图表。
ECharts官网:https://echarts.apache.org/zh/index.html
其他的一些推荐:
AntV:https://antv.vision/zh
chartcube:https://chartcube.alipay.com/make
文章目录
- 1、饼图
- 1.1 常规饼图
- 1.2 多层级饼图/双层饼图
- 2、柱状图
- 2.1柱状堆叠图
- 3、趋势图
- 3.1 凹凸图
- 3.2 折线图
- 4、组合图
1、饼图
1.1 常规饼图
饼图,可以显示数据内容的分类及占比。
可自定义分类的备注内容(使用名称+值+百分比)。可自定义分类颜色。

代码示例如下:
option = {
  title: {
    //图表标题填写位置
    text: '图表标题',
    //图表副标题填写位置
    subtext: '副标题',
    //图表标题位置;center表示居中
    left: 'center'
  },
  tooltip: {
    trigger: 'item'
  },
  legend: {
    orient: 'vertical',
    left: 'left'
  },
  series: [
    {
      type: 'pie',
      //调整图表在页面相对大小
      radius: '60%',
       label: {
                        normal: {
                            show: true,
                            //自定义色块备注,名称+值+百分比
                            formatter: '{b}:{c}' + '个\n\r' + '({d}%)'
                        }
                    },
      data: [
        { value: 8, name: 'A' },
        { value: 6, name: 'B' },
        { value: 3, name: 'C' },
        { value: 2, name: 'D' },
        { value: 7, name: 'E' },
        { value: 1, name: 'F' },
        { value: 1, name: 'G' },
        { value: 1, name: 'H' },
        { value: 5, name: 'I' },
        //数量较多会循环使用之前的颜色,所以加上,itemStyle:{color来自定义颜色
        { value: 13, name: 'J' ,itemStyle:{color:'#FF7F80'}},
        { value: 10, name: 'K' ,itemStyle:{color:'#A52A4A'}}
      ],
      emphasis: {
        itemStyle: {
          shadowBlur: 10,
          shadowOffsetX: 0,
          shadowColor: 'rgba(0, 0, 0, 0.5)'
        }
      }
    }
  ]
};
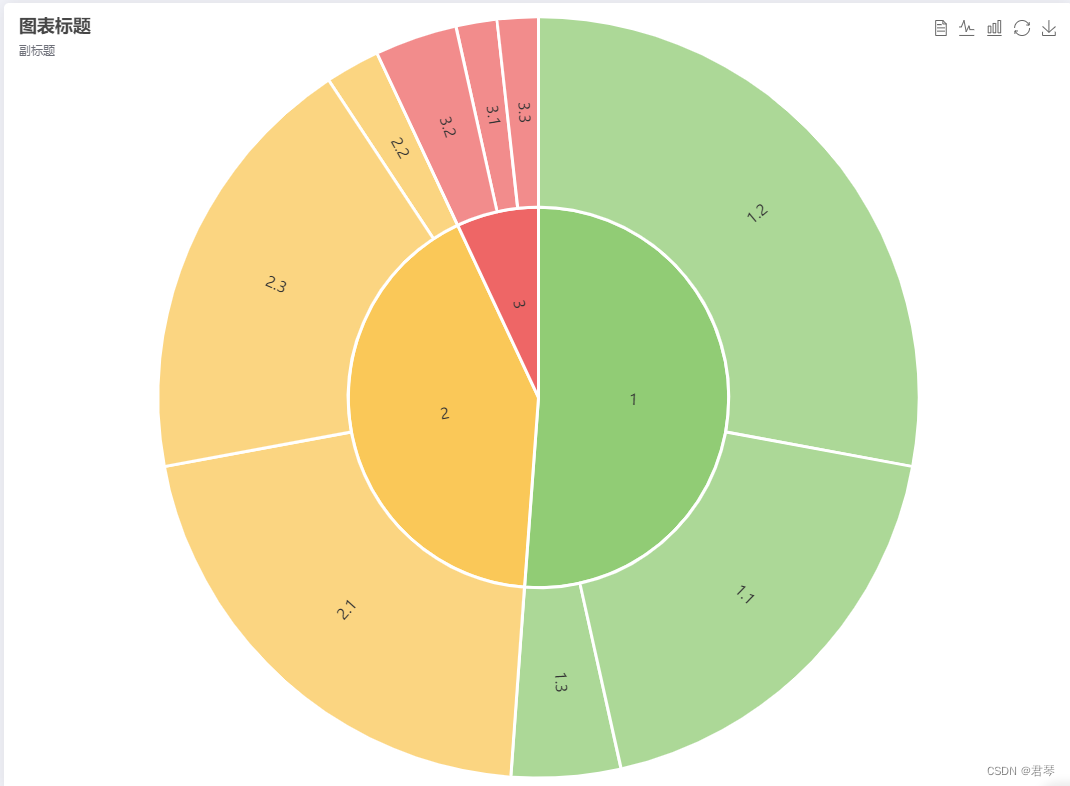
1.2 多层级饼图/双层饼图
多层级饼图,可展示数据分类及其下钻数据内容分类和关联性。
能够直观从几个层次展示,第一维度横向比较,第二维度横向比较,第二维度基于第一维度的横向比较,第二维度基于第一维度的延伸展示。
可自定义数据内容的分类及相应占比值,也可以自定义第二维度的数据分类及占比。
代码示例如下:
option = {
  textStyle: {
      color: '#999',
      fontWeight: 'normal',
      //调整图表中字体大小
      fontSize: 15
    },
    toolbox: {
    feature: {
      dataView: { show: true, readOnly: false },
      magicType: { show: true, type: ['line', 'bar'] },
      restore: { show: true },
      saveAsImage: { show: true }
    }
  },
  title: {
    //图表标题填写位置
    text: '图表标题',
    //图表副标题填写位置
    subtext: '副标题',
    //图表标题位置;left表示左靠齐
    left: 'left'
  },
  legend: {
    orient: 'vertical',
    left: 'left'
  },
            series: {
               itemStyle: {
        borderColor: '#fff',
        borderWidth: 3
      },
                type: 'sunburst',
                //调整图表在页面相对大小
                 radius: '99%',
                 //调整图表在页面整体位置
                  center: ['50%', '50%'],
                  //图表数据,一个对象为一个色块
                data: [{
                  //第1部分的色块名
                    name: '1',
                    //第1部分的的值,对应占比大小
                    value: 2.2,
                    children: [{
                      //第1部分外圈的名称
                        name: '1.2',
                        //第1部分外圈的值,对应其在该色块中占比大小
                        value: 1.2
                    },
                    {
                        name: '1.3',
                        value: 0.2
                    },
                    {
                        name: '1.1',
                        value: 0.8
                    }]
                }, {
                    name: '2',
					          value:1.8,
					          children: [{
                        name: '2.1',
                        value: 0.9
                    },
                    {
                        name: '2.2',
                        value: 0.1
                    },
                    {
                        name: '2.3',
                        value: 0.8
                    }]
                },
                {
                    name: '3',
                    value: 0.3,
                    children: [{
                        name: '3.1',
                        value: 0.075
                    },
                    {
                        name: '3.2',
                        value: 0.15
                    },
                    {
                        name: '3.3',
                        value: 0.075
                    }
                    ]
                },
                ]
            }
        };
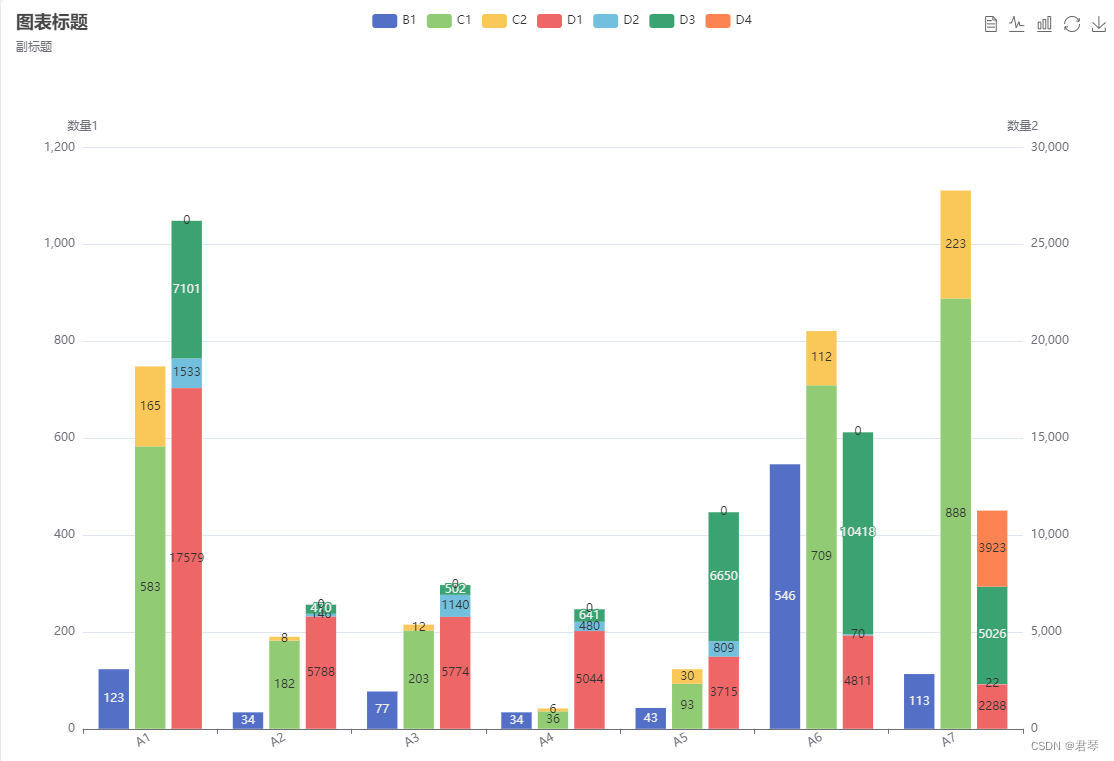
2、柱状图
2.1柱状堆叠图
柱状图与数据堆叠柱状图,可直观展示数据分类及该批次下数据细致划分及占比。
可自定义堆叠类型,自定义数据分类及占比等。双y轴图。
代码示例如下:
const Colors = {
  'United States': '#b22234'
};
option = {
  title: {
    //图表标题填写位置
    text: '图表标题',
    //图表副标题填写位置
    subtext: '副标题',
    //图表标题位置;left表示左靠齐
    left: 'left'
  },
  tooltip: {
    trigger: 'axis',
    axisPointer: {
      type: 'shadow'
    }
  },
  toolbox: {
    feature: {
      dataView: { show: true, readOnly: false },
      magicType: { show: true, type: ['line', 'bar'] },
      restore: { show: true },
      saveAsImage: { show: true }
    }
  },
  legend: {},
  grid: {
    //整个图表距离页面最左侧的相对距离
    left: '3%',
    right: '4%',
    //整个图表距离页面顶部的相对距离
    top:'18%',
    bottom: '3%',
    containLabel: true
  },
  //横坐标
  xAxis: [
    {
      type: 'category',
      //横坐标名称
      data: ['A1', 'A2','A3','A4','A5','A6','A7',
    ],
    axisLabel: {
      interval: 0,
      //横坐标倾斜程度
      rotate: 30
    }
    }
  ],
  //纵坐标,这儿是双纵坐标
  yAxis: [
    {
      type: 'value',
      //纵坐标名称
      name: '数量1',
    },
    {
      type: 'value',
      name: '数量2',
      //纵坐标最小值
      //min: 0,
      //纵坐标最大值
      //max: 10000,
      //纵坐标数据间隔
      //interval: 800,
    }
  ],
  series: [
    {
      //数据分类名称
      name: 'B1',
      type: 'bar',
      //color: '#76be77',
      emphasis: {
        focus: 'series'
      },
      label: {
        //柱状图上展示具体数值
        show: true
      },
      data:[123,34,77,34,43,546,113]
    },
    {
      name: 'C1',
      type: 'bar',
      //柱状图数据堆叠效果
      stack: 'Ad',
      //color: '#a90000',
      emphasis: {
        focus: 'series'
      },
      label: {
        show: true
      },
      data:[583,182,203,36,93,709,888]
    },
    {
      name: 'C2',
      stack: 'Ad',
      type: 'bar',
      emphasis: {
        focus: 'series'
      },
      label: {
        show: true
      },
      data:[165,8,12,6,30,112,223]
    },
    {
      name: 'D1',
      yAxisIndex: 1,
      type: 'bar',
      //数据堆叠在不同柱子,根据stack的名称区分
      stack: 'Ad2',
      //color: '#a90000',
      emphasis: {
        focus: 'series'
      },
      label: {
        show: true
      },
      data:[17579,5788,5774,5044,3715,4811,2288]
    },
    {
      name: 'D2',
      yAxisIndex: 1,
      stack: 'Ad2',
      type: 'bar',
      emphasis: {
        focus: 'series'
      },
      label: {
        show: true
      },
      data:[1533,146,1140,480,809,70,22]
    },
    {
      name: 'D3',
      yAxisIndex: 1,
      stack: 'Ad2',
      type: 'bar',
      emphasis: {
        focus: 'series'
      },
      label: {
        show: true
      },
      data:[7101,470,502,641,6650,10418,5026]
    },
    {
      name: 'D4',
      yAxisIndex: 1,
      stack: 'Ad2',
      type: 'bar',
      emphasis: {
        focus: 'series'
      },
      label: {
        show: true
      },
      data:[0,0,0,0,0,0,3923]
    }
  ]
};
3、趋势图
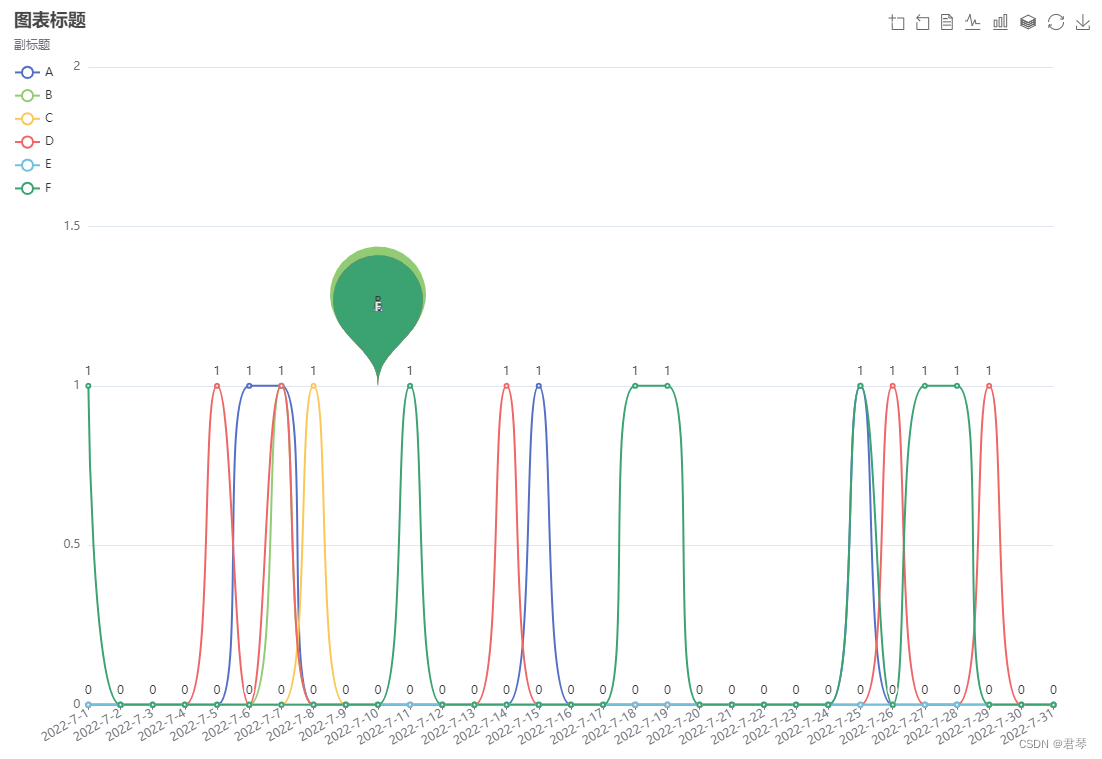
3.1 凹凸图
可展示对应数据长期情况,趋势及最大最小值。
可自定义数据分类及备注点内容和坐标点位置等。
代码示例如下:
option = {
  title: {
    //图表标题填写位置
    text: '图表标题',
    //图表副标题填写位置
    subtext: '副标题',
  },
  tooltip: {
    trigger: 'axis'
  },
  legend: {
    data: ['A', 'B', 'C', 'D', 'E','F'
    ],
    orient: 'vertical',
    left: 'left',
    top:'7%',
  },
   toolbox: {
    show: true,
    feature: {
      dataZoom: {
        yAxisIndex: 'none'
      },
      dataView: { readOnly: false },
      magicType: { type: ['line', 'bar','stack'] },
      restore: {},
      saveAsImage: {}
    }
  },
  grid: {
    //整个图表距离页面最左侧的相对距离
    left: '5%',
    right: '4%',
    //整个图表距离页面底部的相对距离
    bottom: '3%',
    containLabel: true
  },
  //横坐标
  xAxis: {
    type: 'category',
    boundaryGap: false,
    //横坐标的名称
    data: ['2022-7-1', '2022-7-2', '2022-7-3', '2022-7-4', '2022-7-5', '2022-7-6', '2022-7-7',
    '2022-7-8','2022-7-9','2022-7-10','2022-7-11','2022-7-12','2022-7-13','2022-7-14',
    '2022-7-15','2022-7-16','2022-7-17','2022-7-18','2022-7-19','2022-7-20',
    '2022-7-21','2022-7-22','2022-7-23','2022-7-24','2022-7-25',
    '2022-7-26','2022-7-27','2022-7-28','2022-7-29','2022-7-30','2022-7-31'
    ],
    axisLabel: {
      interval: 0,
      //横坐标名称倾斜程度
      rotate: 30
    }
  },
  //纵坐标
  yAxis: {
    type: 'value',
    //纵坐标最小值
    min: 0,
    //纵坐标最大值
    max: 2,
  },
  series: [
    {
      name: 'A',
      smooth: true,
      //增加该曲线的备注点
      markPoint: {
        data: [
          //备注点的名称,展示内容,坐标点
          { name: 'markPoint', value: 'A', xAxis: 9, yAxis: 1,
          symbolSize:150,
          }
        ],
      },
      type: 'line',
      label: {
        show: true
      },
      //该曲线对应横坐标的具体数值
      data: [0,0,0,0,0,1,1,0,0,0,
      0,0,0,0,1,
      0,0,0,0,0,
      0,0,0,0,1,
      0,0,0,0,0,0
      ]
    },
    {
      name: 'B',
      smooth: true,
      markPoint: {
        data: [
          { name: 'markPoint', value: 'B', xAxis: 9, yAxis: 1,
          symbolSize:160,
          }
        ],
      },
      type: 'line',
      label: {
        show: true
      },
      data: [0,0,0,0,0,0,1,0,0,0,
      0,0,0,0,0,
      0,0,0,0,0,
      0,0,0,0,0,
      0,0,0,0,0,0
      ]
    },
    {
      name: 'C',
      smooth: true,
      markPoint: {
        data: [
          { name: 'markPoint', value: 'C', xAxis: 9, yAxis: 1,
          symbolSize:150,
          }
        ],
      },
      type: 'line',
      label: {
        show: true
      },
      data: [0,0,0,0,0,0,0,1,0,0,
      0,0,0,0,0,
      0,0,0,0,0,
      0,0,0,0,0,
      0,0,0,0,0,0
      ]
    },
    {
      name: 'D',
      smooth: true,
      markPoint: {
        data: [
          { name: 'markPoint', value: 'D', xAxis: 9, yAxis: 1,
          symbolSize:150,
          }
        ],
      },
      type: 'line',
      label: {
        show: true
      },
      data: [0,0,0,0,1,0,1,0,0,0,
      0,0,0,1,0,
      0,0,0,0,0,
      0,0,0,0,0,
      1,0,0,1,0,0
      ]
    },
    {
      name: 'E',
      smooth: true,
      type: 'line',
      label: {
        show: true
      },
      data: [0,0,0,0,0,0,0,0,0,0,
      0,0,0,0,0,
      0,0,0,0,0,
      0,0,0,0,0,
      0,0,0,0,0,0
      ]
    },
    {
      name: 'F',
      smooth: true,
      markPoint: {
        data: [
          { name: 'markPoint', value: 'F', xAxis: 9, yAxis: 1,
          symbolSize:150,
          }
        ],
      },
      type: 'line',
      label: {
        show: true
      },
      data: [1,0,0,0,0,0,0,0,0,0,
      1,0,0,0,0,
      0,0,1,1,0,
      0,0,0,0,1,
      0,1,1,0,0,0
      ]
    }
  ]
};
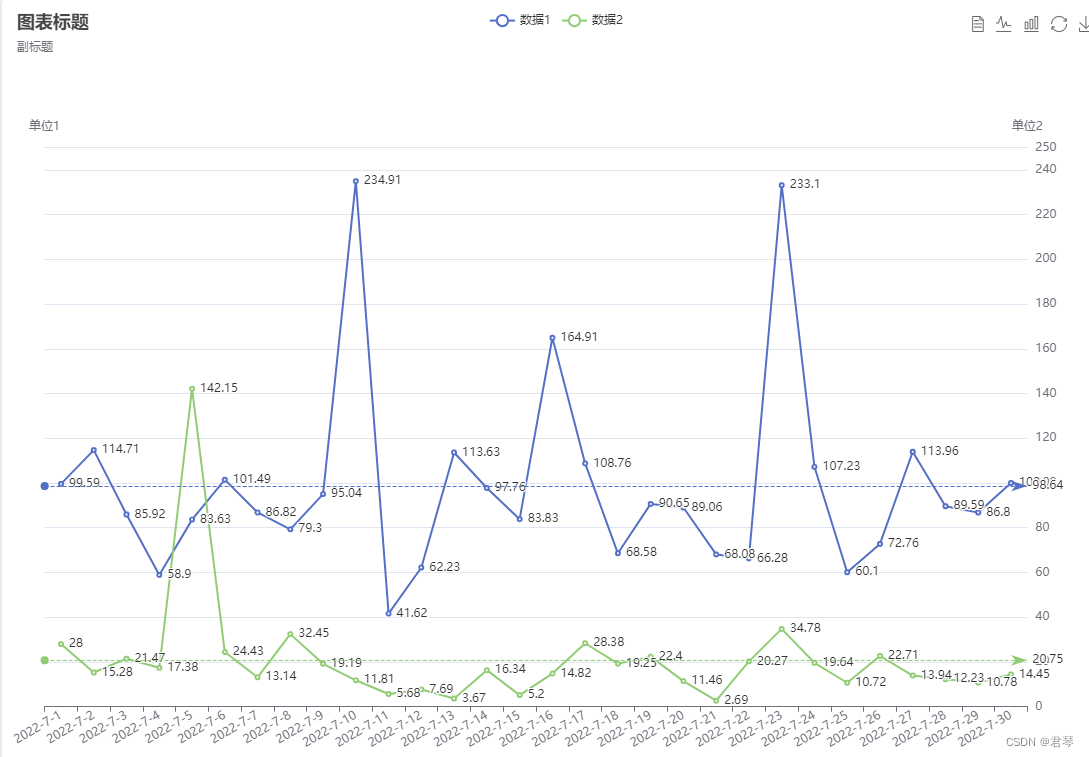
3.2 折线图
折线图,可较好展示数据波动及趋势,可快速看出最值。
可自定义数值及中线平均值。
代码示例如下:
const Colors = {
  'United States': '#b22234'
};
option = {
  title: {
    //图表标题填写位置
    text: '图表标题',
    //图表副标题填写位置
    subtext: '副标题',
    //图表标题位置;left表示左靠齐
    left: 'left'
  },
  tooltip: {
    trigger: 'axis',
    axisPointer: {
      type: 'shadow'
    }
  },
  toolbox: {
    feature: {
      dataView: { show: true, readOnly: false },
      magicType: { show: true, type: ['line', 'bar'] },
      restore: { show: true },
      saveAsImage: { show: true }
    }
  },
  legend: {},
  grid: {
    //整个图表距离页面最左侧的相对距离
    left: '3%',
    right: '4%',
    //整个图表距离页面顶部的相对距离
    top:'18%',
    bottom: '3%',
    containLabel: true
  },
  //纵坐标
  xAxis: [
    {
      type: 'category',
      //纵坐标名称
      data: ['2022-7-1', '2022-7-2', '2022-7-3', '2022-7-4', '2022-7-5',
      '2022-7-6', '2022-7-7','2022-7-8','2022-7-9','2022-7-10',
      '2022-7-11','2022-7-12','2022-7-13','2022-7-14','2022-7-15',
      '2022-7-16','2022-7-17','2022-7-18','2022-7-19','2022-7-20',
    '2022-7-21','2022-7-22','2022-7-23','2022-7-24','2022-7-25',
    '2022-7-26','2022-7-27','2022-7-28','2022-7-29','2022-7-30'
    ],
    axisLabel: {
      interval: 0,
      rotate: 30
    }
    }
  ],
  //横坐标
  yAxis: [
    {
      type: 'value',
      //纵坐标名称
      name: '单位1',
    },
    {
      type: 'value',
      name: '单位2',
      //纵坐标最小值
      //min: 0,
      //max: 100,
      //纵坐标间隔
      interval: 20,
    }
  ],
  series: [
    {
      name: '数据1',
      type: 'line',
      yAxisIndex: 1,
      markLine: {
        //平均线
        data: [{ type: 'average', name: 'Avg' }]
      },
      label: {
        //展示折线点对应的数据
        show: true,
        //数据展示位置,right展示在点的右边
        position: 'right',
      },
      data: [99.59, 114.71, 85.92, 58.9, 83.63, 101.49, 86.82, 79.3, 95.04, 234.91, 41.62, 62.23, 113.63, 97.76, 83.83, 164.91, 108.76, 68.58, 90.65, 89.06, 68.08, 66.28, 233.1, 107.23, 60.1, 72.76, 113.96, 89.59, 86.8, 100]
    },
    {
      name: '数据2',
      type: 'line',
      yAxisIndex: 1,
      markLine: {
        data: [{ type: 'average', name: 'Avg' }]
      },
      label: {
        show: true,
        position: 'right',
      },
      data: [28.0, 15.28, 21.47, 17.38, 142.15, 24.43, 13.14, 32.45, 19.19, 11.81, 5.68, 7.69, 3.67, 16.34, 5.2, 14.82, 28.38, 19.25, 22.4, 11.46, 2.69, 20.27, 34.78, 19.64, 10.72, 22.71, 13.94, 12.23, 10.78, 14.45]
    }
  ]
};
4、组合图
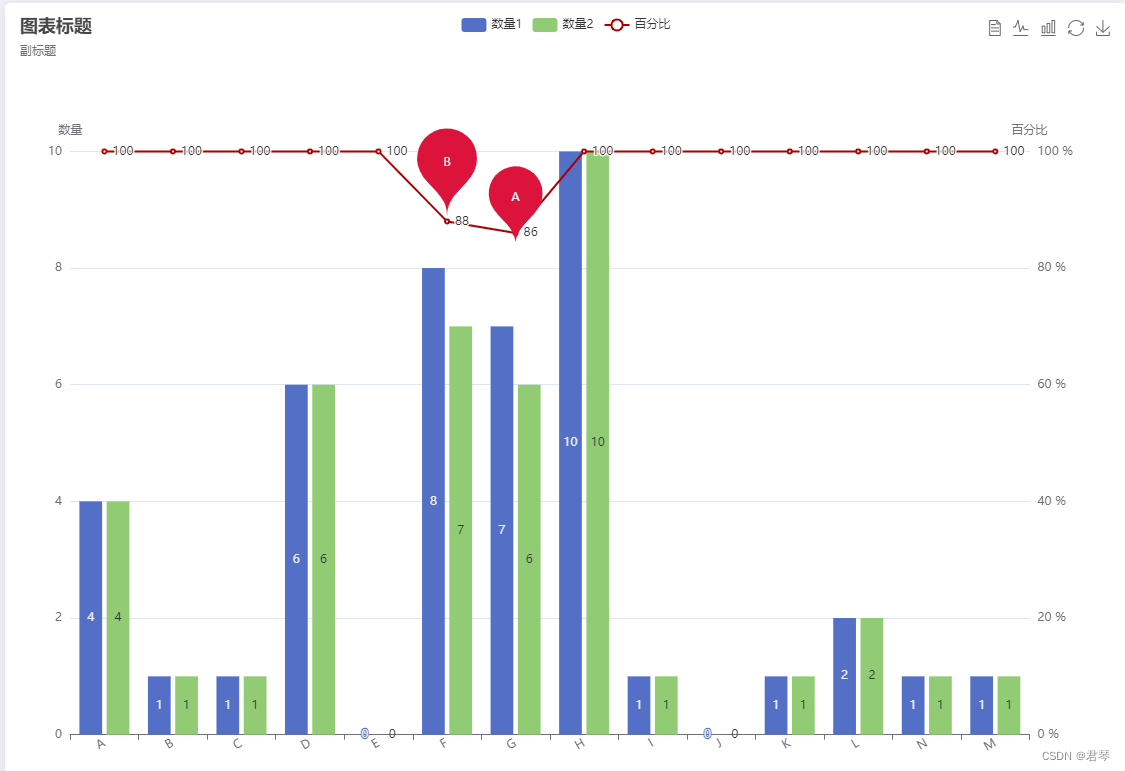
4.1 柱状图+折线图
柱状图与折线图的形式,可便捷看出数据总量、分类及其数据趋势走向。
可自定义数据、分类,双y轴、数据备注点等。
代码示例如下:
option = {
  title: {
    //图表标题填写位置
    text: '图表标题',
    //图表副标题填写位置
    subtext: '副标题',
    //图表标题位置;left表示左靠齐
    left: 'left'
  },
  tooltip: {
    trigger: 'axis',
    axisPointer: {
      type: 'shadow'
    }
  },
  legend: {},
  grid: {
    //整个图表距离页面最左侧的相对距离
    left: '3%',
    right: '4%',
   //整个图表距离页面顶部的相对距离
    top:'18%',
    bottom: '3%',
    containLabel: true
  },
  toolbox: {
    feature: {
      dataView: { show: true, readOnly: false },
      magicType: { show: true, type: ['line', 'bar'] },
      restore: { show: true },
      saveAsImage: { show: true }
    }
  },
 //横坐标
  xAxis: [
    {
      type: 'category',
      //横坐标的名称
      data: ['A', 'B', 'C', 'D', 'E','F',
    'G','H','I','J','K','L',
    "N","M"],
    axisLabel: {
      interval: 0,
      //横坐标名称倾斜程度
      rotate: 30
    }
    }

  ],
//纵坐标,双纵坐标
  yAxis: [
    {
      type: 'value',
      //纵坐标名称
      name: '数量',
    },
    {
      type: 'value',
      name: '百分比',
      //纵坐标最小值
      min: 0,
      max: 100,
      //纵坐标间隔
      interval: 20,
      axisLabel: {
        //纵坐标加单位
      formatter: '{value} %'
      }
    }
  ],
  series: [
    {
      name: '数量1',
      type: 'bar',
      emphasis: {
        focus: 'series'
      },
      label: {
        show: true
      },
      data: [4,1,1,6,0,
      8,7,10,1,0,
      1,2,1,1]
    },
    {
      name: '数量2',
      type: 'bar',
      emphasis: {
        focus: 'series'
      },
      label: {
        show: true
      },
      data: [4,1,1,6,0,
      7,6,10,1,0,
      1,2,1,1]
    },
    {
      name: '百分比',
      markPoint: {
        data: [
          //备注点的名称,展示内容,坐标点
          { name: 'markPoint', value: 'A', xAxis: 6, yAxis: 84,
          symbolSize:90,
          itemStyle:{
            //指定颜色
              color:'#DC143C'
          }
          },
          { name: 'markPoint', value: 'B', xAxis: 5, yAxis: 89,
          symbolSize:100,
          itemStyle:{
              color:'#DC143C'
          },
          }
        ],
      },
      type: 'line',
      yAxisIndex: 1,
      tooltip: {
        valueFormatter: function (value) {
          return value + ' %';
        }
      },
      color:'#a90000',
      label: {
        show: true,
        position: 'right',
      },
      data: [100,100,100,100,100,
      88,86,100,100,100,
      100,100,100,100]
    }
  ]
};