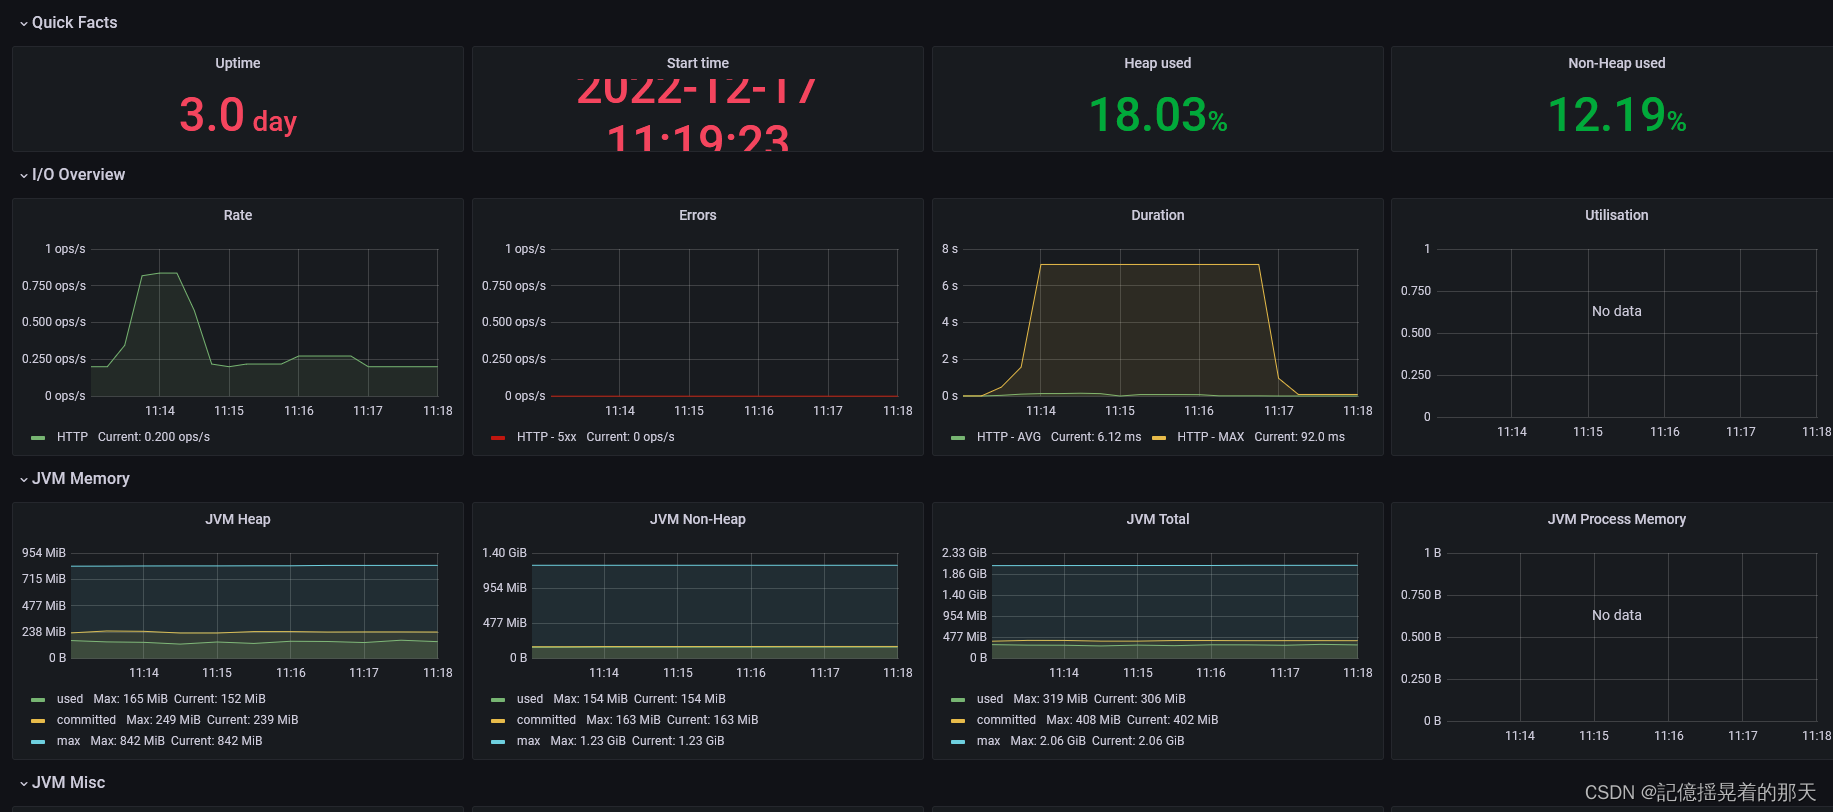
最终效果
actuator
actuator是什么
看一看chatGPT怎么说?
Spring Boot Actuator是Spring Boot的一个子项目,它为监视和管理Spring Boot应用程序提供了附加功能。它提供了一组端点,允许您监视和管理应用程序,如运行状况检查、度量和有关应用程序的各种其他信息。您可以使用这些端点来更好地了解应用程序在生产环境中的行为,并解决可能出现的任何问题。
弹簧启动执行器提供的一些功能包括:
1、 运行状况检查:执行器提供了一个/Health端点,您可以使用它来检查应用程序的运行状况。这可以包括检查外部服务的可用性、数据库的状态等。2、指标:Actuator提供了许多关于应用程序的指标,例如内存使用率、CPU使用率和请求率。您可以使用这些指标来了解应用程序的性能,并确定任何潜在的性能问题。
3、日志记录:执行器提供了一个/lofile端点,您可以使用它来访问应用程序的日志文件。这有助于解决生产环境中的问题。
4、 审计:可以将执行器配置为记录有关向应用程序发出的请求的信息,包括请求和响应数据。这对于跟踪应用程序的更改和识别安全漏洞非常有用。
总结:Spring Boot Actuator是监控和管理生产中的Spring Boot应用程序的有用工具。它提供了一系列端点,可用于收集有关应用程序的信息,并可根据需要进行配置以提供其他功能。
配置actuator
maven依赖
        <!--actuator-->
        <dependency>
            <groupId>org.springframework.boot</groupId>
            <artifactId>spring-boot-starter-actuator</artifactId>
        </dependency>
配置文件
# 监控配置
# 对外暴露所有监控指标
management:
  endpoints:
    web:
      exposure:
        include: "*"
注意:这个配置必须要在yml中配置,否则启动时会报
org.springframework.beans.factory.BeanDefinitionStoreException: Failed to process import candidates for configuration class [com.sifan.erp.ErpApplication]; nested exception is java.lang.IllegalStateException: Error processing condition on org.springframework.boot.actuate.autoconfigure.audit.AuditEventsEndpointAutoConfiguration
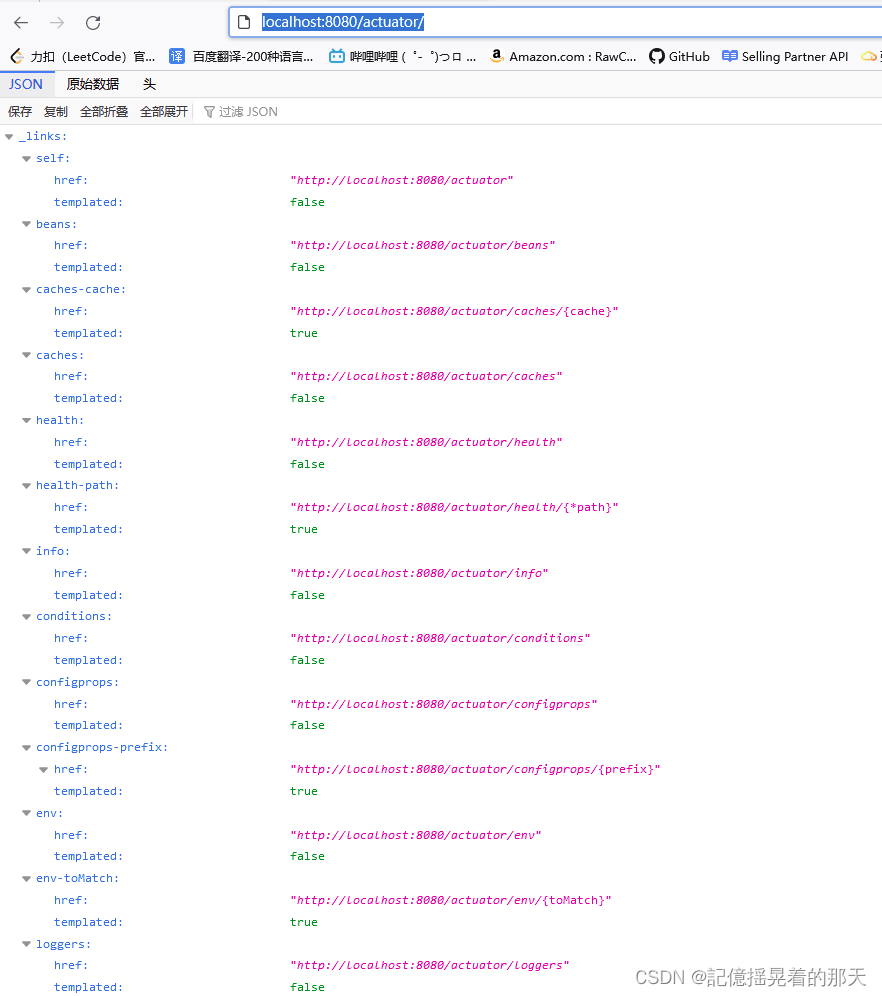
测试:http://localhost:8080/actuator/
注意:如果设置了拦截器需要放行 “/actuator/**”
Prometheus
Prometheus是什么
Prometheus结合Actuator配置
依赖
 <!--prometheus -->
        <dependency>
            <groupId>io.micrometer</groupId>
            <artifactId>micrometer-registry-prometheus</artifactId>
            <scope>runtime</scope>
        </dependency>
配置,这个配置包含了actuator的配置
# 监控配置
# 对外暴露所有监控指标
management:
 endpoints:
   web:
     exposure:
       include: "*"
 endpoint:
   prometheus:
     enabled: true # 激活普罗米修斯
   health:
     show-details: always # 健康值总是展示细节
 metrics:
   export:
     prometheus:
       enabled: true # 指标允许被导出
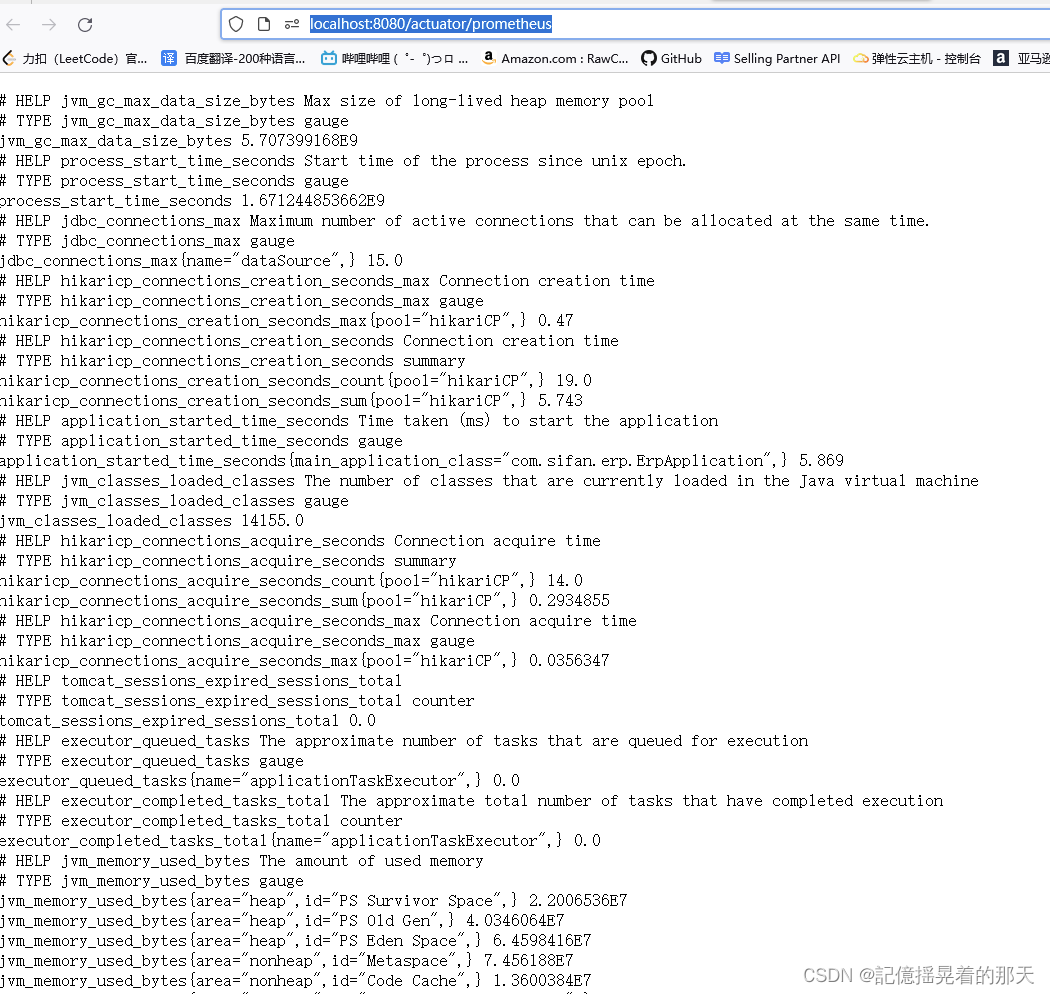
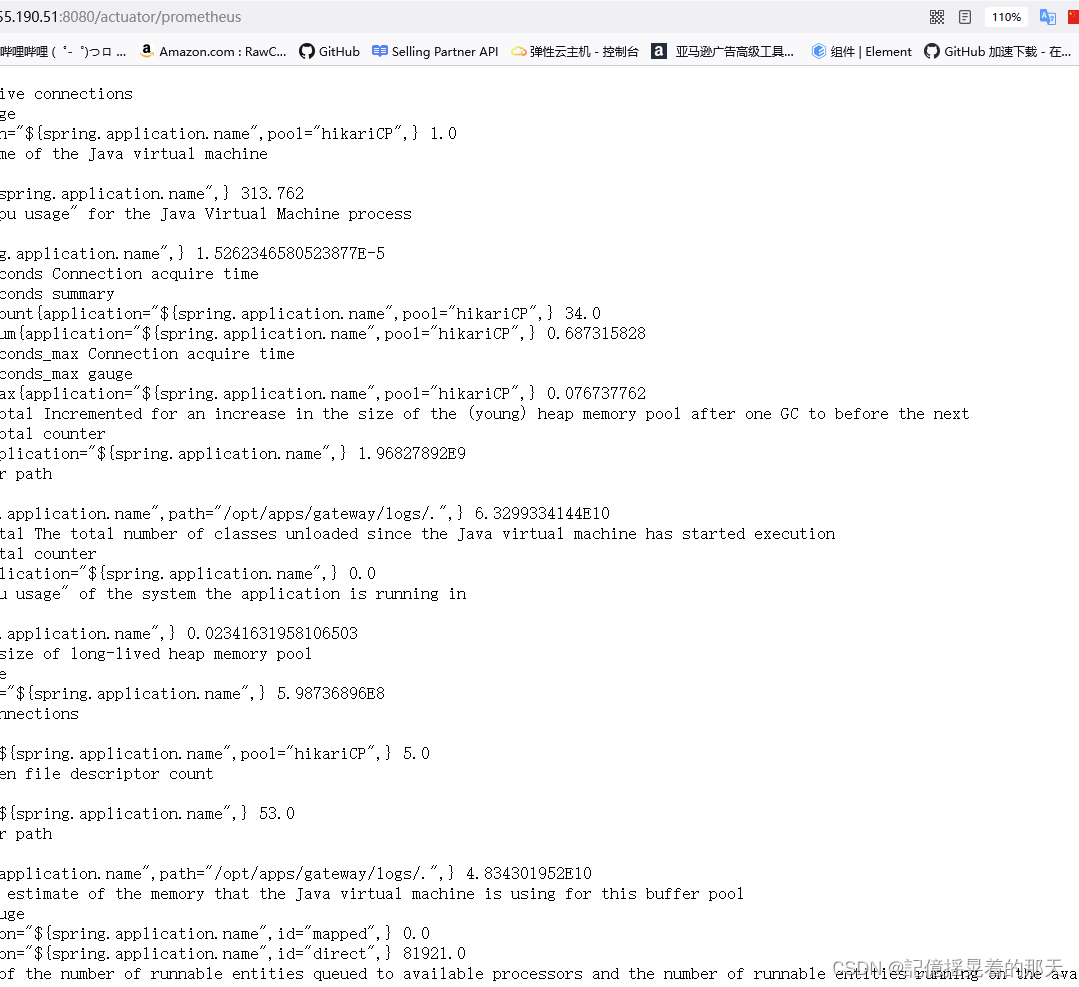
测试是否生效
http://localhost:8080/actuator/prometheus
 为普罗米修斯命名,在启动类配置bean,也可以在配置类中配置
@SpringBootApplication
@EnableAsync
@MapperScan("com.sifan.erp.mapper")
public class ErpApplication {

    public static void main(String[] args) {
        SpringApplication.run(ErpApplication.class, args);
    }


    /**
     * 为普罗米修斯命名*
     *
     * @param applicationName
     * @return
     */
    @Bean
    MeterRegistryCustomizer<MeterRegistry> configure(@Value("${spring.application.name") String applicationName) {
        return register -> {
            register.config().commonTags("application", applicationName);
        };
    }
}
应用部署使用
1、springBoot部署到服务器
我使用的是docker形式容器化部署
1、clear
目的是删除target文件
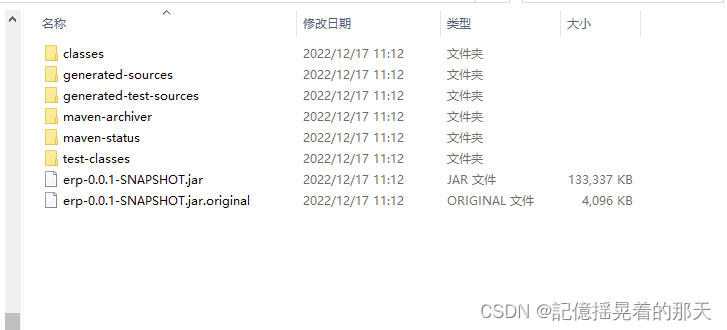
2、package
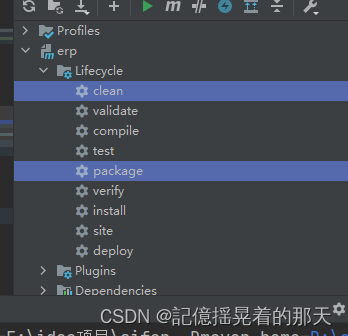
打包成功之后会后个jar包
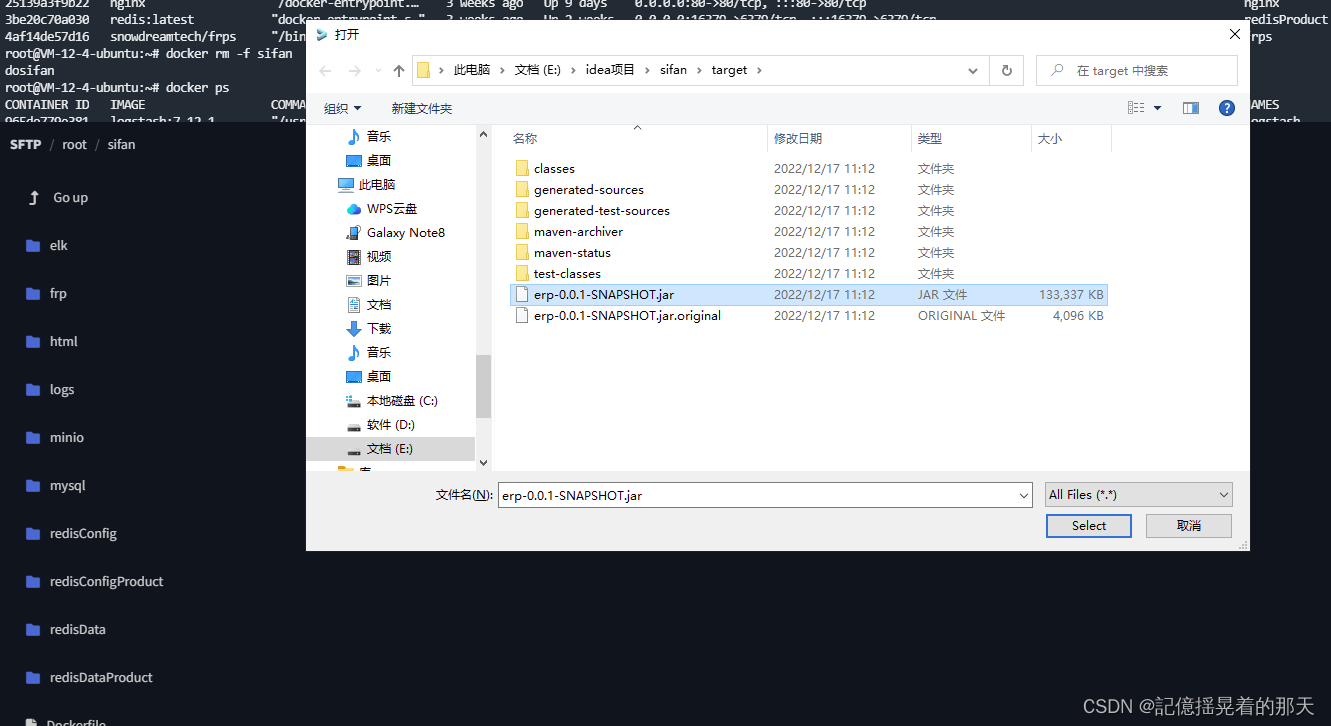
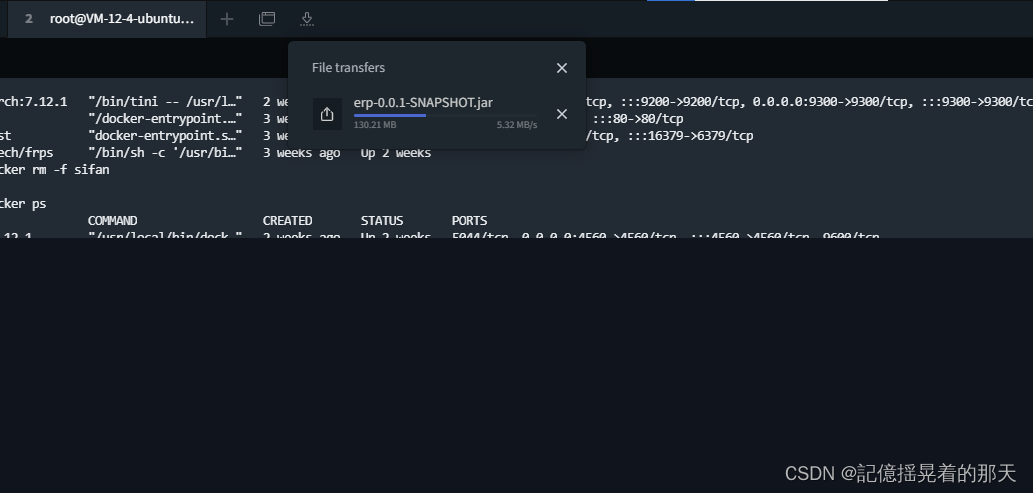
 上传jar包
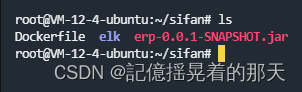
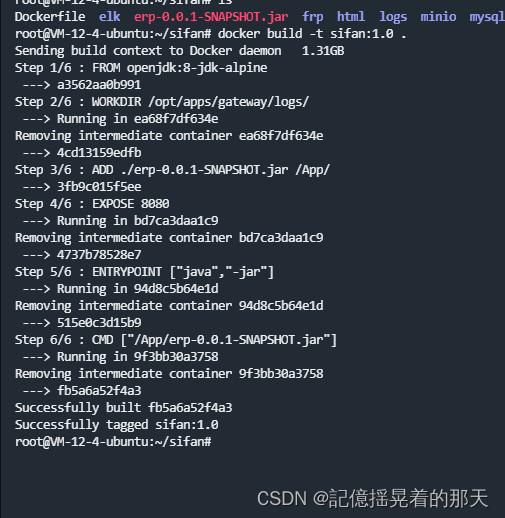
 3、Dockerfile文件
FROM openjdk:8-jdk-alpine
WORKDIR /opt/apps/gateway/logs/
ADD ./erp-0.0.1-SNAPSHOT.jar /App/
EXPOSE 8080
ENTRYPOINT ["java","-jar"]
CMD ["/App/erp-0.0.1-SNAPSHOT.jar"]
4、构建镜像,注意最后面的点,表示当前目录搜索Dockerfile构建镜像
docker build -t sifan:1.0 .
5、运行镜像
docker run --name sifan -p 8080:8080 -d sifan:1.0
看下部署之后普罗米修斯怎么样?
docker运行prometheus容器
1、拉取镜像
docker pull prom/prometheus
2、创建配置文件prometheus.yml,下面的targets修改为自己应用的ip和端口就行,jobname为应用的名字即spring.application.name的值
# my global config
global:
  scrape_interval: 15s # Set the scrape interval to every 15 seconds. Default is every 1 minute.
  evaluation_interval: 15s # Evaluate rules every 15 seconds. The default is every 1 minute.
  # scrape_timeout is set to the global default (10s).

# Alertmanager configuration
alerting:
  alertmanagers:
    - static_configs:
        - targets:
          # - alertmanager:9093

# Load rules once and periodically evaluate them according to the global 'evaluation_interval'.
rule_files:
  # - "first_rules.yml"
  # - "second_rules.yml"

# A scrape configuration containing exactly one endpoint to scrape:
# Here it's Prometheus itself.
scrape_configs:
  # The job name is added as a label `job=<job_name>` to any timeseries scraped from this config.
###以下内容为SpringBoot应用配置
  - job_name: 'sifanOS'
    scrape_interval: 5s
    metrics_path: '/actuator/prometheus'
    static_configs:
      - targets: ['106.55.190.57:8080']
启动容器,注意:/root/sifan/prometheus这个目录为配置文件prometheus.yml所在的目录,可以随便放在哪里
docker run -d -p 9090:9090 --name prometheus -v /root/sifan/prometheus:/data prom/prometheus --config.file=/data/prometheus.yml
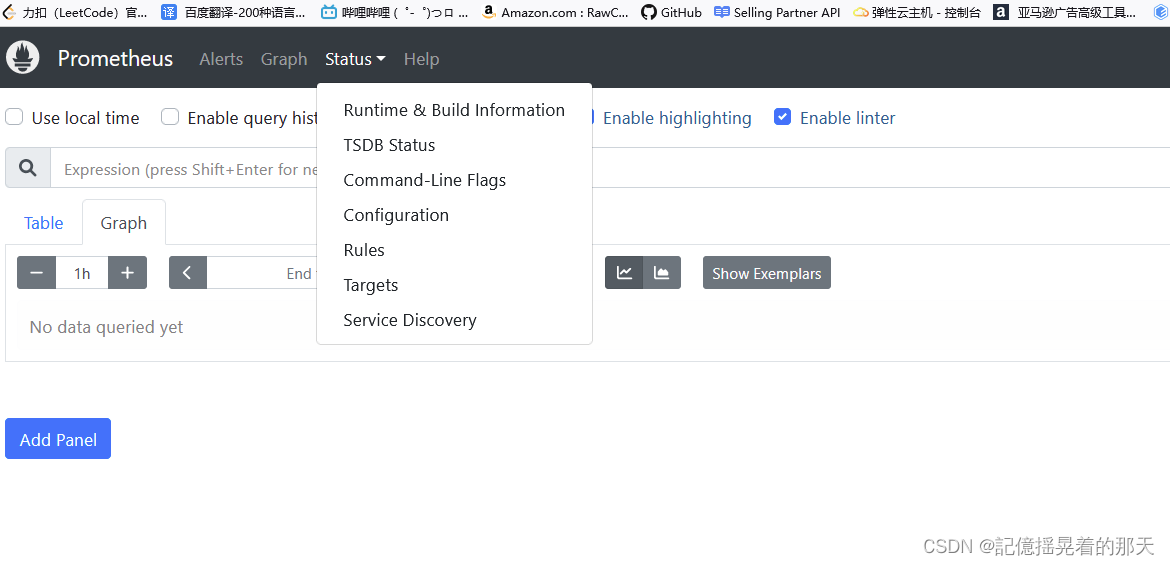
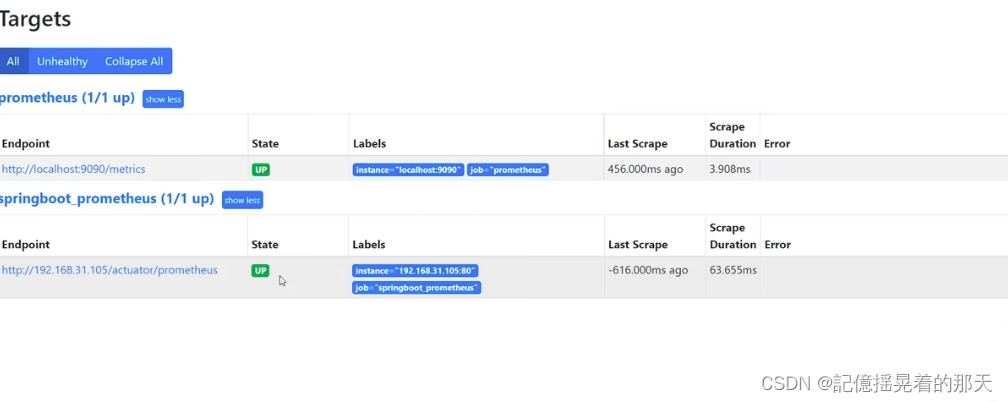
点击status下面的targets就能看到
Grafana
Grafana是什么?
Grafana 是一个开源的数据可视化和监控平台。它允许用户创建和共享交互式仪表板以监控各种指标和数据点。 Grafana 支持广泛的数据源,包括流行的时间序列数据库,如 Prometheus、InfluxDB 和 Graphite,以及其他数据库和数据源,如 MySQL、PostgreSQL 和 Elasticsearch。
Grafana 通常用于监控基础架构和应用程序的性能和可用性并发出警报。它是高度可定制的,具有广泛的插件和主题可用于扩展其功能和外观。 Grafana 在 DevOps 专业人士中很受欢迎,并且经常与 Prometheus 和 Kubernetes 等其他工具结合使用来监控和管理分布式系统。
1、拉取镜像
docker pull grafana/grafana
2、运行
docker run -d -p 3000:3000 grafana/grafana
3、访问grafana,默认的用户名和密码的都是admin
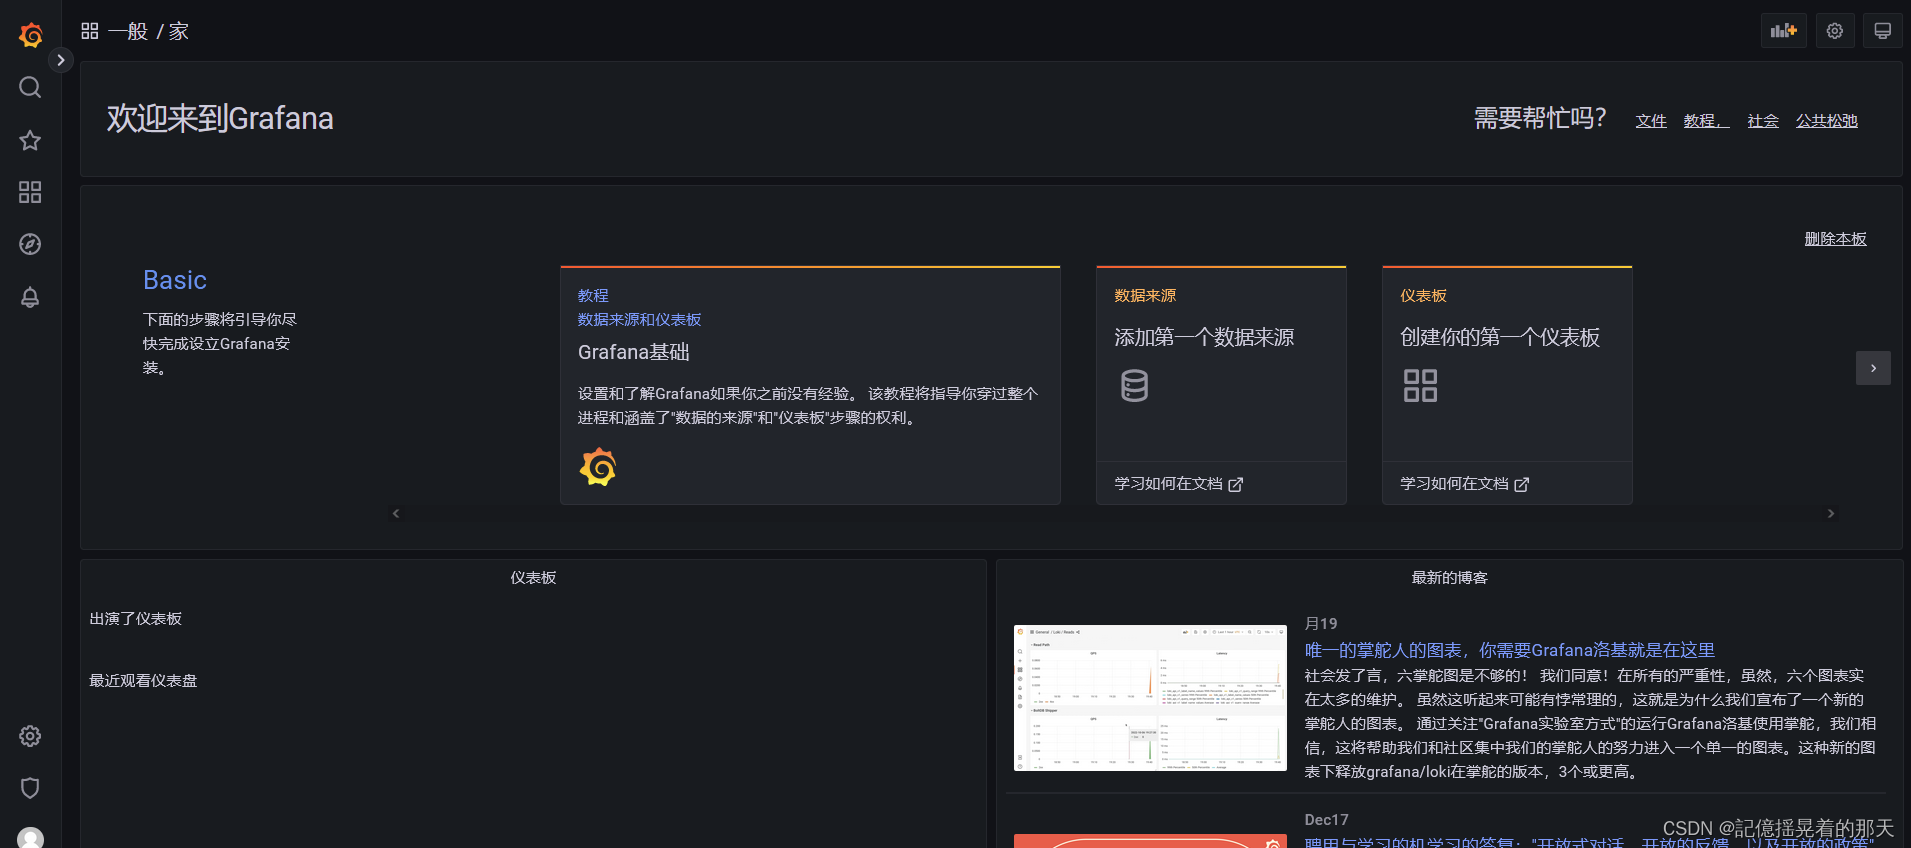
 登录成功来到首页
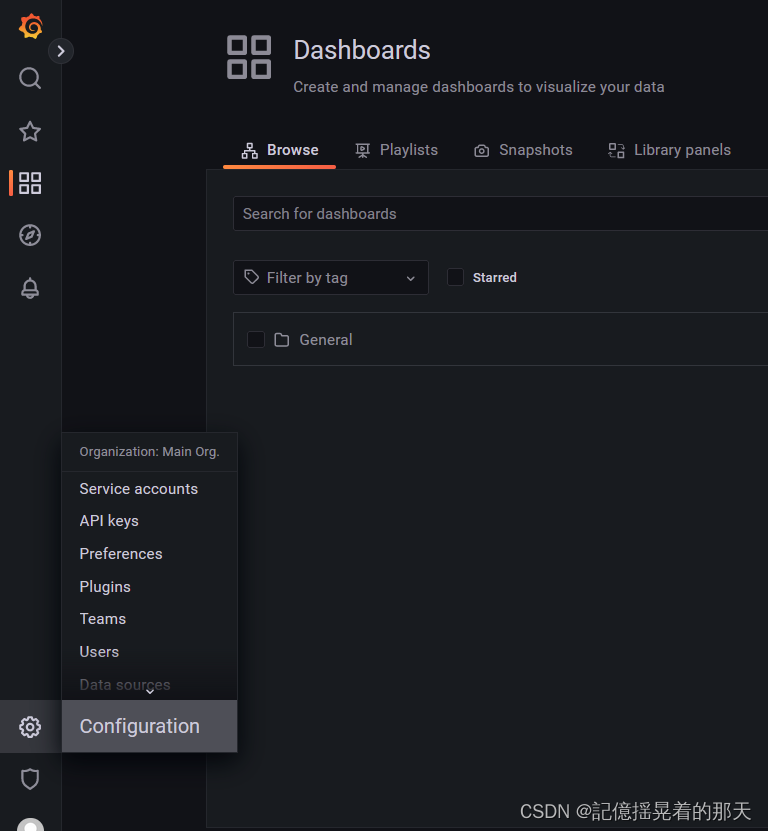
配置数据源,点击Configuration
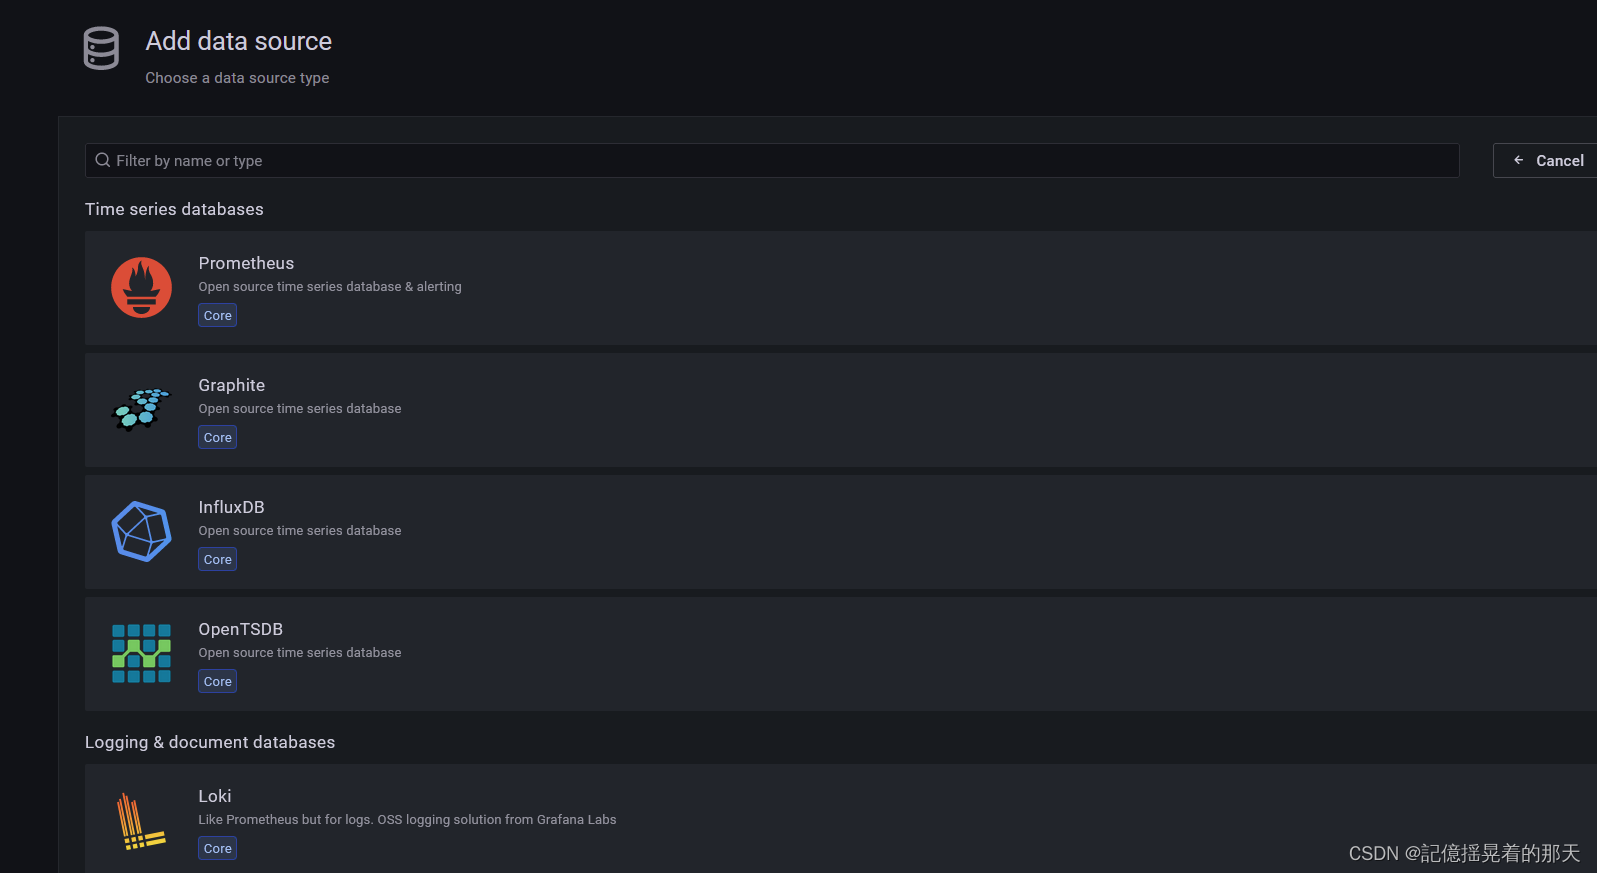 点击普罗米修斯图标进行配置
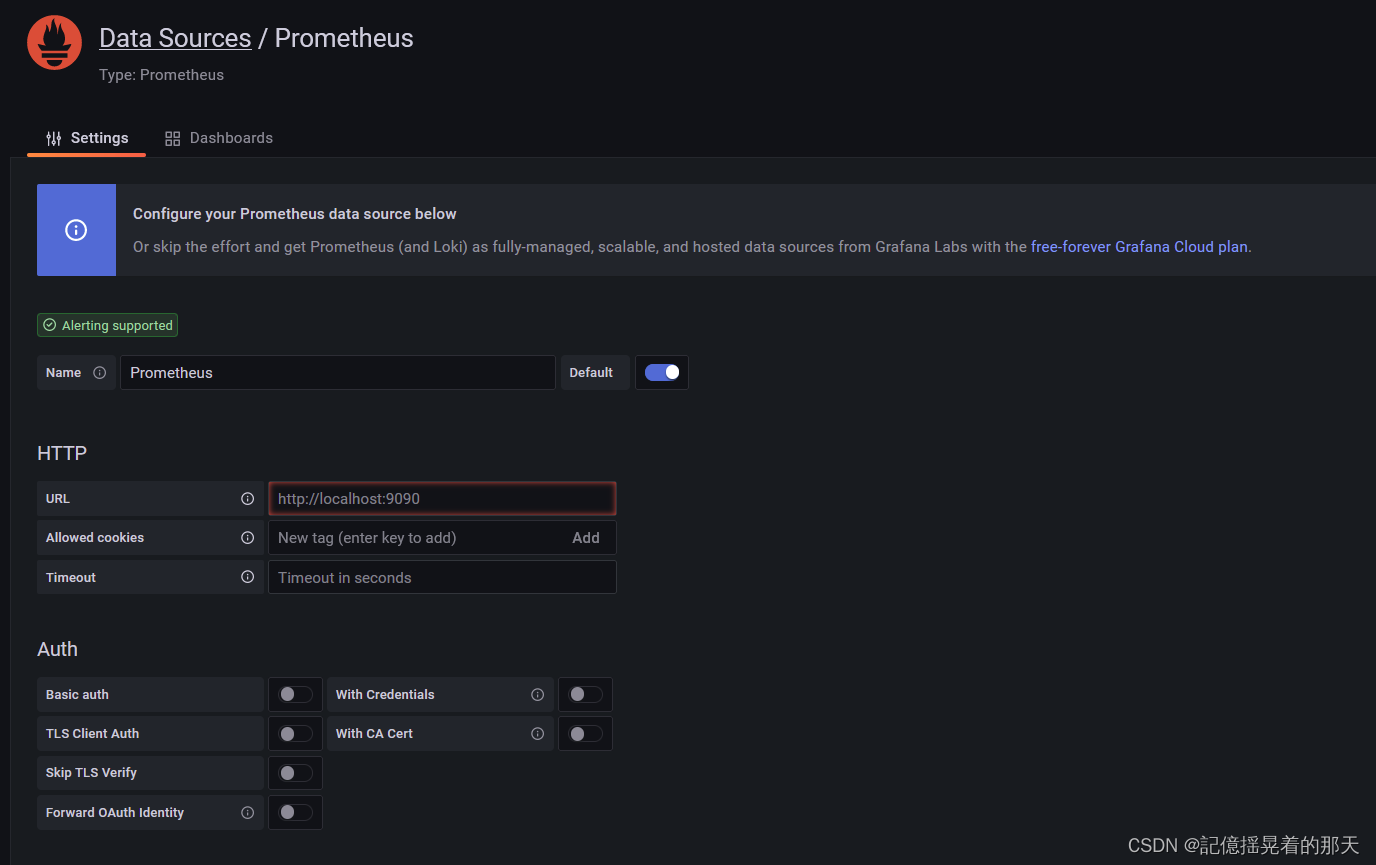 填入普罗米修斯的ip和端口
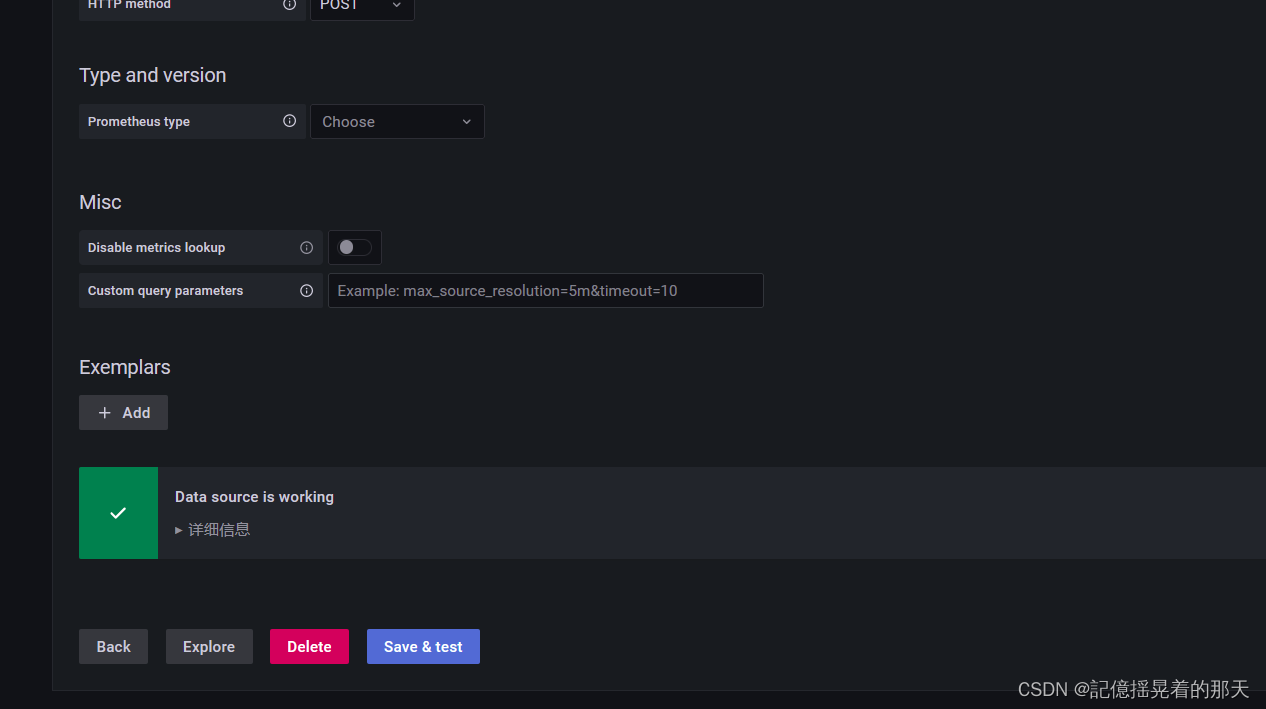
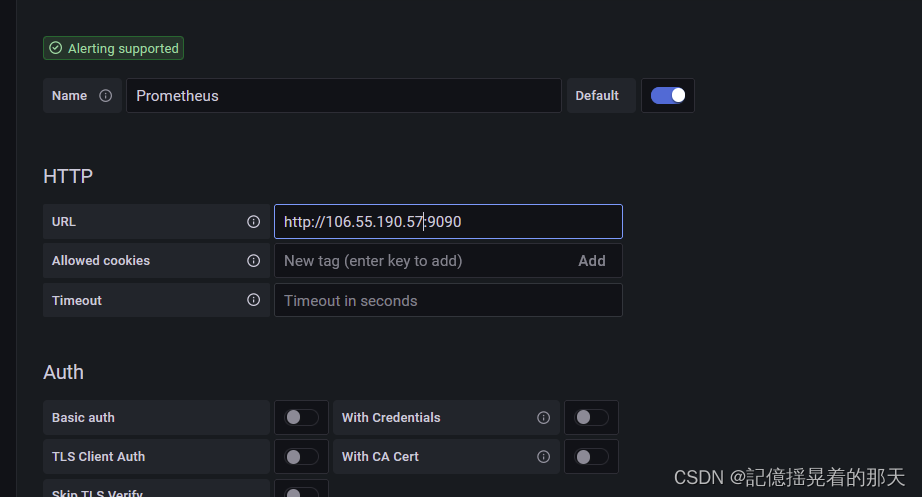 点击最下面的save and test,出现Data source is working表示成功配置
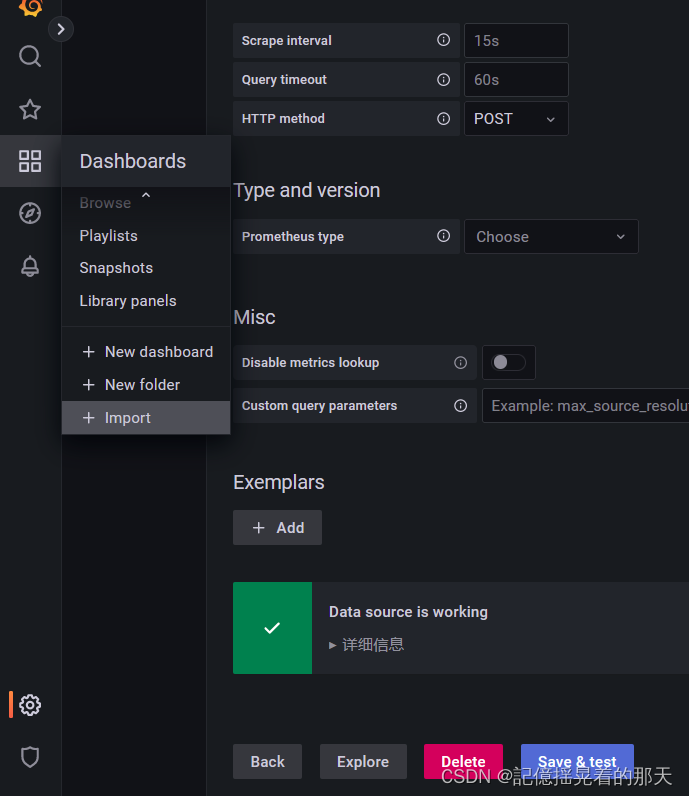
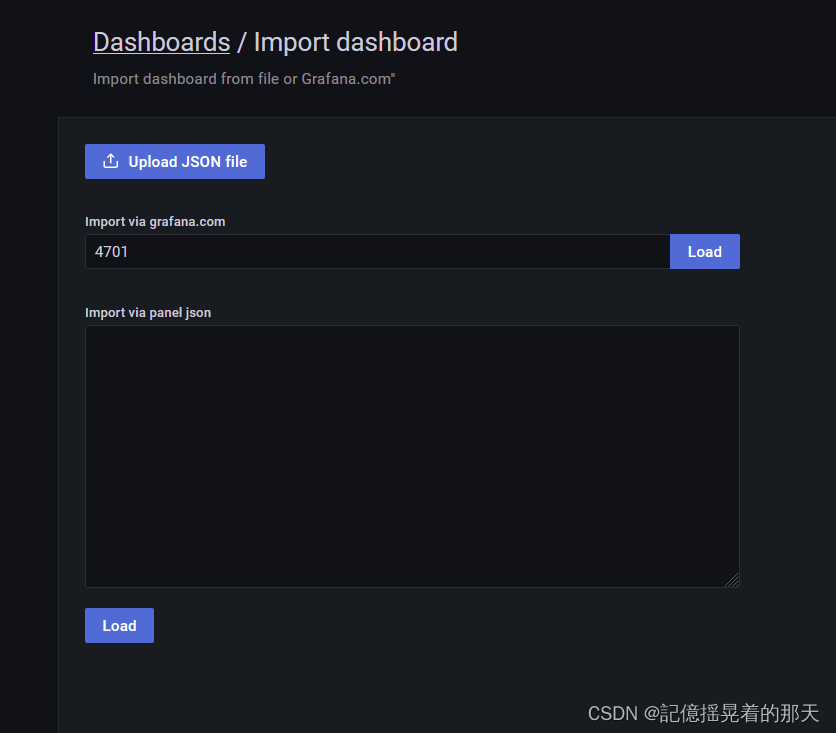
 接下来点击左侧的import
在这里你可以导入你想要的仪表盘
所有普罗米修斯的仪表盘:https://grafana.com/grafana/dashboards/?dataSource=prometheus
因为我们监控的是JVM,所以选择JVM
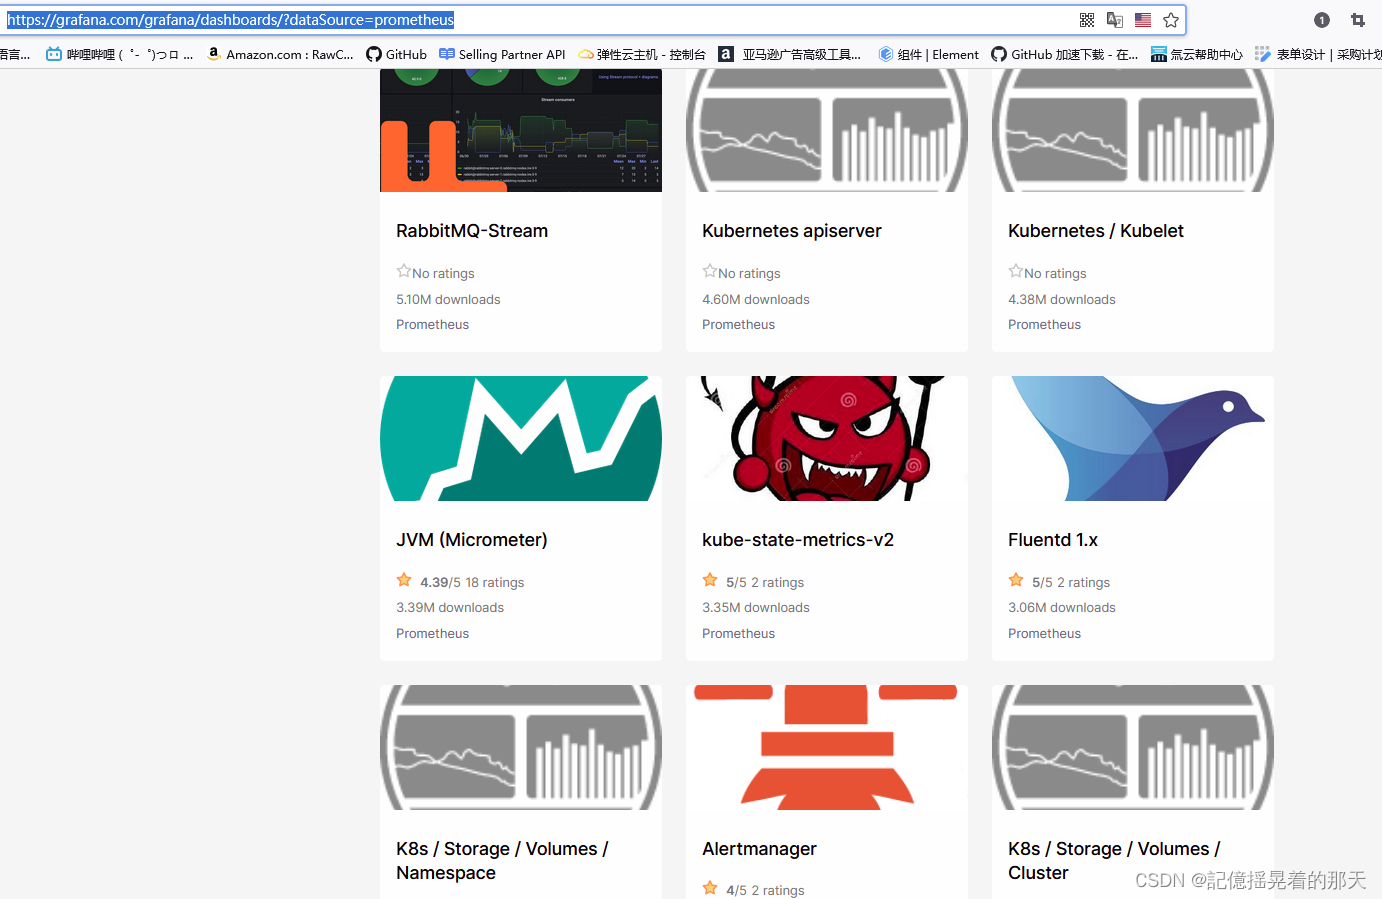
点击JVM,复制ID到粘贴板
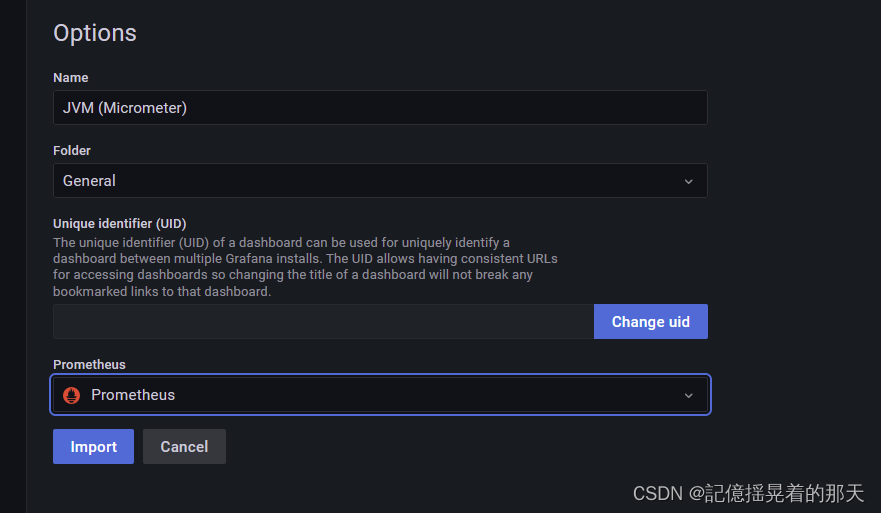
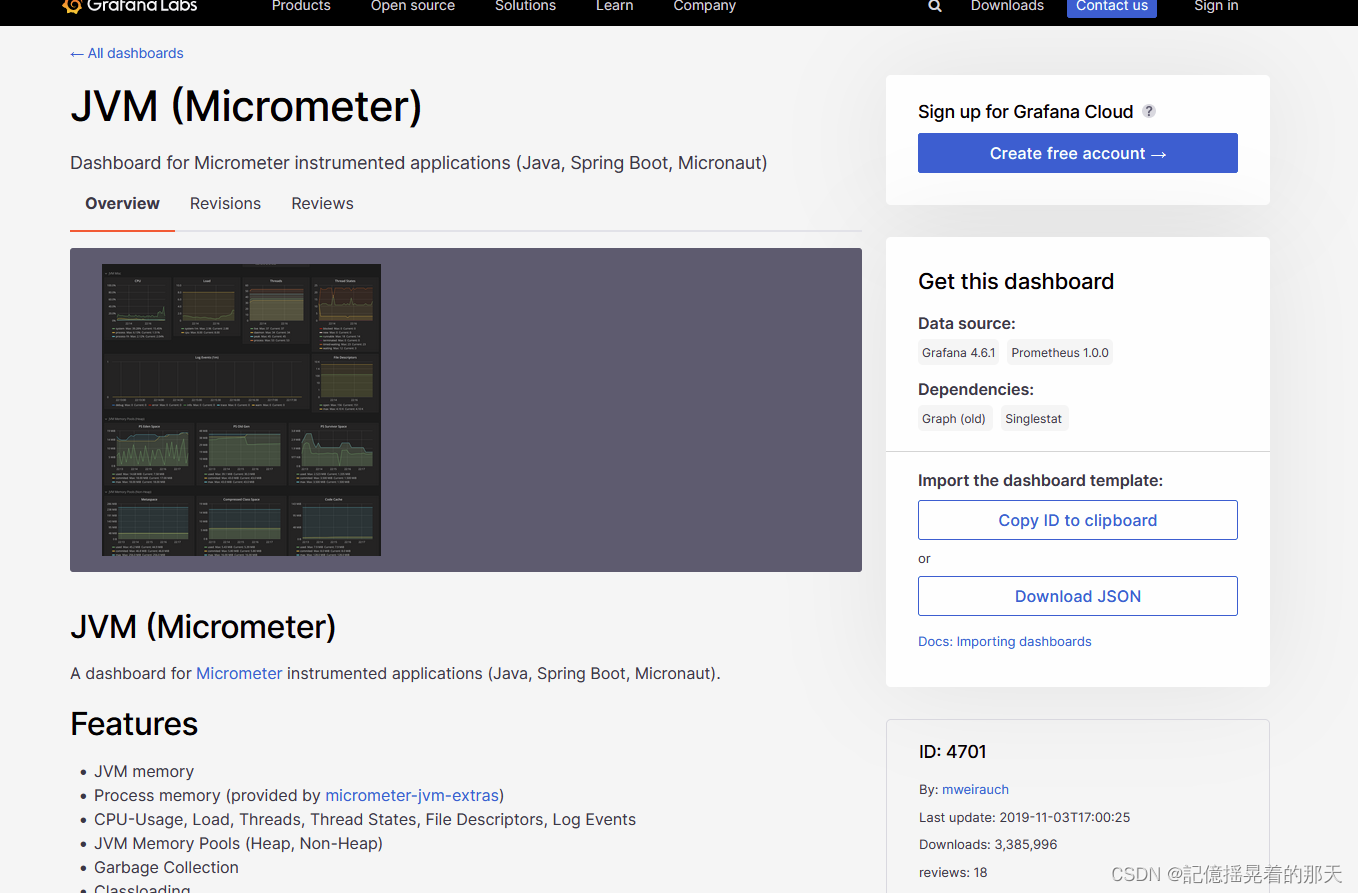 把复制的仪表盘id粘贴进来,可以看到id是4701,点击Load
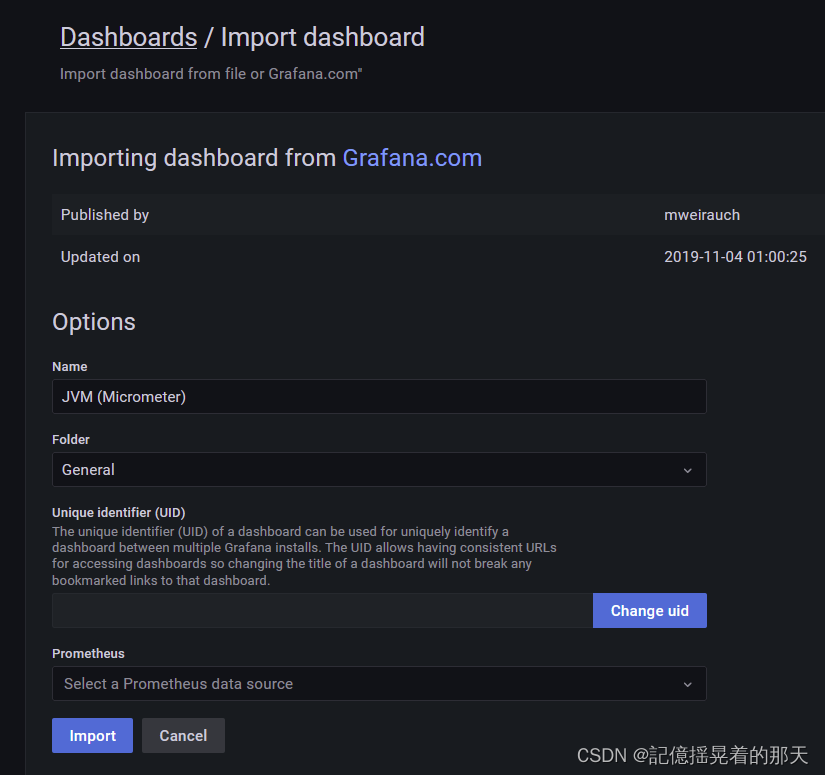 选择前面配置好的数据源
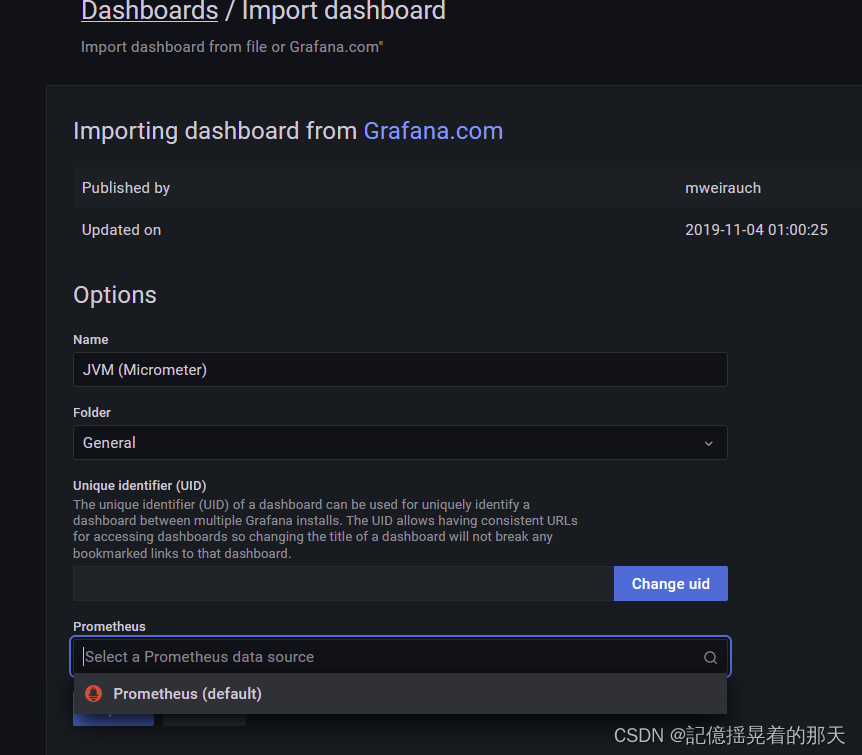 点击Import
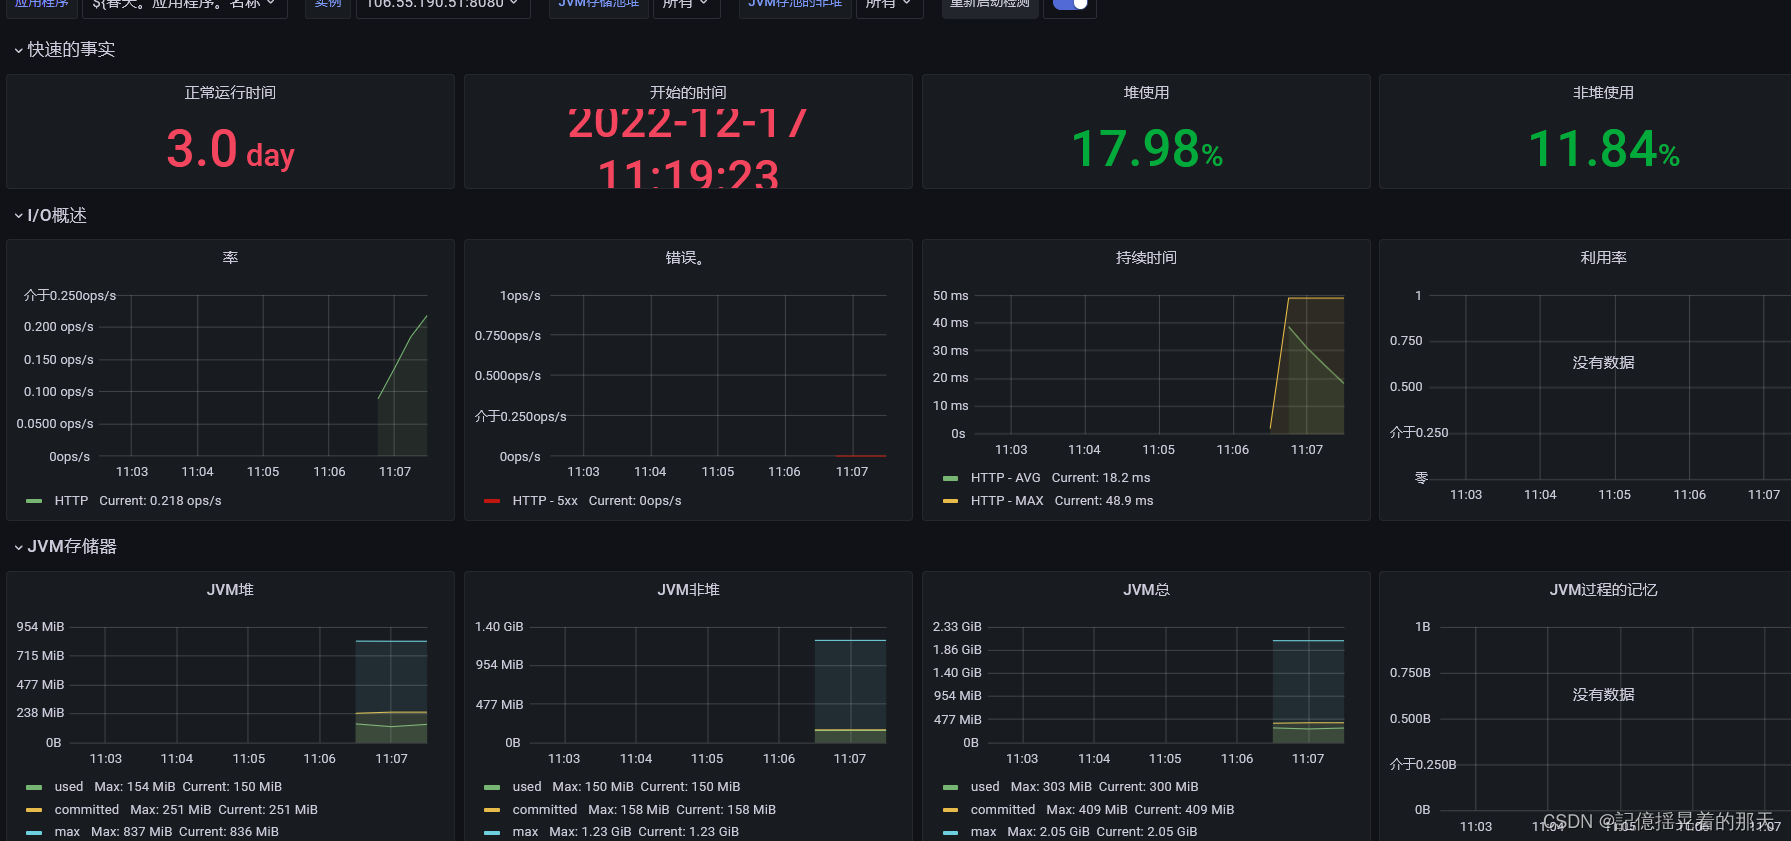
他会间隔的刷新数据
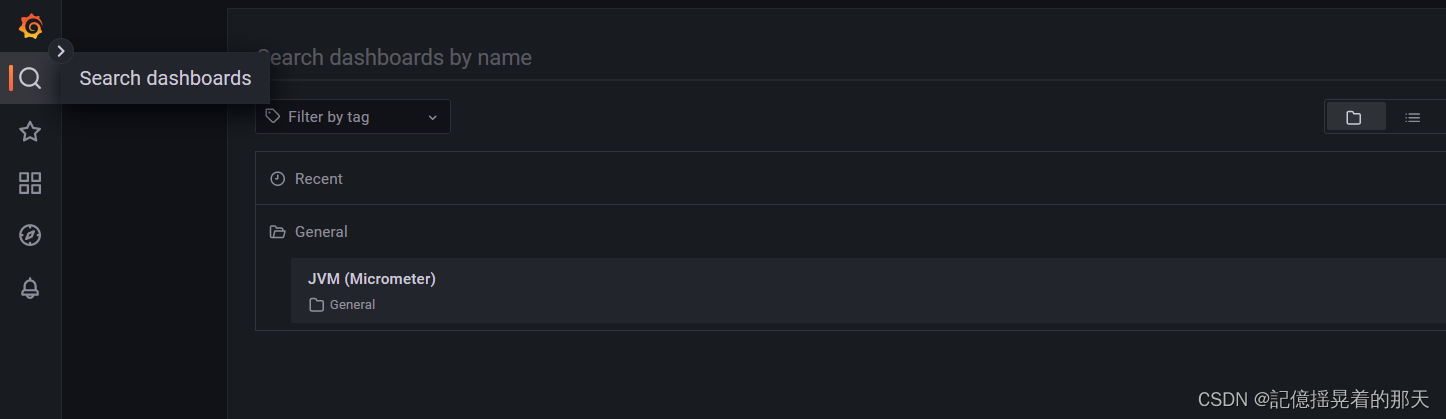
后面可以从这个地方进去
![[附源码]计算机毕业设计Python电影推荐网站(程序+源码+LW文档)](https://img-blog.csdnimg.cn/e78f7f1697354120ae7de6339ed8ffd7.png)