语言代码:
setwd("D:/Desktop/0000/R") #更改路径

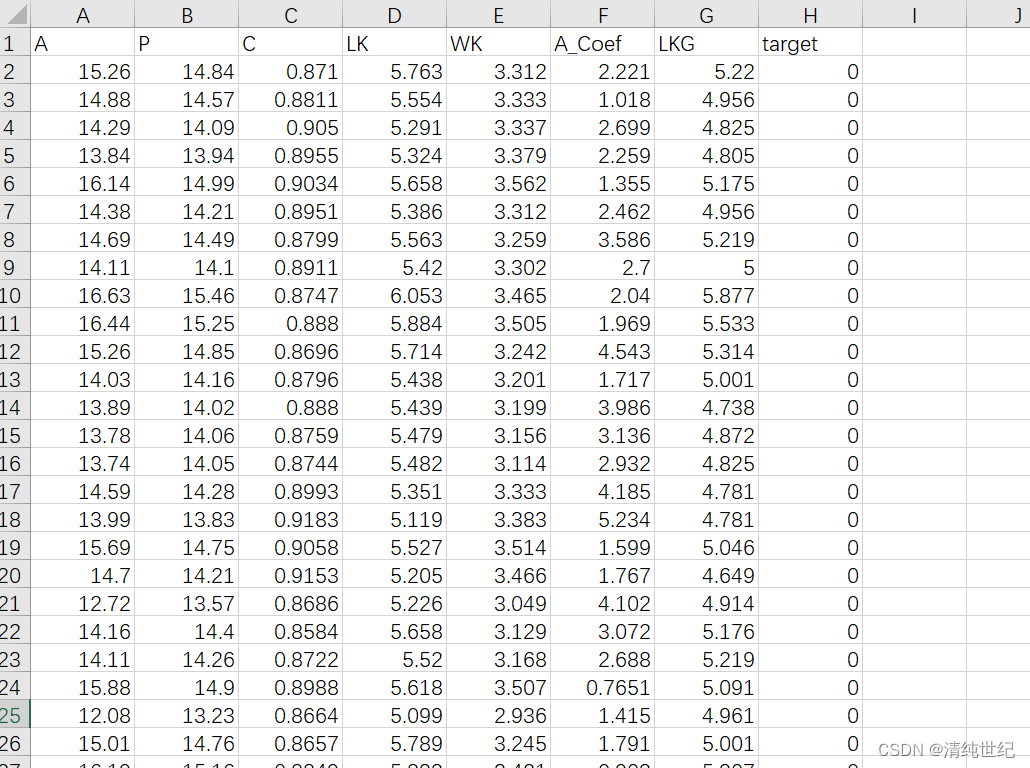
df<-read.csv("kaggle/Seed_Data.csv")
head(df)
df$target<-factor(df$target) # 因为目标是数字,所以加他,不加会报错
cols<-c("steelblue","yellowgreen","violetred1")
# install.packages("GGally")
library(GGally) # 帮助文档:https://ggobi.github.io/ggally/reference/ggpairs.html

# 设置画布大小为4英寸宽,4英寸高
par(mar = c(4, 4, 2, 2) + 0.1)
png("output.png", width = 8, height = 8, units = "in", res = 600)

ggpairs(df,
        axisLabels="none", # 不显示刻度值
        columns = 1:7, # 我们的数据是第1~7列
        aes(color=target))+ # 分类别显示颜色
  scale_color_manual(values = cols)+ # 更改显示颜色
  scale_fill_manual(values = cols)+ # 更改显示对角线颜色
  theme_bw()
  # 设置颜色和大小的
  # theme(axis.text = element_text(colour = "black",
  #                              size = 11),
  #     strip.background = element_rect(colour = "white",
  #                                     size=12),
  #     strip.text = element_text(face="bold"))

# 结束绘图并关闭设备
dev.off()
数据结构:
