目录
基于js 文件玫瑰图绘图
基于vue3 绘制玫瑰图
基于js文件绘图
// 定义一个配置对象
var option = {
  // 图例设置
  legend: {
    top: 'bottom'
  },
  // 工具栏设置
  toolbox: {
    show: true,
    feature: {
      mark: { show: true }, // 标记工具
      dataView: { show: true, readOnly: false }, // 数据视图工具
      restore: { show: true }, // 恢复工具
      saveAsImage: { show: true } // 保存为图片工具
    }
  },
  // 系列数据设置
  series: [
    {
      name: 'Nightingale Chart', // 系列名称
      type: 'pie', // 图表类型为饼图
      radius: [50, 250], // 饼图的内外半径
      center: ['50%', '50%'], // 饼图的中心位置
      roseType: 'area', // 玫瑰图类型为区域玫瑰图
      itemStyle: {
        borderRadius: 8 // 数据项的样式设置
      },
      // 数据
      data: [
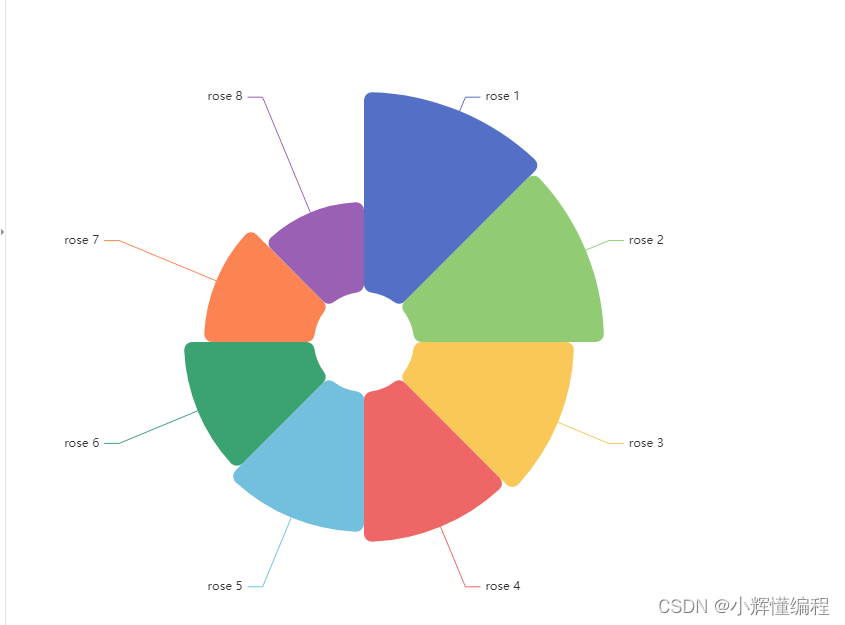
        { value: 40, name: 'rose 1' },
        { value: 38, name: 'rose 2' },
        { value: 32, name: 'rose 3' },
        { value: 30, name: 'rose 4' },
        { value: 28, name: 'rose 5' },
        { value: 26, name: 'rose 6' },
        { value: 22, name: 'rose 7' },
        { value: 18, name: 'rose 8' }
      ]
    }
  ]
};
基于vue3绘制玫瑰图
<template>
  <div ref="pieone" id="pieon">

  </div>

</template>

<script>
import * as echarts from 'echarts'
import { onMounted, ref } from 'vue';

export default {

    setup(){
        const pieone = ref(null)
// 定义方法
        function getEcharts(){
            // 初始化Dom元素进行绘图
        const PieDome = echarts.init(pieone.value)

        PieDome.setOption({
        // 图例设置
        legend: {
            top: 'bottom'
        },

        // 系列数据设置
        series: [
            {
            name: 'Nightingale Chart', // 系列名称
            type: 'pie', // 图表类型为饼图
            radius: [50, 250], // 饼图的内外半径
            center: ['50%', '50%'], // 饼图的中心位置
            roseType: 'area', // 玫瑰图类型为区域玫瑰图
            itemStyle: {
                borderRadius: 8 // 数据项的样式设置
            },
            // 数据
            data: [
                { value: 40, name: 'rose 1' },
                { value: 38, name: 'rose 2' },
                { value: 32, name: 'rose 3' },
                { value: 30, name: 'rose 4' },
                { value: 28, name: 'rose 5' },
                { value: 26, name: 'rose 6' },
                { value: 22, name: 'rose 7' },
                { value: 18, name: 'rose 8' }
            ]
            }
        ]
        })
        };
        // 挂载后调用
    onMounted(()=>{
        getEcharts()
    })

    return{
        pieone
    }
    }
}
</script>

<style scoped>
#pieon{
    width: 700px;
    height: 700px;
}
</style>
你的三连是我最大的动力哦!(^-^)~
