DataFrame.plot函数详解(二)
1. Line
1.1主要参数
import matplotlib.pyplot as plt
import pandas as pd
import numpy as np

df = pd.Series(abs(np.random.randn(10)), index = pd.date_range('2020-01-01', periods = 10))
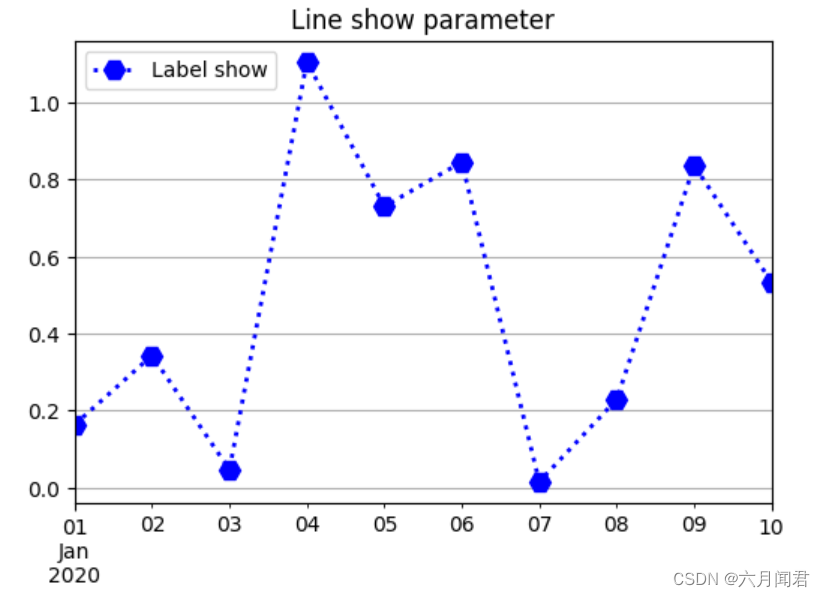
df.plot.line(style= ':',marker='H',color='b',linewidth=2,markersize=10,grid=True,figsize=(6,4),label='Label show',title='Line show parameter')
plt.legend(loc='upper left')
plt.show()
style= ‘:’ 虚线
marker=‘H’ 标记六边形
color=‘b’ 线蓝色
linewidth=2 线粗2
markersize=10 标记大小
grid=True 使用网格
figsize=(6,4) 图示大小
label=‘Label show’ 图示说明
title='Line show parameter’图示标题
plt.legend(loc=‘upper left’) 图示位置
效果如下:
1.2 多组数据做图
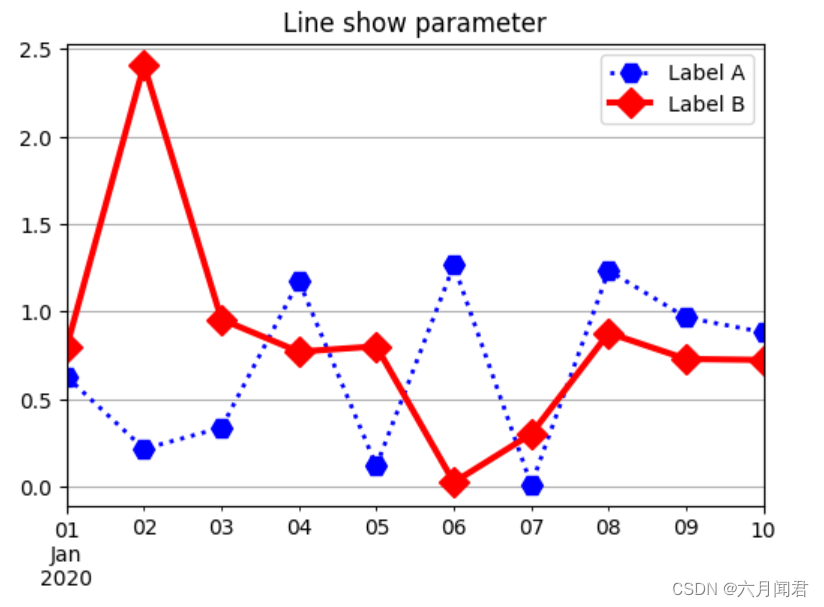
上面是pd.Series 一组数据做图,下面是多组数据做图,分别设置线条不同的参数。
import matplotlib.pyplot as plt
import pandas as pd
import numpy as np

df = pd.DataFrame({'A':abs(np.random.randn(10)), 'B':abs(np.random.randn(10))},index = pd.date_range('2020-01-01', periods = 10))
df.A.plot.line(style= ':',marker='H',color='b',linewidth=2,markersize=10,grid=True,figsize=(6,4),label='Label A',title='Line show parameter')
df.B.plot.line(style= '-',marker='D',color='r',linewidth=3,markersize=10,grid=True,figsize=(6,4),label='Label B',title='Line show parameter')
plt.legend(loc='upper right')
plt.show()
效果如下:
1.3 次要参数
import matplotlib.pyplot as plt
import pandas as pd
import numpy as np

df = pd.DataFrame(abs(np.random.randn(10,2)), columns=['A','B'])
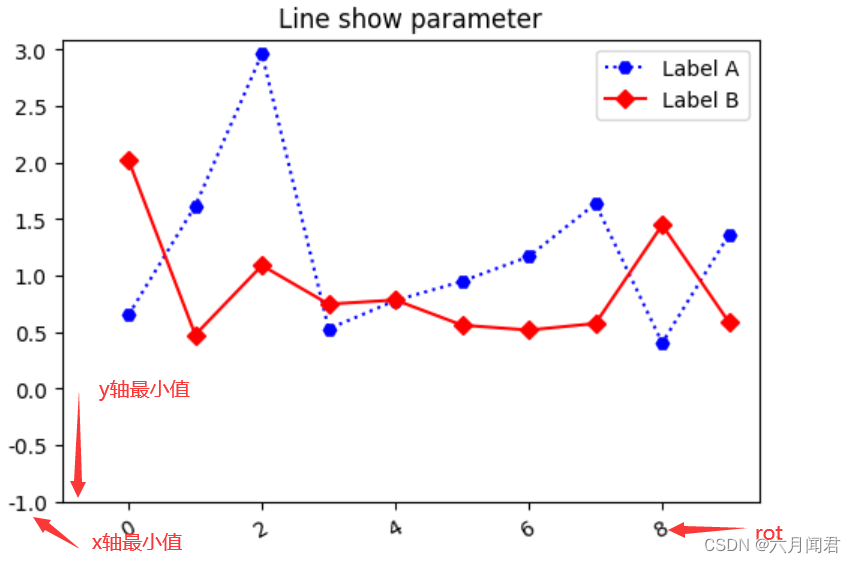
df.A.plot.line(style= ':',marker='H',color='b',figsize=(6,4),label='Label A',xlim=-2,ylim=-2,rot=30,title='Line show parameter')
df.B.plot.line(style= '-',marker='D',color='r',label='Label B',xlim=-1,ylim=-1,rot=30)
plt.legend(loc='upper right')
plt.show()
xlim=-1 x轴最小值
ylim=-1 y轴最小值
rot=30 坐标标示旋转角度
注意:plot最后执行的参数生效。
A.plot xlim=-2,ylim=-2
B.plot xlim=-1,ylim=-1 生效
效果如下:
调整坐标轴的大小
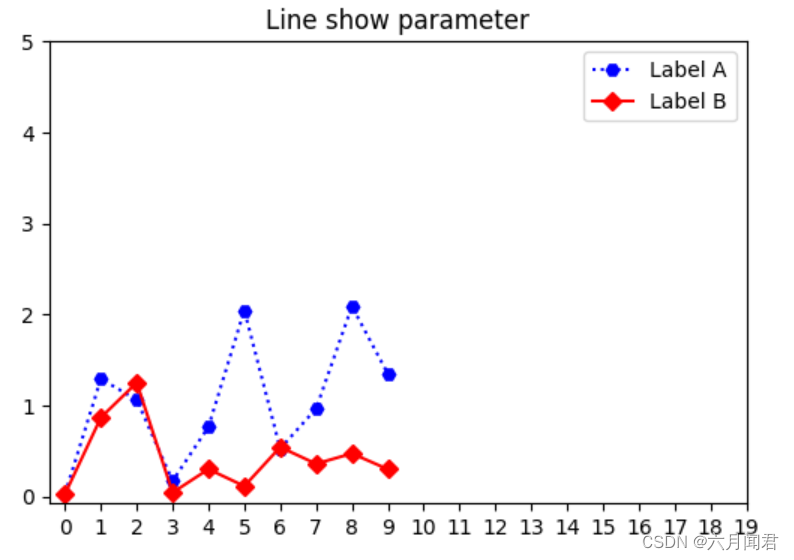
xticks=range(20) x轴20单位
yticks=range(6) y轴6单位
import matplotlib.pyplot as plt
import pandas as pd
import numpy as np

df = pd.DataFrame(abs(np.random.randn(10,2)), columns=['A','B'])
df.A.plot.line(style= ':',marker='H',color='b',figsize=(6,4),label='Label A',title='Line show parameter')
df.B.plot.line(style= '-',marker='D',color='r',label='Label B',xticks=range(20),yticks=range(6))
plt.legend(loc='upper right')
plt.show()
table=True 设置使用表格
fontsize=12 字符大小
marker=‘H’ 不支持list,如 [‘H’,‘D’] ,只能是一个marker , 需要分别series去分别设置marker 才能有效。
import matplotlib.pyplot as plt
import pandas as pd
import numpy as np

df = pd.DataFrame(abs(np.random.randn(10,2)), columns=['A','B'])
df.plot.line(style= [':','-.'],marker='H',color=['r','b'],table=True,fontsize=12,title='Line show parameter')
plt.legend(loc='upper right')
plt.show()

1.4 子图
df = pd.DataFrame(abs(np.random.randn(10,4)), columns=['A','B','C','D'])
df.plot(subplots=True, figsize=(5, 4))
plt.show()
figsize=(5, 4) 整体图示大小,即4个子图的整体大小。
效果如下:

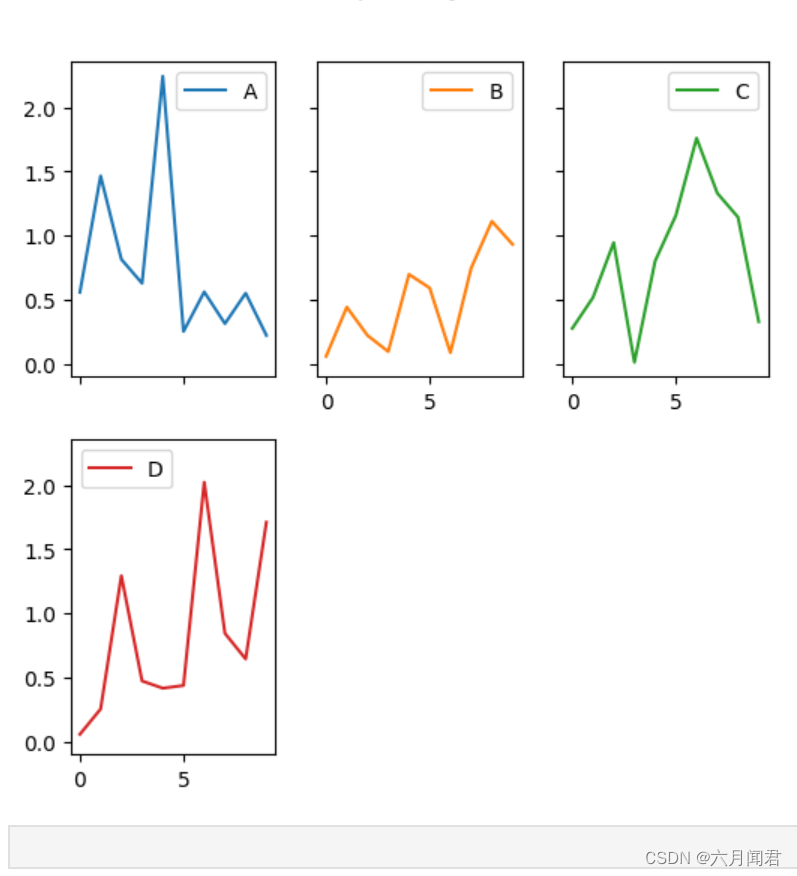
df.plot(subplots=True, layout=(2, 3), figsize=(6, 6), sharex=True,sharey=True)
plt.show()
layout=(2, 3) 子图排列,两行,每列三个
sharex=True 共享X轴,第一列,只有一个X轴标签
sharey=True 共享Y轴 ,第一行,只有一个Y轴标签
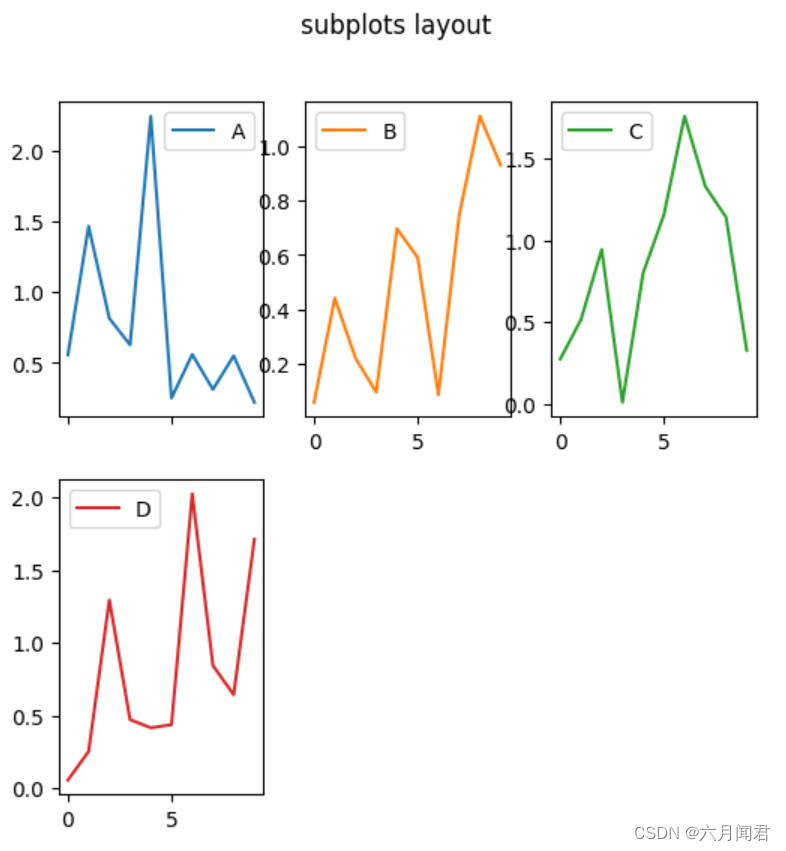
对比一下,不共享XY轴的情况,不共享是默认值。
每个子图都有XY轴的标签。
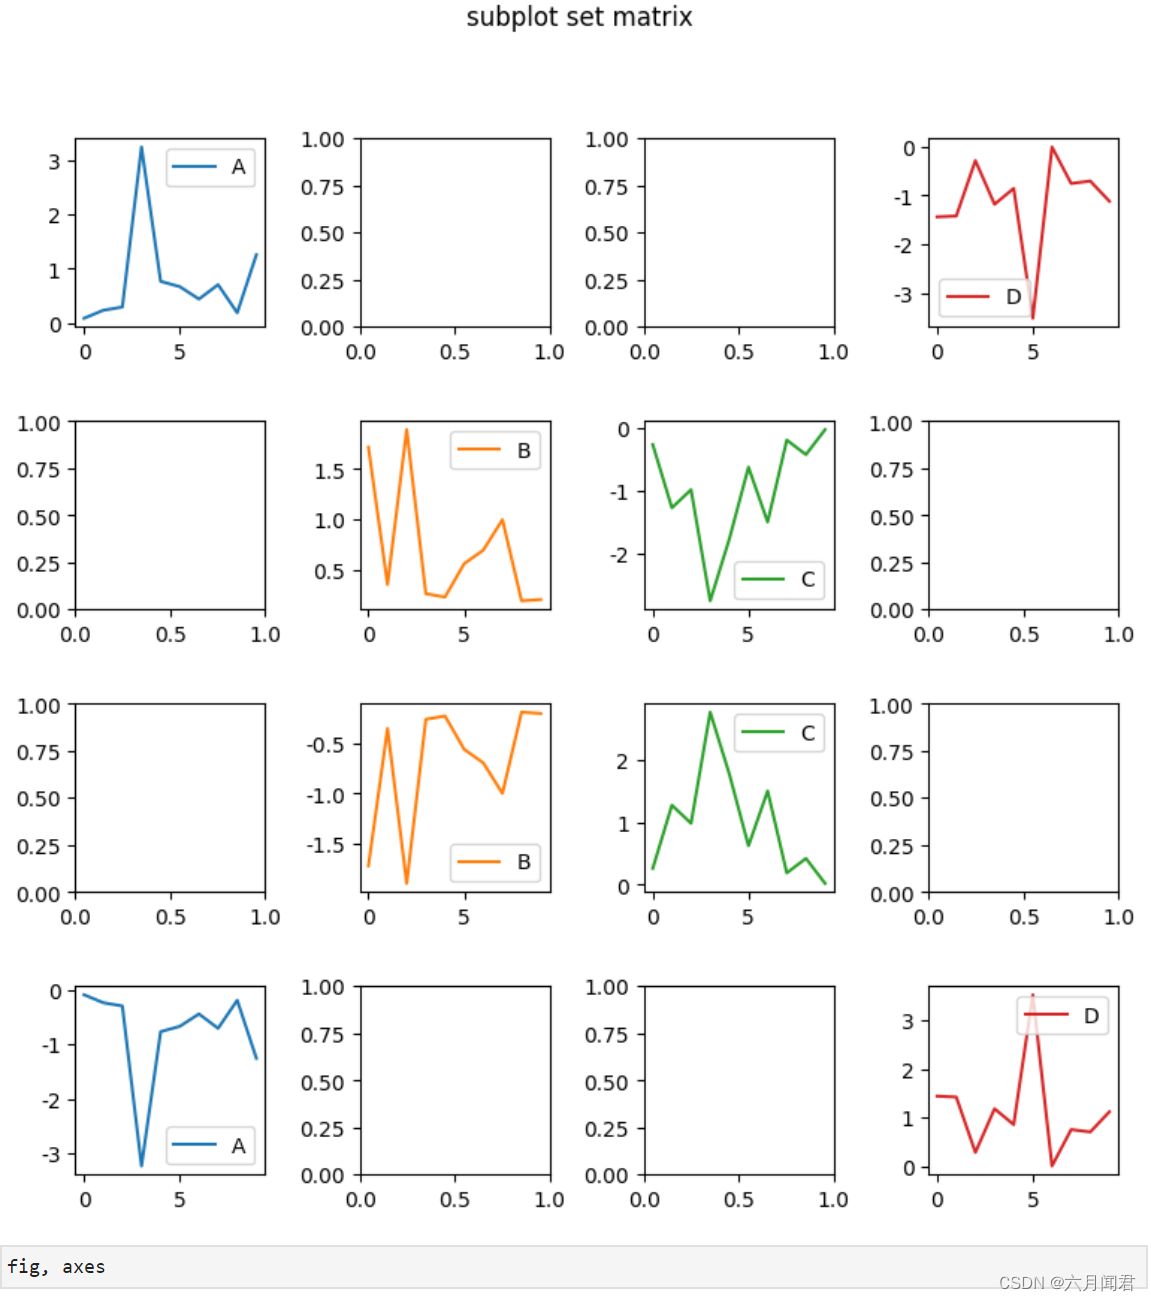
1.5 复杂子图
df = pd.DataFrame(abs(np.random.randn(10,4)), columns=['A','B','C','D'])
fig, axes = plt.subplots(4, 4, figsize=(9, 9))  # 图示9*9大小,4行4列
plt.subplots_adjust(wspace=0.5, hspace=0.5) #水平和垂直间距
target1 = [axes[0][0], axes[1][1], axes[2][2], axes[3][3]] # 有图的矩阵位置
target2 = [axes[3][0], axes[2][1], axes[1][2], axes[0][3]] # 有图的矩阵位置
#df和df*-1 ,两个dataframe ,分别对应到子图矩阵中的位置,对比A两个的图示
df.plot(subplots=True, ax=target1, legend=True, sharex=False, sharey=False);
(-df).plot(subplots=True, ax=target2, legend=True, sharex=False, sharey=False,title='subplot set matrix');
plt.show()
效果如下:
