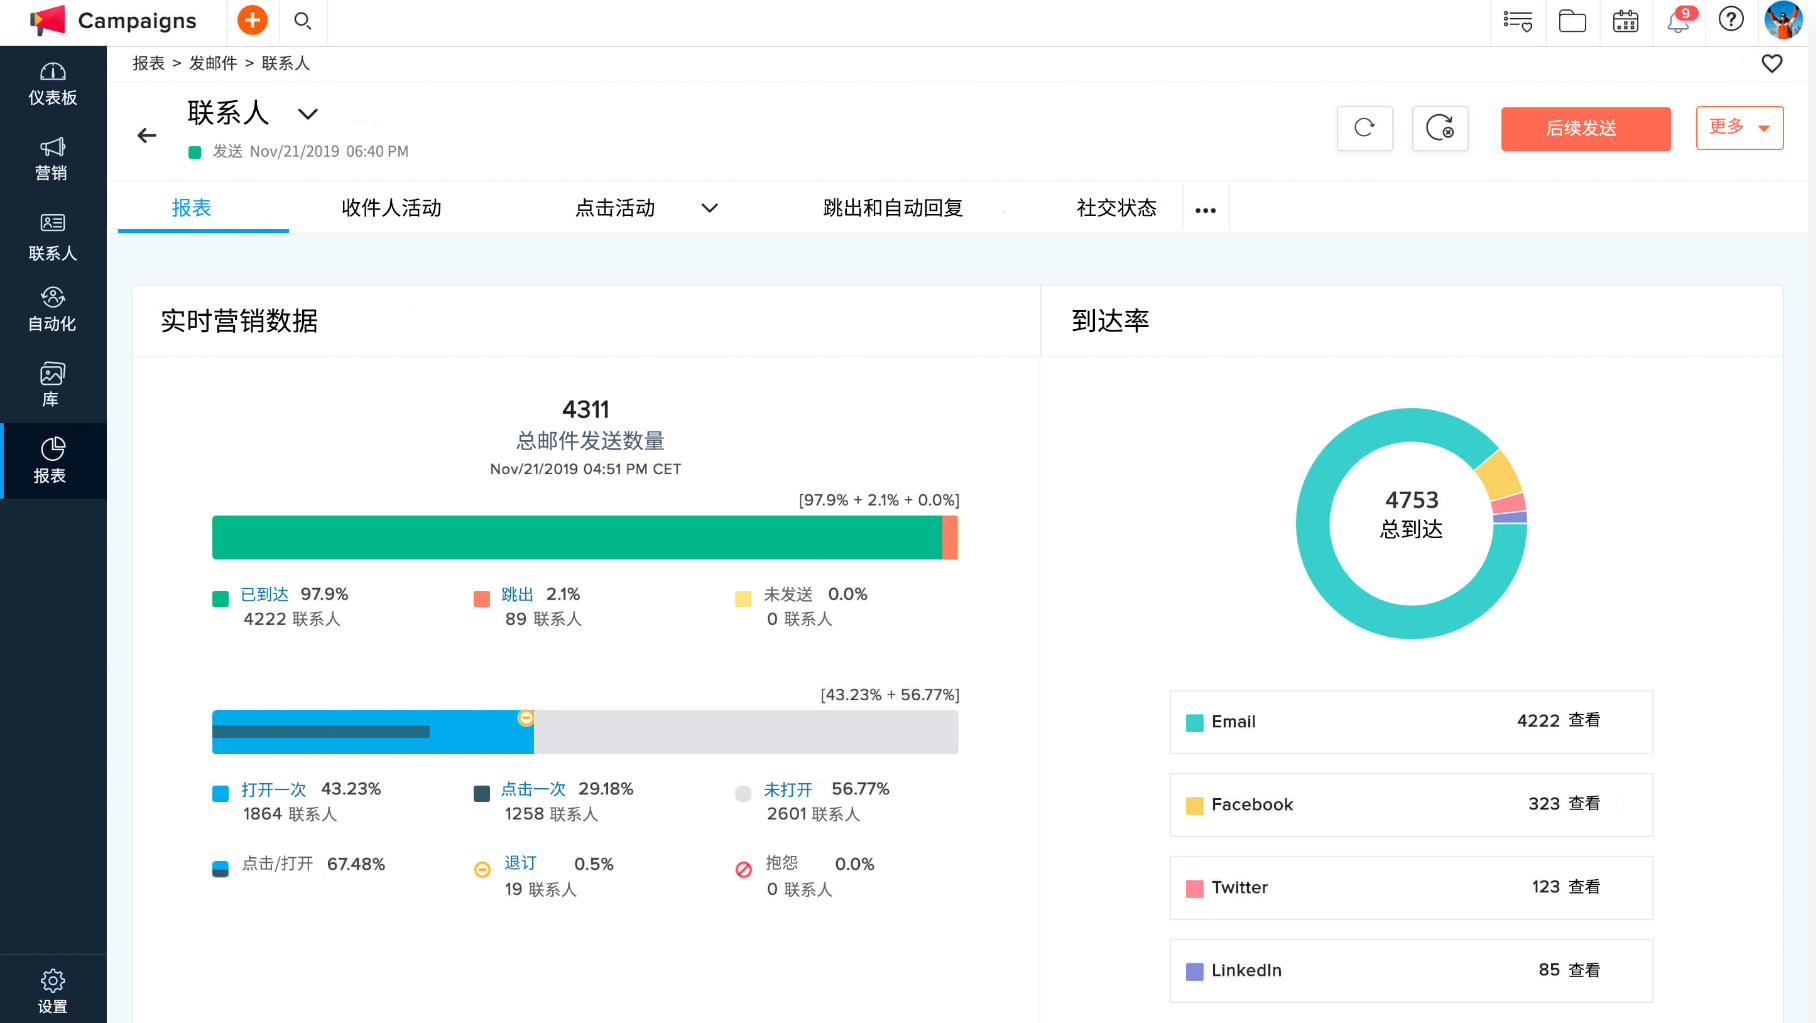
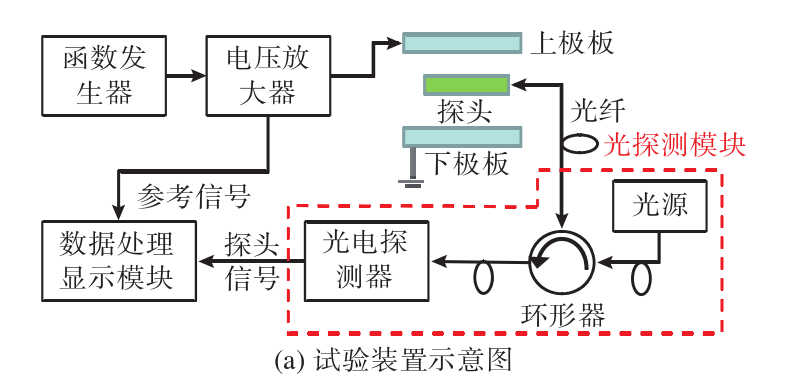
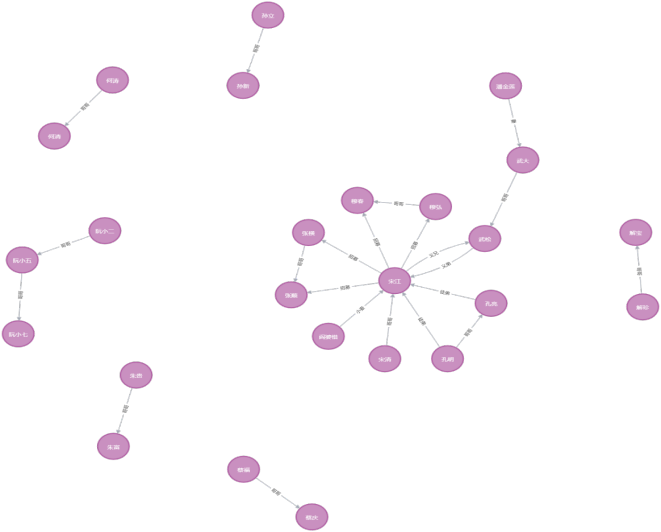
先看效果:

再看代码(部分):
     let barOption = {

        baseOption: {

          height: 350,
          timeline: {

            x: 'center',//时间轴X轴方向位置设置
            y: 'bottom',//时间轴Y轴方向位置设置
            width: '80%',//宽度
            height: 50,//高度
            show:true,
            axisType: 'category',
            autoPlay: true,
            playInterval: 1000,
            data: ['Email', 'Union Ads', 'Video Ads', 'Direct', 'Search Engine'],
            label: {

              formatter: function (s) {

                return s;
              }
            }
          },
          title: {

            text: 'Stacked Line'
          },
          tooltip: {

            trigger: 'axis'
          },
          legend: {

            data: ['Email', 'Union Ads', 'Video Ads', 'Direct', 'Search Engine']
          },
          grid: {

            left: '3%',
            right: '4%',
            bottom: '3%',
            containLabel: true
          },
          toolbox: {

            feature: {

              saveAsImage: {
   }
            }
          },
          xAxis: {

            type: 'category',
            boundaryGap: false,
            data:  ['Mon', 'Tue', 'Wed', 'Thu', 'Fri', 'Sat', 'Sun']
          },
          yAxis: {

            type: 'value',
            name: '太阳总辐射(MJ/m2)',
            min: 0,
            axisLabel: {

              formatter: '{value}'
            },
            splitArea: {

              show: false, // 是否显示分隔区域
            },
            axisLine: {

              show: true,    // 是否显示坐标轴轴线
              lineStyle: {

                color:'#91CC75',   // 坐标轴线线的颜色
                width: '1',    // 坐标轴线线宽
                type: 'solid',    // 坐标轴线线的类型(solid实线类型;dashed虚线类型;dotted点状类型)
              },
            },
            axisTick: {

              show: true,    // 是否显示坐标轴刻度
              alignWithLabel: true,   //设置x轴刻度线与x轴文字对齐的
              lineStyle: {

                width: 1,    // 坐标轴刻度线宽
                type: 'solid',    // 坐标轴线线的类
