1 漏斗图
漏斗图描述状态阶段的顺序递进关系,属于序列类图表
import plotly.express as px

data = dict(
    number=[39, 27.4, 20.6, 11, 2],
    stage=["Website visit", "Downloads", "Potential customers", "Requested price", "invoice sent"]
)

fig = px.funnel(data, x='number', y='stage')
fig.show()
from pyecharts import options as opts
from pyecharts.charts import Funnel

data = [135043, 113413, 74909, 10366, 9018, 4151]
phase = ['总访客数量', '活跃访客数量', '注册用户数量', '预定用户数量', '支付用户数量', '复购用户数量']

c = (
    Funnel()
    .add("阶段", [list(z) for z in zip(phase, data)])
    .set_global_opts(title_opts=opts.TitleOpts(title="漏斗图"))
    .render("funnel.html")
)


2 桑葚图
桑基图(Sankey diagram),即桑基能量分流图,也叫桑基能量平衡图。它是一种特定类型的流程图,图中延伸的分支的宽度对应数据流量的大小。
-
主要由节点、边和流量三要素构成,边越宽代表流量越大
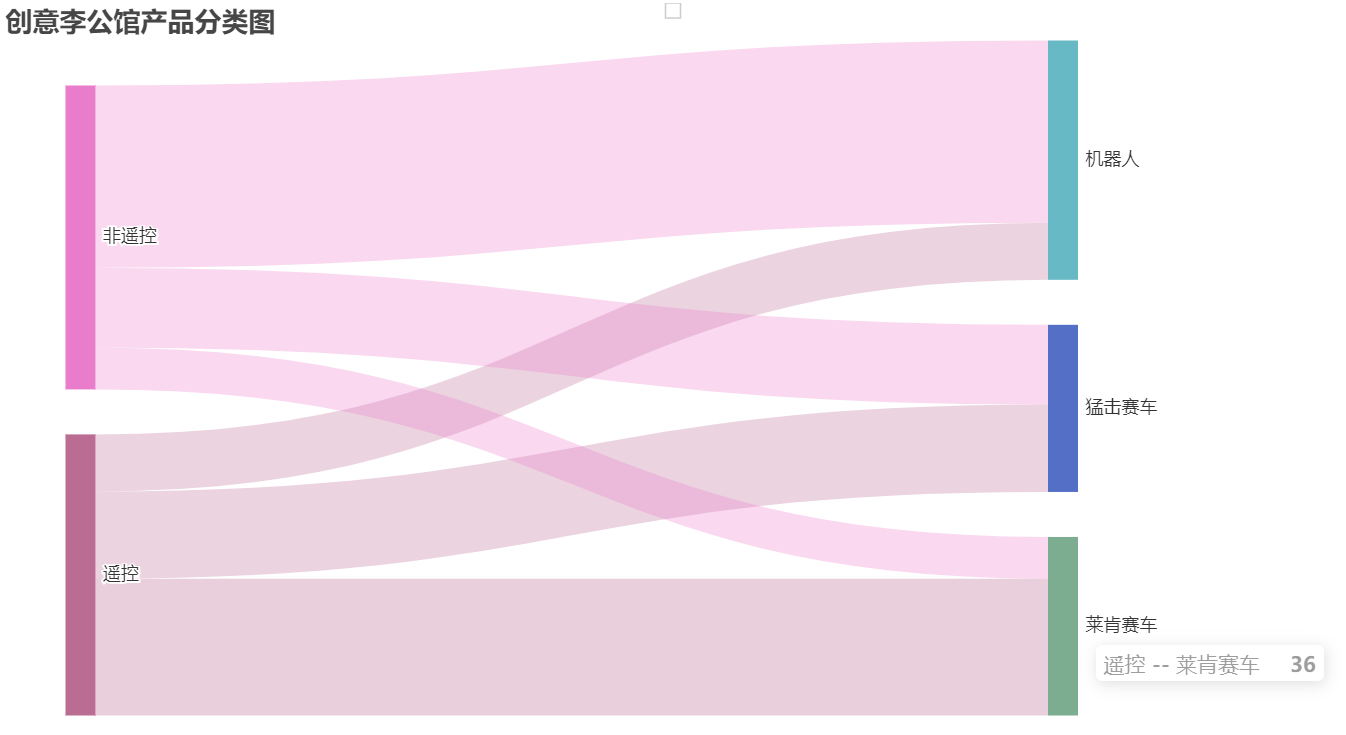
import pandas as pd

df = pd.DataFrame({
    '类型': ['遥控', '遥控', '遥控', '非遥控', '非遥控', '非遥控'],
    '产品名称': ['机器人', '猛击赛车', '莱肯赛车', '机器人', '猛击赛车', '莱肯赛车'],
    '数量': [15, 23, 36, 48, 21, 11]
})
print(df)

nodes = []
for i in range(2):
    vales = df.iloc[:, i].unique()
    for value in vales:
        dic = {'name': value}
        nodes.append(dic)
print(nodes)

linkes = []
for i in df.values:
    dic = {'source': i[0], 'target': i[1], 'value': i[2]}
    linkes.append(dic)

from pyecharts.charts import Sankey
from pyecharts import options as opts

pic = (
    Sankey().add(
        '',  # 图例名称
        nodes,  # 传入节点数据
        linkes,  # 传入边和流量数据
        # 设置透明度、弯曲度、颜色
        linestyle_opt=opts.LineStyleOpts(opacity=0.3, curve=0.5, color='source'),
        # 标签显示位置
        label_opts=opts.LabelOpts(position='right'),
        # 节点之间的距离
        node_gap=30,
    )
    .set_global_opts(title_opts=opts.TitleOpts(title='创意李公馆产品分类图'))
)
pic.render('test.html')
