1 逻辑
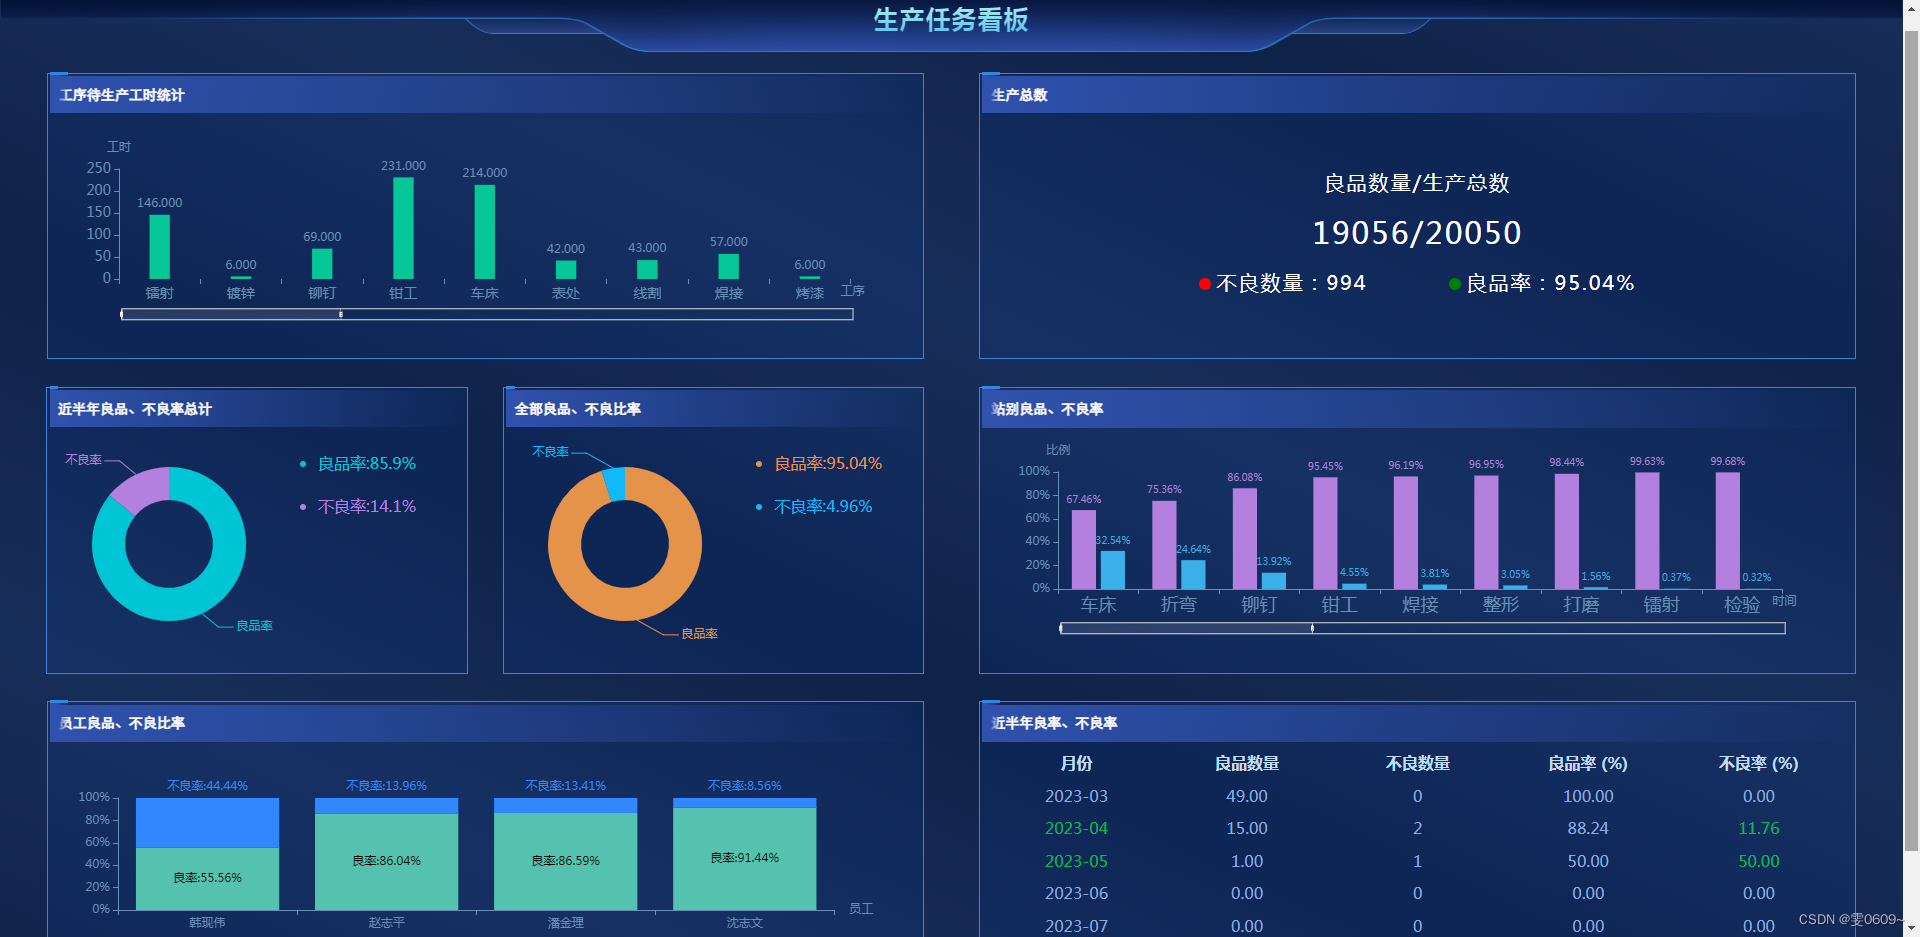
给指定的series两个对象
两个对象有相同的xAxisIndex: 2,yAxisIndex: 2,
不同的data
{
          name: "",
          type: "line",
          data: data1,
          xAxisIndex: 2,
          yAxisIndex: 2,
        },

        {
          name: "",
          type: "bar",
          data: data2,
          xAxisIndex: 2,
          yAxisIndex: 2,
        },
2 代码 html 代码 -> vscode 保存为html文件 F5运行
<!DOCTYPE html>
<html>
<head>
  <meta charset="UTF-8">
  <title>echarts example - Custom bar category</title>
  <script src="https://cdn.jsdelivr.net/npm/echarts@4.9.0/dist/echarts.min.js"></script>
  <style>
    html,body {
      height: 100%;
      margin: 0;
    }
    #chart {
      height: 600px;
    }
  </style>
</head>
<body>
  <div id="chart"></div>
  <script>
    // 数据
    let data = [
      ['2020/1/1', 247.75, 246.23, 248.73, 245.30],
      ['2020/1/2', 248.80, 247.32, 248.96, 246.37],
      ['2020/1/3', 253.11, 249.06, 253.11, 247.42],
      ['2020/1/4', 252.29, 249.63, 253.60, 249.05],
      ['2020/1/5', 251.23, 249.71, 252.59, 249.06],
      ['2020/1/6', 252.68, 249.36, 254.09, 249.20],
      ['2020/1/7', 254.39, 251.34, 254.67, 251.17],
      ['2020/1/8', 253.33, 250.53, 254.82, 249.85],
      ['2020/1/9', 253.87, 252.44, 254.30, 250.87],
      ['2020/1/10', 255.31, 253.31, 255.60, 252.90],
      ['2020/1/11', 255.99, 253.08, 256.65, 252.30],
      ['2020/1/12', 256.11, 251.15, 256.48, 251.02],
      ['2020/1/13', 255.38, 253.64, 255.75, 253.02],
      ['2020/1/14', 260.28, 256.36, 260.42, 256.18],
      ['2020/1/15', 262.10, 258.35, 262.15, 257.27],
      ['2020/1/16', 263.31, 261.25, 263.61, 259.96],
      ['2020/1/17', 262.99, 261.54, 264.47, 261.07],
      ['2020/1/18', 263.12, 259.03, 263.48, 258.40],
      ['2020/1/19', 263.23, 259.82, 263.63, 258.69],
      ['2020/1/20', 262.10, 261.43, 262.48, 259.51],
    ];

    // 计算 MACD 指标的函数
    function calculateMACD(data) {
      let SHORT = 12;
      let LONG = 26;
      let M = 9;
      let DIFF = 0;
      let DEA = 0;
      let MACD = 0;

      let emaShort = 0;
      let emaLong = 0;
      let emaDiff = 0;

      let macdData = [];
      let diffData = [];
      let deaData = [];

      for (let i = 0; i < data.length; i++) {
        let close = data[i][1];

        if (i === 0) {
          emaShort = close;
          emaLong = close;
        } else {
          emaShort = (2 * close + (SHORT - 1) * emaShort) / (SHORT + 1);
          emaLong = (2 * close + (LONG - 1) * emaLong) / (LONG + 1);
        }

        emaDiff = emaShort - emaLong;
        diffData.push(emaDiff.toFixed(2));

        if (i === 0) {
          DIFF = emaDiff;
        } else {
          DIFF = (emaDiff * 2 + (SHORT - 1) * DIFF) / (SHORT + 1);
        }

        if (i === 0) {
          DEA = DIFF;
        } else {
          DEA = (DIFF * 2 + (M - 1) * DEA) / (M + 1);
        }

        MACD = (DIFF - DEA) * 2;
        macdData.push(MACD.toFixed(2));
        deaData.push(DEA.toFixed(2));
      }

      return {
        macdData,
        diffData,
        deaData
      };
    }

    // 计算 MACD 指标
    let macdObj = calculateMACD(data);

    // 配置项
    let option = {
      title: {
        text: '股票 K 线图及 MACD 指标图'
      },
      tooltip: {
        trigger: 'axis',
        axisPointer: {
          type: 'cross',
          crossStyle: {
            color: '#999'
          }
        }
      },
      legend: {
        data: ['日K', 'MACD', 'DIFF', 'DEA']
      },
      grid: [
        {
          left: 80,
          right: 80,
          top: 20,
          height: 320
        },
        {
          left: 80,
          right: 80,
          top: 380,
          height: 100
        }
      ],
      xAxis: [
        {
          type: 'category',
          data: data.map(item => item[0]),
          axisPointer: {
            type: 'shadow'
          }
        }
      ],
      yAxis: [
        {
          type: 'value',
          name: '日K',
          scale: true,
          splitArea: {
            show: true
          }
        },
        {
          type: 'value',
          name: 'MACD',
          position: 'right',
          offset: 80,
          axisLine: {
            show: false
          },
          axisTick: {
            show: false
          },
          splitLine: {
            show: false
          },
          axisPointer: {
            show: false
          }
        }
      ],
      series: [
        {
          name: '日K',
          type: 'candlestick',
          data: data,
          itemStyle: {
            color: '#FD1050',
            color0: '#0CF49B',
            borderColor: '#FD1050',
            borderColor0: '#0CF49B'
          }
        },
        {
          name: 'MACD',
          type: 'bar',
          xAxisIndex: 0,
          yAxisIndex: 1,
          data: macdObj.macdData,
          itemStyle: {
            color: '#FFAE57'
          }
        },
        {
          name: 'DIFF',
          type: 'line',
          xAxisIndex: 0,
          yAxisIndex: 1,
          showSymbol: false,
          data: macdObj.diffData,
          itemStyle: {
            color: '#FFC069'
          }
        },
        {
          name: 'DEA',
          type: 'line',
          xAxisIndex: 0,
          yAxisIndex: 1,
          showSymbol: false,
          data: macdObj.deaData,
          itemStyle: {
            color: '#722ED1'
          }
        }
      ]
    };

    // 画图
    let chart = echarts.init(document.getElementById('chart'));
    chart.setOption(option);
  </script>
</body>
</html>
3 代码测试网站
https://codepen.io/pen/?&editable=true&editors=101%2C111%2C110%2C115%2C114%2C112%2C113%2C109


![[oneAPI] 手写数字识别-VAE](https://img-blog.csdnimg.cn/6adeb56f69d64b58b8500377f5b0850a.png)


