效果: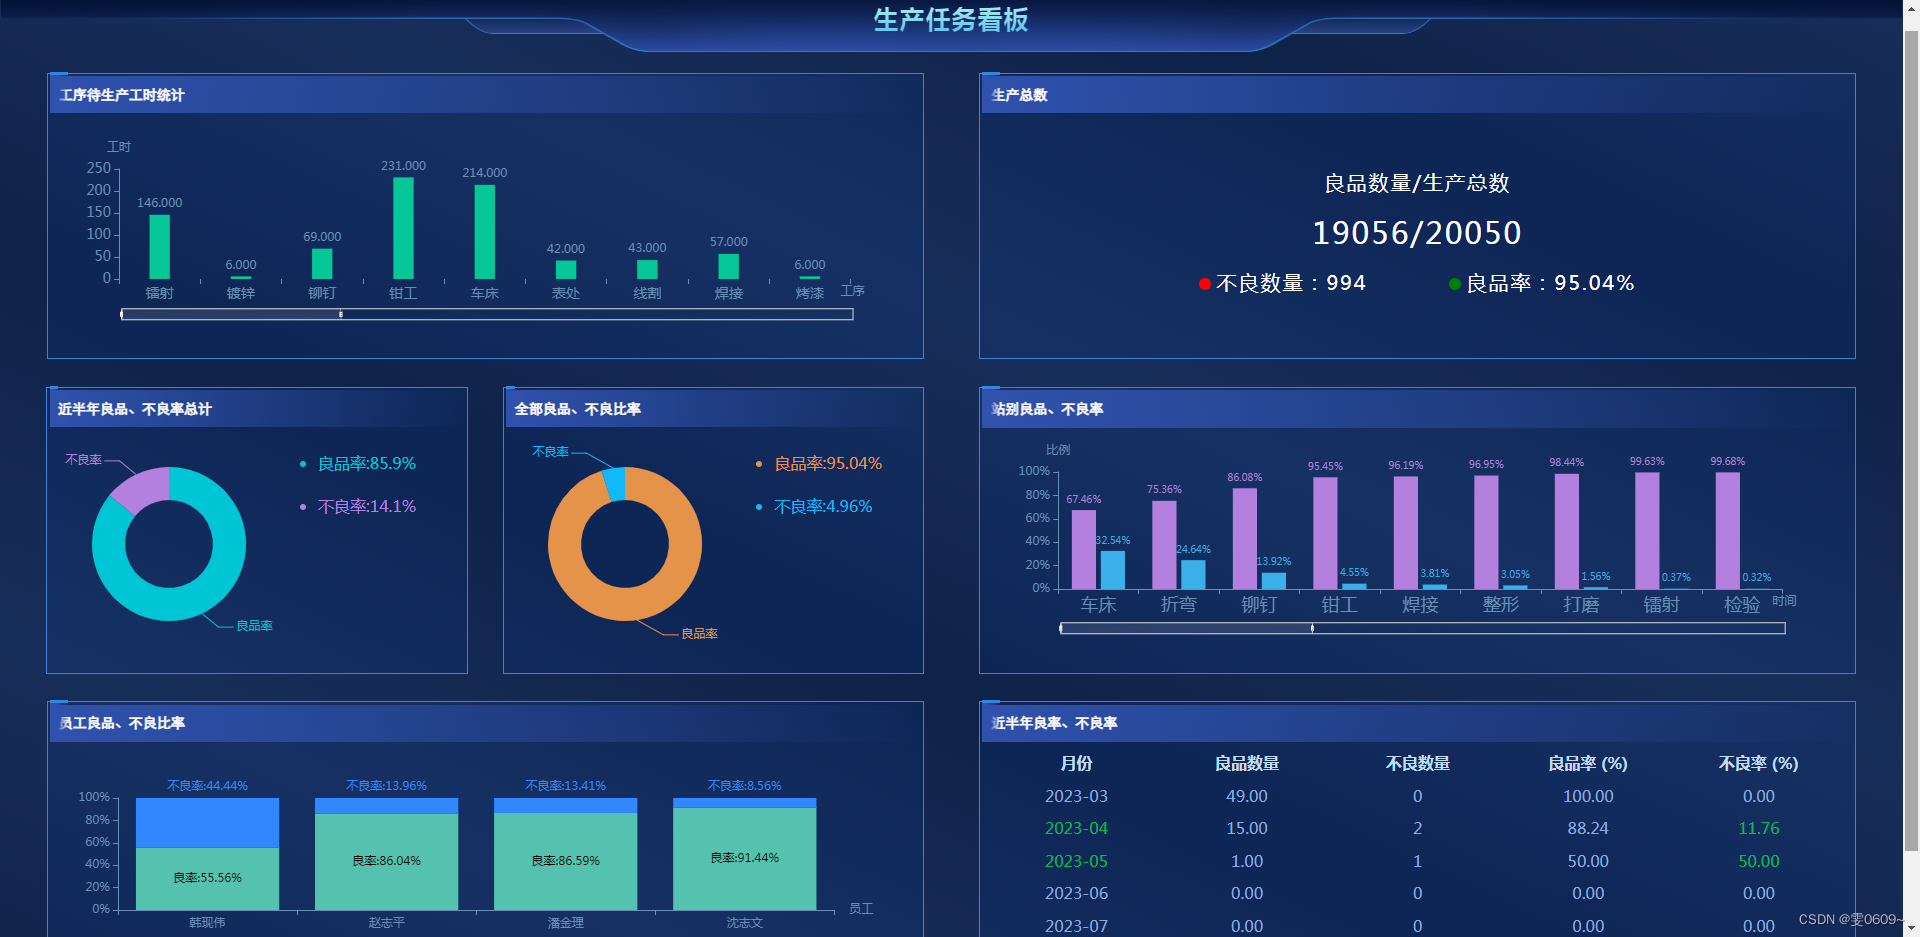
代码:
php
<?php
include('includes/session.inc');
include('includes/SQL_CommonFunctions.inc');
?>
<!DOCTYPE html>
<html lang="en">
<head>
<meta charset="UTF-8">
<meta http-equiv="X-UA-Compatible" content="IE=edge">
<meta name="viewport" content="width=device-width, initial-scale=1.0">
<link rel="stylesheet" href="css/e-kanban/index.css">
<script src="./js/jquery-2.1.0.js" type="text/javascript"></script>
<script src="./js/echarts.js" type="text/javascript"></script>
<title>电子看板</title>
</head>
<body>
<div class="head">
<h1 class="all_title">生产任务看板</h1>
</div>
<div class="kanban_all">
<div class="kanban_all_position">
<div class="kanban_item">
<div class="kanban_line">
<div class="kanban_title">
工序待生产工时统计
</div>
<div class="kanban_content">
<table>
<tr>
<td>
<div id="poruku" style="width:100%;height:220px;"></div>
</td>
<td>
<div style="width: 30px; height:220px;"></div>
</td>
</tr>
</table>
</div>
</div>
</div>
<div class="kanban_item">
<div class="kanban_line">
<div class="kanban_title">
生产总数
</div>
<div class="kanban_content">
<div class="quantity_show">
<div class="quantity_show_position">
<div class="quantity_line1">良品数量/生产总数</div>
<div class="quantity_line2"><span id="all_good_quantity"></span>/<span id="all_quantity"></span></div>
<div class="quantity_line3">
<ul>
<li style="color:red"><span>不良数量:</span><span id="all_bad_quantity"></span></li>
<li style="color:green"><span>良品率:</span><span id="all_good_rate1"></span></li>
</ul>
</div>
</div>
</div>
</div>
</div>
</div>
<div class="kanban_item">
<div class="kanban_line_double">
<div class="left">
<div class="kanban_line">
<div class="kanban_title">
近半年良品、不良率总计
</div>
<div class="kanban_content">
<div class="kanban_content_left">
<table>
<tr>
<td>
<div id="poruku2" style="width:100%;height:220px;"></div>
</td>
<td>
<div style="width: 30px; height:220px;"></div>
</td>
</tr>
</table>
</div>
<div class="kanban_content_right">
<div>
<ul>
<li style="color:#00c5d4">良品率:<span id="halfyear_good_rate"></span></li>
<li style="color:#b381dd">不良率:<span id="halfyear_bad_rate"></span></li>
</ul>
</div>
</div>
</div>
</div>
</div>
<div class="middle"></div>
<div class="right">
<div class="kanban_line">
<div class="kanban_title">
全部良品、不良比率
</div>
<div class="kanban_content">
<div class="kanban_content_left">
<table>
<tr>
<td>
<div id="poruku3" style="width:100%;height:220px;"></div>
</td>
<td>
<div style="width: 30px; height:220px;"></div>
</td>
</tr>
</table>
</div>
<div class="kanban_content_right">
<div>
<ul>
<li style="color:#e5924b">良品率:<span id="all_good_rate"></span></li>
<li style="color:#10baf8">不良率:<span id="all_bad_rate"></span></li>
</ul>
</div>
</div>
</div>
</div>
</div>
</div>
</div>
<div class="kanban_item">
<div class="kanban_line">
<div class="kanban_title">
站别良品、不良率
</div>
<div class="kanban_content">
<table>
<tr>
<td>
<div id="poruku1" style="width:100%;height:220px;"></div>
</td>
<td>
<div style="width: 30px; height:220px;"></div>
</td>
</tr>
</table>
</div>
</div>
</div>
<div class="kanban_item">
<div class="kanban_line">
<div class="kanban_title">
员工良品、不良比率
</div>
<div class="kanban_content">
<table>
<tr>
<td>
<div id="poruku4" style="width:100%;height:220px;"></div>
</td>
<td>
<div style="width: 30px; height:220px;"></div>
</td>
</tr>
</table>
</div>
</div>
</div>
<div class="kanban_item">
<div class="kanban_line">
<div class="kanban_title">
近半年良率、不良率
</div>
<div class="kanban_content">
<?php
$sql5 = "SELECT
months.month,
SUM(IFNULL(transaction_quantity, 0)) AS total_transaction_quantity,
SUM(IFNULL(bad_quantity, 0)) AS total_bad_quantity,
CASE
WHEN (SUM(IFNULL(transaction_quantity, 0)) + SUM(IFNULL(bad_quantity, 0))) = 0 THEN 0
ELSE ROUND((SUM(IFNULL(transaction_quantity, 0)) / (SUM(IFNULL(transaction_quantity, 0)) + SUM(IFNULL(bad_quantity, 0)))*100), 2)
END AS good_rate,
CASE
WHEN (SUM(IFNULL(transaction_quantity, 0)) + SUM(IFNULL(bad_quantity, 0))) = 0 THEN 0
ELSE ROUND((SUM(IFNULL(bad_quantity, 0)) / (SUM(IFNULL(transaction_quantity, 0)) + SUM(IFNULL(bad_quantity, 0)))*100), 2)
END AS bad_rate
FROM
(
SELECT DATE_FORMAT(DATE_SUB(LAST_DAY(CURDATE()), INTERVAL n.num MONTH), '%Y-%m') AS month
FROM (SELECT 0 AS num UNION ALL SELECT 1 UNION ALL SELECT 2 UNION ALL SELECT 3 UNION ALL SELECT 4 UNION ALL SELECT 5) n
) months
LEFT JOIN wip_transactions ON DATE_FORMAT(FROM_UNIXTIME(transaction_date), '%Y-%m') = months.month
GROUP BY
months.month
ORDER BY
months.month ASC";
$result5 = DB_query($sql5, $db);
// 检查查询是否成功
if ($result5) {
// 检查查询结果是否为空
if (mysqli_num_rows($result5) > 0) {
?>
<table class="table">
<tr>
<th>月份</th>
<th>良品数量</th>
<th>不良数量</th>
<th>良品率 (%)</th>
<th>不良率 (%)</th>
</tr>
<?php
while ($row = mysqli_fetch_assoc($result5)) {
?>
<tr>
<?php if ($row['bad_rate'] != 0) : ?>
<td style="color: #05bc4e;"><?php echo $row['month']; ?></td>
<?php else : ?>
<td><?php echo $row['month']; ?></td>
<?php endif; ?>
<td><?php echo $row['total_transaction_quantity']; ?></td>
<td><?php echo $row['total_bad_quantity']; ?></td>
<td><?php echo $row['good_rate']; ?></td>
<?php if ($row['bad_rate'] != 0) : ?>
<td style="color: #05bc4e;"><?php echo $row['bad_rate']; ?></td>
<?php else : ?>
<td><?php echo $row['bad_rate']; ?></td>
<?php endif; ?>
</tr>
<?php
}
?>
</table>
<?php
} else {
echo "No results found.";
}
} else {
echo "Query failed.";
}
?>
</div>
</div>
</div>
</div>
</body>
</html>
<?php
//按站别分的良率和不良率
$sql1 = "SELECT
operation_code,
SUM(IFNULL(transaction_quantity, 0)) AS total_transaction_quantity,
SUM(IFNULL(bad_quantity, 0)) AS total_bad_quantity,
CASE
WHEN (SUM(IFNULL(transaction_quantity, 0)) + SUM(IFNULL(bad_quantity, 0))) = 0 THEN 0
ELSE ROUND((SUM(IFNULL(transaction_quantity, 0)) / (SUM(IFNULL(transaction_quantity, 0)) + SUM(IFNULL(bad_quantity, 0)))*100), 2)
END AS good_rate,
CASE
WHEN (SUM(IFNULL(transaction_quantity, 0)) + SUM(IFNULL(bad_quantity, 0))) = 0 THEN 0
ELSE ROUND((SUM(IFNULL(bad_quantity, 0)) / (SUM(IFNULL(transaction_quantity, 0)) + SUM(IFNULL(bad_quantity, 0)))*100), 2)
END AS bad_rate
FROM wip_transactions
GROUP BY operation_code
ORDER BY bad_rate desc
";
$result1 = DB_query($sql1, $db);
while ($array1 = mysqli_fetch_assoc($result1)) {
$arrays1[] = $array1;
}
if (is_array($arrays1)) {
foreach ($arrays1 as $key => $value) {
$goodnum1[] = $value['total_transaction_quantity'];
$badnum1[] = $value['total_bad_quantity'];
$arr_good_quantity1[] = $value['good_rate'];
$arr_bad_quantity1[] = $value['bad_rate'];
$arrvendor1[] = $value['operation_code'];
}
} else {
$goodnum1[] = 0;
$badnum1[] = 0;
$arr_good_quantity1[] = 0;
$arr_bad_quantity1[] = 0;
$arrvendor1[] = 0;
}
echo "<script>";
echo "; var goodnum1 = ";
echo json_encode($goodnum1);
echo "; var badnum1 = ";
echo json_encode($badnum1);
echo "; var good_rate1 = ";
echo json_encode($arr_good_quantity1);
echo "; var bad_rate1 = ";
echo json_encode($arr_bad_quantity1);
echo "; var x1 = ";
echo json_encode($arrvendor1);
echo ";
var ydata = []
var myChart1 = echarts.init(document.getElementById('poruku1'));
option1 = {
//滚动显示
dataZoom: [{
type: 'slider', // 滑动条型式的dataZoom组件
show: true, // 显示dataZoom组件
start: 0, // 默认数据窗口范围的起始位置为0
end: 30, // 默认数据窗口范围的结束位置为30
xAxisIndex: [0], // 设置dataZoom组件影响的x轴索引,默认为第一个x轴
filterMode: 'filter', // 数据窗口范围的定义模式为filter过滤模式
height: 12, // 设置滑动条型式的高度为20像素
textStyle: {
color: 'white' // 设置文字颜色为白色
},
handleStyle: {
color: 'white' // 设置滚动条手柄的颜色为红色
},
fillerColor: 'rgba(255, 255, 255, 0.1)', // 设置滚动条选中区域的颜色为蓝色
},
{
type: 'inside', // 内置型式的dataZoom组件
start: 0, // 默认数据窗口范围的起始位置为0
end: 30, // 默认数据窗口范围的结束位置为30
xAxisIndex: [0], // 设置dataZoom组件影响的x轴索引,默认为第一个x轴
filterMode: 'filter', // 数据窗口范围的定义模式为filter过滤模式
height: 12
}],
//图形颜色
color: ['#b381dd','#3aafe8'],
//提示框,鼠标悬停在图形上的注解
tooltip: {
trigger: 'axis',
axisPointer: { // 坐标轴指示器,坐标轴触发有效
type: 'line' // 默认为直线,可选为:'line' | 'shadow'
},
formatter: function(params) {
var index = params[0].dataIndex;
var goodnum = goodnum1[index];
var badnum = badnum1[index];
var goodrate = params[0].value;
var badrate = params[1].value;
return '良品数量:' + goodnum + '<br>' +
'不良数量:' + badnum + '<br>' +
'良品率:' + goodrate + '%' + '<br>' +
'不良率:' + badrate + '%';
}
},
//配置网格组件,用于定义图表的位置和大小
grid: {
top: '15%', // 增加top的值来创建间距
left: '3%',
right: '3%',
bottom: '20%', // 增加bottom的值来创建间距
containLabel: true, //自动计算并包含坐标轴标签、刻度和标题等内容在内。
},
//横坐标
xAxis: {
name: '时间',
nameTextStyle: {
padding: [0, 0, -25, -25] // 横坐标名称与原位置的边距
},
type: 'category', //横坐标数据类型为类别型,适用于离散的数据
data: x1, //设置横坐标的数据,使用变量x1中的数据。
axisLine: {
lineStyle: {
color: '#6691b5' // 设置 x 坐标轴线的颜色
}
},
axisLabel: {
interval: 0, // 设置横坐标刻度的显示间隔,默认为0表示全部显示
// 如果刻度标签太长,可以使用rotate进行旋转
textStyle: {
fontSize: 18
}
},
},
//比例
yAxis: [
{
name: '比例',
type: 'value', //数据类型为数值型。
axisLabel: {
formatter: '{value}%'
},
splitLine: {
show: false // 隐藏纵坐标轴的背景横线
},
axisLine: {
lineStyle: {
color: '#6691b5' // 设置 x 坐标轴线的颜色为红色
}
},
},
],
series: [
{
name:'良品率',
type: 'bar',
data: good_rate1,
barWidth: '30%', // 设置柱状图的宽度为整个类目宽度的40%
barGap: '20%', // 设置柱状图之间的间距为整个类目宽度的20%
itemStyle: {
normal: {
label: {
show: true,
position: 'top',
formatter: '{c}%',
textStyle: {
color: '#b381dd',
fontSize: 10
}
}
}
}
},
{
name:'不良率',
type: 'bar',
data: bad_rate1,
barWidth: '30%', // 设置柱状图的宽度为整个类目宽度的40%
barGap: '20%', // 设置柱状图之间的间距为整个类目宽度的20%
itemStyle: {
normal: {
label: {
show: true,
position: 'top',
formatter: '{c}%',
textStyle: {
color: '#3aafe8',
fontSize: 10
}
}
}
}
}
]
};
myChart1.setOption(option1);
</script>";
//计算机半年内的总良品和不良
$sql2 = "SELECT
SUM(IFNULL(transaction_quantity, 0)) AS total_transaction_quantity,
SUM(IFNULL(bad_quantity, 0)) AS total_bad_quantity,
CASE
WHEN (SUM(IFNULL(transaction_quantity, 0)) + SUM(IFNULL(bad_quantity, 0))) = 0 THEN 0
ELSE ROUND((SUM(IFNULL(transaction_quantity, 0)) / (SUM(IFNULL(transaction_quantity, 0)) + SUM(IFNULL(bad_quantity, 0)))*100), 2)
END AS good_rate,
CASE
WHEN (SUM(IFNULL(transaction_quantity, 0)) + SUM(IFNULL(bad_quantity, 0))) = 0 THEN 0
ELSE ROUND((SUM(IFNULL(bad_quantity, 0)) / (SUM(IFNULL(transaction_quantity, 0)) + SUM(IFNULL(bad_quantity, 0)))*100), 2)
END AS bad_rate,
DATE(DATE_SUB(DATE_FORMAT(NOW(), '%Y-%m-%d'), INTERVAL 6 MONTH)) AS six_months_ago
FROM
wip_transactions
WHERE
transaction_date >= UNIX_TIMESTAMP(DATE_SUB(DATE_FORMAT(NOW(), '%Y-%m-%d'), INTERVAL 6 MONTH))
AND transaction_date <= UNIX_TIMESTAMP(DATE_FORMAT(NOW(), '%Y-%m-%d'));
";
$result2 = DB_query($sql2, $db);
if ($array2 = mysqli_fetch_assoc($result2)) {
$good_rate2 = $array2['good_rate'];
$bad_rate2 = $array2['bad_rate'];
$six_months_ago2 = $array2['six_months_ago'];
} else {
$good_rate2 = 0;
$bad_rate2 = 0;
$six_months_ago2 = 0;
}
$array2 = array(
(object)array('value' => $good_rate2, 'name' => '良品率'),
(object)array('value' => $bad_rate2, 'name' => '不良率')
);
echo "<script>";
echo "// 给前端赋值
var allGoodRateValue2 = $good_rate2; // 良品率的值
var allBadRateValue2 = $bad_rate2; // 不良率的值
document.getElementById('halfyear_good_rate').innerText = allGoodRateValue2 + '%';
document.getElementById('halfyear_bad_rate').innerText = allBadRateValue2 + '%';";
echo "; var array2 = ";
echo json_encode($array2);
echo ";
var ydata = []
var myChart2 = echarts.init(document.getElementById('poruku2'));
option2 = {
title: {
left: 'center',
top: 'center'
},
color:[
'#00c5d4','#b381dd'
],
tooltip: {
trigger: 'item',
formatter: '{b}: {c}%' // 设置提示框内容格式,b代表数据项名称,c代表数据项值
},
series: [
{
type: 'pie',
data: array2,
radius: ['40%', '70%']
}
]
};
myChart2.setOption(option2);
</script>";
//计算总的良品和不良
$sql3 = "SELECT
SUM( IFNULL( transaction_quantity, 0 ) ) AS total_transaction_quantity,
SUM( IFNULL( bad_quantity, 0 ) ) AS total_bad_quantity,
CASE
WHEN (SUM(IFNULL(transaction_quantity, 0)) + SUM(IFNULL(bad_quantity, 0))) = 0 THEN 0
ELSE ROUND((SUM(IFNULL(transaction_quantity, 0)) / (SUM(IFNULL(transaction_quantity, 0)) + SUM(IFNULL(bad_quantity, 0)))*100), 2)
END AS good_rate,
CASE
WHEN (SUM(IFNULL(transaction_quantity, 0)) + SUM(IFNULL(bad_quantity, 0))) = 0 THEN 0
ELSE ROUND((SUM(IFNULL(bad_quantity, 0)) / (SUM(IFNULL(transaction_quantity, 0)) + SUM(IFNULL(bad_quantity, 0)))*100), 2)
END AS bad_rate
FROM wip_transactions";
$result3 = DB_query($sql3, $db);
if ($array3 = mysqli_fetch_assoc($result3)) {
$good_rate3 = $array3['good_rate'];
$bad_rate3 = $array3['bad_rate'];
$goodnum3 = $array3['total_transaction_quantity'];
$badnum3 = $array3['total_bad_quantity'];
} else {
$good_rate3 = 0;
$bad_rate3 = 0;
$goodnum3 = 0;
$badnum3 = 0;
}
$array3 = array(
(object)array('value' => $good_rate3, 'name' => '良品率'),
(object)array('value' => $bad_rate3, 'name' => '不良率')
);
echo "<script>";
echo "// 给前端赋值
var allGoodRateValue3 = $good_rate3; // 良品率的值
var allBadRateValue3 = $bad_rate3; // 不良率的值
var allGoodNumValue3 = $goodnum3; // 良品总数
var allBadNumValue3 = $badnum3; // 不良总数
var allNumValue3 = allBadNumValue3+allGoodNumValue3; // 总数
//扇形图面板
document.getElementById('all_good_rate').innerText = allGoodRateValue3 + '%';
document.getElementById('all_bad_rate').innerText = allBadRateValue3 + '%';
//数量统计面板
document.getElementById('all_good_rate1').innerText = allGoodRateValue3 + '%';
document.getElementById('all_good_quantity').innerText = allGoodNumValue3;
document.getElementById('all_quantity').innerText = allNumValue3;
document.getElementById('all_bad_quantity').innerText = allBadNumValue3;
";
echo "; var array3 = ";
echo json_encode($array3);
echo ";
var ydata = []
var myChart3 = echarts.init(document.getElementById('poruku3'));
option3 = {
title: {
left: 'center',
top: 'center'
},
color:[
'#e5924b','#10baf8'
],
tooltip: {
trigger: 'item',
formatter: '{b}: {c}%' // 设置提示框内容格式,b代表数据项名称,c代表数据项值
},
series: [
{
type: 'pie',
data: array3,
radius: ['40%', '70%']
}
]
};
myChart3.setOption(option3);
</script>";
//计算总的良品和不良
$sql4 = "SELECT
wt.employee_num,
he.employee_name,
SUM(IFNULL(wt.transaction_quantity, 0)) AS total_transaction_quantity,
SUM(IFNULL(wt.bad_quantity, 0)) AS total_bad_quantity,
CASE
WHEN (SUM(IFNULL(transaction_quantity, 0)) + SUM(IFNULL(bad_quantity, 0))) = 0 THEN 0
ELSE ROUND((SUM(IFNULL(transaction_quantity, 0)) / (SUM(IFNULL(transaction_quantity, 0)) + SUM(IFNULL(bad_quantity, 0)))*100), 2)
END AS good_rate,
CASE
WHEN (SUM(IFNULL(transaction_quantity, 0)) + SUM(IFNULL(bad_quantity, 0))) = 0 THEN 0
ELSE ROUND((SUM(IFNULL(bad_quantity, 0)) / (SUM(IFNULL(transaction_quantity, 0)) + SUM(IFNULL(bad_quantity, 0)))*100), 2)
END AS bad_rate
FROM
wip_transactions wt, hr_employees he
WHERE
wt.employee_num = he.employee_num
GROUP BY
wt.employee_num
ORDER BY
bad_rate desc
";
$result4 = DB_query($sql4, $db);
while ($array4 = mysqli_fetch_assoc($result4)) {
$arrays4[] = $array4;
}
if (is_array($arrays4)) {
foreach ($arrays4 as $key => $value) {
$good_rate4[] = $value['good_rate'];
$bad_rate4[] = $value['bad_rate'];
$goodnum4[] = $value['total_transaction_quantity'];
$badnum4[] = $value['total_bad_quantity'];
$employee_name[] = $value['employee_name'];
}
} else {
$good_rate4[] = 0;
$bad_rate4[] = 0;
$goodnum4[] = 0;
$badnum4[] = 0;
$employee_name[] = 0;
}
echo "<script>";
echo "; var goodnum4 = ";
echo json_encode($goodnum4);
echo "; var badnum4 = ";
echo json_encode($badnum4);
echo "; var good_rate4 = ";
echo json_encode($good_rate4);
echo "; var bad_rate4 = ";
echo json_encode($bad_rate4);
echo "; var employee_name = ";
echo json_encode($employee_name);
echo ";
var ydata = []
var myChart4 = echarts.init(document.getElementById('poruku4'));
option4 = {
//滚动显示
dataZoom: [{
type: 'slider', // 滑动条型式的dataZoom组件
show: true, // 显示dataZoom组件
start: 0, // 默认数据窗口范围的起始位置为0
end: 10, // 默认数据窗口范围的结束位置为30
xAxisIndex: [0], // 设置dataZoom组件影响的x轴索引,默认为第一个x轴
filterMode: 'filter', // 数据窗口范围的定义模式为filter过滤模式
height:12,
textStyle: {
color: 'white' // 设置文字颜色为白色
},
handleStyle: {
color: 'white' // 设置滚动条手柄的颜色为红色
},
fillerColor: 'rgba(255, 255, 255, 0.1)', // 设置滚动条选中区域的颜色为蓝色
}, {
type: 'inside', // 内置型式的dataZoom组件
start: 0, // 默认数据窗口范围的起始位置为0
end: 10, // 默认数据窗口范围的结束位置为30
xAxisIndex: [0], // 设置dataZoom组件影响的x轴索引,默认为第一个x轴
filterMode: 'filter', // 数据窗口范围的定义模式为filter过滤模式
height:12
}],
//配置网格组件,用于定义图表的位置和大小
grid: {
top: '20%', // 增加top的值来创建间距
left: '2%',
right: '5%',
bottom: '20%', // 增加bottom的值来创建间距
containLabel: true, //自动计算并包含坐标轴标签、刻度和标题等内容在内。
},
//横坐标
xAxis: {
name: '员工',
data: employee_name, //设置横坐标的数据,使用变量employee_name中的数据。
axisLine: {
lineStyle: {
color: '#6691b5' // 设置 x 坐标轴线的颜色
}
},
},
//纵坐标
yAxis: {
axisLabel: {
formatter: '{value}%',
},
splitLine: {
show: false // 隐藏纵坐标轴的背景横线
},
axisLine: {
lineStyle: {
color: '#6691b5' // 设置 x 坐标轴线的颜色
}
},
},
//图形颜色
color: [
'#54c2af','#3287fe'
],
//提示框,鼠标悬停在图形上的注解
tooltip: {
trigger: 'axis',
axisPointer: { // 坐标轴指示器,坐标轴触发有效
type: 'line' // 默认为直线,可选为:'line' | 'shadow'
},
formatter: function(params) {
var index = params[0].dataIndex;
var goodnum = goodnum4[index];
var badnum = badnum4[index];
var goodrate = params[0].value;
var badrate = params[1].value;
return employee_name[index] + '<br>' +
'良品数量:' + goodnum + '<br>' +
'不良数量:' + badnum + '<br>' +
'良品率:' + goodrate + '%' + '<br>' +
'不良率:' + badrate + '%';
}
},
series: [
{
name:'良品率',
data:good_rate4,
type:'bar',
stack:'x',
itemStyle: {
normal: {
label: {
show: true,
position: 'inside',
formatter: '良率:{c}%',
textStyle: {
color: 'black',
fontSize: 12
}
}
}
}
},
{
name:'不良率',
data:bad_rate4,
type:'bar',
stack:'x',
itemStyle: {
normal: {
label: {
show: true,
position: 'top',
formatter: '不良率:{c}%',
textStyle: {
color: '#3287fe',
fontSize: 12
}
}
}
}
},
],
};
myChart4.setOption(option4);
</script>";
//员工工时
$sql6 = "SELECT
wt.employee_num,he.employee_name,
SUM((end_date - begin_date) / 3600) AS total_hours,
SUM((end_date - begin_date) / (3600 * 24)) AS total_days,
SUM((end_date - begin_date) / (3600 * 24 * 365)) AS total_years
FROM wip_transactions wt, hr_employees he
WHERE wt.employee_num = he.employee_num
GROUP BY wt.employee_num";
$result6 = DB_query($sql6, $db);
while ($array6 = mysqli_fetch_assoc($result6)) {
$arrays6[] = $array6;
}
if (is_array($arrays6)) {
foreach ($arrays6 as $key => $value) {
$total_hours6[] = $value['total_hours'];
$total_days6[] = $value['total_days'];
$total_years6[] = $value['total_years'];
$employee_name6[] = $value['employee_name'];
}
} else {
$total_hours6[] = 0;
$total_days6[] = 0;
$total_years6[] = 0;
$employee_name6[] = 0;
}
echo "<script>";
echo "; var employee_name6 = ";
echo json_encode($employee_name6);
echo "; var total_hours6 = ";
echo json_encode($total_hours6);
echo ";
var data = [];
var myChart6 = echarts.init(document.getElementById('poruku6'));
option6 = {
yAxis: {
data: employee_name6
},
xAxis: {
},
series: [
{
type: 'bar',
data: total_hours6
}
]
};
myChart6.setOption(option6);
</script>";
// 待生产工时统计
$sql7 = "SELECT a.operation_code,operation_name,sum(begin_quantity*standard_time) as paipei,sum(a.output_quantity*standard_time) wancheng,sum((begin_quantity-a.output_quantity)*standard_time) wait
from wip_operation_plan a,bom_parameters b,wip_jobs_all c
where a.operation_code=b.operation_code
and begin_quantity>a.output_quantity
and standard_time>0
and a.wip_entity_name=c.wip_entity_name
GROUP BY a.operation_code,operation_name
order by a.operation_code desc";
$result7 = DB_query($sql7, $db);
while ($array7 = mysqli_fetch_assoc($result7)) {
$arrays7[] = $array7;
}
if (is_array($arrays7)) {
foreach ($arrays7 as $key => $value) {
$arramount7[] = $value['wait'];
$arrvendor7[] = $value['operation_name'];
}
} else {
$arramount7[] = 0;
$arrvendor7[] = 0;
}
echo "<script>";
echo "; var num7 = ";
echo json_encode($arramount7);
echo "; var customer7 = ";
echo json_encode($arrvendor7);
echo ";
var ydata = []
var myChart7 = echarts.init(document.getElementById('poruku'));
option7 = {
//滚动显示
dataZoom: [{
type: 'slider', // 滑动条型式的dataZoom组件
show: true, // 显示dataZoom组件
start: 0, // 默认数据窗口范围的起始位置为0
end: 30, // 默认数据窗口范围的结束位置为30
xAxisIndex: [0], // 设置dataZoom组件影响的x轴索引,默认为第一个x轴
filterMode: 'filter', // 数据窗口范围的定义模式为filter过滤模式
height: 12, // 设置滑动条型式的高度为20像素
textStyle: {
color: 'white' // 设置文字颜色为白色
},
handleStyle: {
color: 'white' // 设置滚动条手柄的颜色为红色
},
fillerColor: 'rgba(255, 255, 255, 0.1)' // 设置滚动条选中区域的颜色为蓝色
}, {
type: 'inside', // 内置型式的dataZoom组件
start: 0, // 默认数据窗口范围的起始位置为0
end: 30, // 默认数据窗口范围的结束位置为30
xAxisIndex: [0], // 设置dataZoom组件影响的x轴索引,默认为第一个x轴
filterMode: 'filter', // 数据窗口范围的定义模式为filter过滤模式
height: 12
}],
//标题
// title: {
// text: '工序待生产工时统计'
// },
//图形颜色
color: [
'#05c798'
],
//提示框,鼠标悬停在图形上的注解
tooltip: {
trigger: 'axis',
axisPointer: { // 坐标轴指示器,坐标轴触发有效
type: 'line' // 默认为直线,可选为:'line' | 'shadow'
},
backgroundColor: 'rgba(255, 255, 255, 0.7)', // 设置提示条的背景颜色
textStyle: {
color: 'rgba(0, 0, 0)', // 设置提示条文本的颜色为白色
fontSize: 12 // 设置提示条文本的字体大小为12px
}
},
//配置网格组件,用于定义图表的位置和大小
grid: {
top: '20%', // 增加top的值来创建间距
left: '3%',
right: '3%',
bottom: '20%', // 增加bottom的值来创建间距
containLabel: true, //自动计算并包含坐标轴标签、刻度和标题等内容在内。
},
//横坐标
xAxis: {
name: '工序',
nameTextStyle: {
padding: [0, 0, -25, -25] // 横坐标名称与原位置的边距
},
axisLine: {
lineStyle: {
color: '#6691b5' // 设置 x 坐标轴线的颜色
},
show: false // 设置为 false,隐藏横坐标的标签
},
type: 'category', //横坐标数据类型为类别型,适用于离散的数据
data: customer7, //设置横坐标的数据,使用变量customer7中的数据。
axisLabel: {
interval: 0, // 设置横坐标刻度的显示间隔,默认为0表示全部显示
// 如果刻度标签太长,可以使用rotate进行旋转
textStyle: {
fontSize: 14
}
}
},
//纵坐标
yAxis: [
{
name: '工时',
type: 'value', //数据类型为数值型。
axisLabel: {
interval: 0, // 设置横坐标刻度的显示间隔,默认为0表示全部显示
// 如果刻度标签太长,可以使用rotate进行旋转
textStyle: {
fontSize: 14
}
},
axisLine: {
lineStyle: {
color: '#6691b5' // 设置 y 坐标轴线的颜色
},
},
splitLine: {
show: false // 隐藏纵坐标轴的背景横线
},
},
],
series: [
{
name: '工时',
type: 'bar',
barWidth: '25%',
data: num7,
itemStyle: {
normal: {
label: {
show: true,
position: 'top',
textStyle: {
color: '#6691b5',
fontSize: 12
}
}
}
}
},
],
};
myChart7.setOption(option7);
</script>";
css
body {
    background: linear-gradient(25deg, #0f2249, #182e5a 20%, #0f2249 40%, #182e5a 60%, #0f2249 80%, #182e5a 100%);
    padding: 0px;
    margin: 0px;
}

ul {
    padding: 0px;
    margin: 0px;
}

.head {
    /* height: 40px; */
    background: url(../../images/head_bg.png) no-repeat center center;
    background-size: 100% 100%;
    position: relative;
    margin-bottom: 20px;
    border: 1px solid rgb(255, 255, 255, 0);
}

.head h1 {
    color: #bde4ff;
    text-align: center;
    font-size: 25px;
    /* line-height: 40px; */
    letter-spacing: .06rem;
}

.head h1 img {
    width: 1.5rem;
    display: inline-block;
    vertical-align: middle;
    margin-right: .2rem
}

.all_title {
    background: linear-gradient(to top, #56c3ec, #b2f3f5);
    -webkit-background-clip: text;
    -webkit-text-fill-color: transparent;
    text-align: center;
    letter-spacing: 2px;
    font-family: '微软雅黑';
    font-weight: bold;
    /* font-size: 32px; */
}


.kanban_all {
    /* border: 1px solid black; */
    width: 100%;
    display: flex;
    justify-content: center;
    align-items: center;
}

.kanban_all_position {
    /* border: 1px solid red; */
    width: 98%;
    display: flex;
    flex-wrap: wrap;
}

.kanban_item {
    /* border: 1px solid red; */
    width: calc(50% - 2%);
    margin: 0 1% 1% 1%;
}

.kanban_line {
    height: 280px;
    border: 1px solid #3486da;
    background: rgba(0, 70, 190, .1);
    padding: .15rem;
    position: relative;
    margin-bottom: .25rem;
    z-index: 10;
    /* width: calc(50% - 3%); */
    margin: 0 1% 1% 1%;
}


.kanban_line:before,
.kanban_line:after {
    position: absolute;
    /* width: .15rem;
    height: .15rem; */
    content: "";
    border-top: 3px solid #3486da;
    top: -2px;
}

.kanban_line:before,
.kanban_line:after,


.kanban_title {
    height: 20px;
    padding: 1%;
    font-family: '华文细黑';
    font-weight: bold;
    background: linear-gradient(to right, rgba(48, 82, 174, 1), rgba(48, 82, 174, 0));
    color: #fff;
    font-size: 14px;
}

.kanban_content {
    height: 220px;
    padding: 1%;
    display: flex;
    justify-content: center;
    /* border: 1px solid red; */
}

.kanban_content table {
    width: 100%;
    /* border: 1px solid red; */
}

.kanban_content_left {
    /* border: 1px solid red; */
    width: 65%;
}

.kanban_content_right {
    width: 35%;
    /* border: 1px solid green; */
}

.kanban_content_right li {
    margin-top: 15%;
    font-family: '微软雅黑';
}

.kanban_content table td {
    width: 100%;
    /* 或者您可以根据需求设置其他百分比值,例如33.33% */
}

.kanban_line_double {
    /* border: 1px solid blue; */
    display: flex;
    justify-content: center;
    width: 100%;
    height: 100%;
}

.kanban_line_double .left {
    /* border: 1px solid red; */
    width: 48%;
    height: 100%;
}

.kanban_line_double .left .kanban_title {
    padding: 2%;
}

.kanban_line_double .middle {
    background: none;
    width: 3%;
}

.kanban_line_double .right {
    /* border: 1px solid black; */
    width: 48%;
    height: 100%;
}

.kanban_line_double .right .kanban_title {
    padding: 2%;
}

/* 表格 */
.table {
    text-align: center;
    /* border: 1px solid black; */
    border-collapse: collapse;
}

.table tr th {
    width: 20%;
    /* border: 1px solid black; */
    color: #c0dcf0;
    font-weight: bold;
}

.table tr td {
    width: 20%;
    text-align: center;
    padding-top: 1%;
    color: #8faade;
}

.quantity_show {
    width: 100%;
    font-size: 20px;
    letter-spacing: 2px;
    font-family: '微软雅黑';
    text-align: center;
    color: white;
    display: flex;
    align-items: center;
    justify-content: center;
}

.quantity_show_position {
    width: 100%;
}

.quantity_show div {
    padding: 1%;
    color: white;

}

.quantity_show .quantity_line2 {
    color: white;
    font-size: 30px;
}

.quantity_show .quantity_line3 ul {
    display: flex;
    /* border: 1px solid red; */
    justify-content: center;
    /* 水平居中 */
    align-items: center;
    /* 垂直居中 */
}

.quantity_show .quantity_line3 ul li {
    margin: 0 5%;
    /* border: 1px solid black; */
    list-style: none;
}

.quantity_show .quantity_line3 ul li:nth-child(1):before {
    content: "";
    display: inline-block;
    width: 12px;
    /* 设置图标宽度 */
    height: 12px;
    /* 设置图标高度 */
    background-color: red;
    border-radius: 50%;
    /* 设置图标背景颜色 */
    margin-right: 5px;
    /* 调整图标与文本之间的间距 */
}

.quantity_show .quantity_line3 ul li:nth-child(2):before {
    content: "";
    display: inline-block;
    width: 12px;
    /* 设置图标宽度 */
    height: 12px;
    /* 设置图标高度 */
    background-color: green;
    border-radius: 50%;
    /* 设置图标背景颜色 */
    margin-right: 5px;
    /* 调整图标与文本之间的间距 */
}

.quantity_show .quantity_line3 span {
    color: #fff;
}
echarts下载参照官网:快速上手 - Handbook - Apache ECharts