//画立方体三个面
const CubeLeft = echarts.graphic.extendShape({
shape: {
x: 0,
y: 0,
width: 9.5, //柱状图宽
zWidth: 4, //阴影折角宽
zHeight: 3, //阴影折角高
},
buildPath: function (ctx, shape) {
const api = shape.api;
const xAxisPoint = api.coord([shape.xValue, 0]);
const p0 = [shape.x - shape.width / 2, shape.y - shape.zHeight];
const p1 = [shape.x - shape.width / 2, shape.y - shape.zHeight];
const p2 = [xAxisPoint[0] - shape.width / 2, xAxisPoint[1]];
const p3 = [xAxisPoint[0] + shape.width / 2, xAxisPoint[1]];
const p4 = [shape.x + shape.width / 2, shape.y];
ctx.moveTo(p0[0], p0[1]);
// ctx.lineTo(p1[0], p1[1]);
ctx.lineTo(p2[0], p2[1]);
ctx.lineTo(p3[0], p3[1]);
ctx.lineTo(p4[0], p4[1]);
ctx.closePath();
},
});
const CubeRight = echarts.graphic.extendShape({
shape: {
x: 0,
y: 0,
width: 9,
zWidth: 9.5,
zHeight: 5.5,
},
buildPath: function (ctx, shape) {
const api = shape.api;
const xAxisPoint = api.coord([shape.xValue, 0]);
const p1 = [shape.x - shape.width / 2, shape.y - shape.zHeight / 2];
const p3 = [xAxisPoint[0] + shape.width / 2, xAxisPoint[1]];
const p4 = [shape.x + shape.width / 2, shape.y];
const p5 = [xAxisPoint[0] + shape.width / 2 + shape.zWidth, xAxisPoint[1]];
const p6 = [
shape.x + shape.width / 2 + shape.zWidth,
shape.y - shape.zHeight / 2,
];
const p7 = [
shape.x - shape.width / 2 + shape.zWidth,
shape.y - shape.zHeight,
];
ctx.moveTo(p4[0], p4[1]);
ctx.lineTo(p3[0], p3[1]);
ctx.lineTo(p5[0], p5[1]);
ctx.lineTo(p6[0], p6[1]);
ctx.lineTo(p4[0], p4[1]);
// ctx.moveTo(p4[0], p4[1]);
// ctx.lineTo(p6[0], p6[1]);
// ctx.lineTo(p7[0], p7[1]);
// ctx.lineTo(p1[0], p1[1]);
// ctx.lineTo(p4[0], p4[1]);
ctx.closePath();
},
});
const CubeTop = echarts.graphic.extendShape({
shape: {
x: 0,
y: 0,
width: 9,
zWidth: 9.5,
zHeight: 6,
},
buildPath: function (ctx, shape) {
const api = shape.api;
const xAxisPoint = api.coord([shape.xValue, 0]);
const p1 = [shape.x - shape.width / 2, shape.y - shape.zHeight / 2];
const p3 = [xAxisPoint[0] + shape.width / 2, xAxisPoint[1]];
const p4 = [shape.x + shape.width / 2, shape.y];
const p5 = [xAxisPoint[0] + shape.width / 2 + shape.zWidth, xAxisPoint[1]];
const p6 = [
shape.x + shape.width / 2 + shape.zWidth,
shape.y - shape.zHeight / 2,
];
const p7 = [
shape.x - shape.width / 2 + shape.zWidth,
shape.y - shape.zHeight,
];
// ctx.moveTo(p4[0], p4[1]);
// ctx.lineTo(p3[0], p3[1]);
// ctx.lineTo(p5[0], p5[1]);
// ctx.lineTo(p6[0], p6[1]);
// ctx.lineTo(p4[0], p4[1]);
ctx.moveTo(p4[0], p4[1]);
ctx.lineTo(p6[0], p6[1]);
ctx.lineTo(p7[0], p7[1]);
ctx.lineTo(p1[0], p1[1]);
ctx.closePath();
},
});
echarts.graphic.registerShape("CubeLeft", CubeLeft);
echarts.graphic.registerShape("CubeRight", CubeRight);
echarts.graphic.registerShape("CubeTop", CubeTop);
//定义颜色值
const colors = [
[
{ offset: 0, color: "rgb(254, 223, 34)" },
{ offset: 0.5, color: "rgba(254, 223, 34,0.2)" },
{ offset: 1, color: "rgba(0, 0, 0,0.3)" },
],
[
{ offset: 0, color: "rgba(23, 252, 238)" },
{ offset: 0.5, color: "rgba(23, 252, 238,0.2)" },
{ offset: 1, color: "rgba(0, 0, 0,0.3)" },
],
];
const leftColors = [
[
{ offset: 0, color: "rgb(254, 223, 34,0.7)" },
{ offset: 0.5, color: "rgba(254, 223, 34,0.9)" },
{ offset: 1, color: "rgba(0, 0, 0,0.3)" },
],
[
{ offset: 0, color: "rgba(23, 252, 238,0.7)" },
{ offset: 0.5, color: "rgba(23, 252, 238,0.9)" },
{ offset: 1, color: "rgba(0, 0, 0,0.3)" },
],
];
const topColors = [
[
{
offset: 0,
color: "rgba(204, 186, 49,0.5)",
},
{
offset: 1,
color: "rgba(204, 186, 49,0.8)",
},
],
[
{
offset: 0,
color: "rgba(17, 159, 174,0.5)",
},
{
offset: 1,
color: "rgba(17, 159, 174,0.8)",
},
],
];
function getSeriesData() {
const data = [];
seriesData.forEach((item, index) => {
data.push({
type: "custom",
name: item.label,
renderItem: function (params, api) {
return getRenderItem(params, api);
},
// label:{
// show:true,
// },
data: item.data,
itemStyle: {
color: () => {
return new echarts.graphic.LinearGradient(0, 0, 0, 1, colors[index]);
},
},
});
});
data.push(
{
type: "bar",
itemStyle: {
color: "transparent",
},
label: {
normal: {
show: true,
position: "top",
fontSize: 12,
color: "rgba(255, 255, 255, 0.9)",
offset: [-5, -15],
},
},
data: seriesData[0].data,
},
{
type: "bar",
itemStyle: {
color: "transparent",
},
// showBackground: true,
label: {
normal: {
show: true,
position: "top",
fontSize: 12,
color: "rgba(255, 255, 255, 0.9)",
offset: [-7, -15],
},
},
data: seriesData[1].data,
}
);
return data;
}
function getRenderItem(params, api) {
const index = params.seriesIndex;
let location = api.coord([api.value(0) + index, api.value(1)]);
const shape = {
api,
xValue: api.value(0) + index,
yValue: api.value(1),
x: location[0],
y: location[1],
xAxisPoint: api.coord([api.value(0), 0]),
};
return {
type: "group",
children: [
{
position: seriesData[index].position,
type: "CubeTop",
shape: shape,
style: {
fill: new echarts.graphic.LinearGradient(
0,
0,
0,
1,
topColors[index]
),
},
},
{
position: seriesData[index].position,
type: "CubeLeft",
shape: shape,
style: {
fill: new echarts.graphic.LinearGradient(
0,
0,
0,
1,
leftColors[index]
),
},
},
{
position: seriesData[index].position,
type: "CubeRight",
shape: shape,
style: api.style(),
},
],
};
}
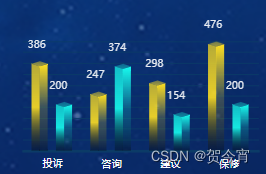
const seriesData = [
{
label: "话务",
position: [-20, 0],
data: [386, 247, 298, 476],
},
{
label: "工单",
position: [-60, 0],
data: [200, 374, 154, 200],
},
];
let option = reactive({
tooltip: {
show: false,
},
xAxis: {
data: ["投诉", "咨询", "建议", "保修"],
axisTick: {
show: false,
},
axisLine: {
lineStyle: {
color: "#0b3b67",
width: 3,
},
},
axisLabel: {
show: true,
color: "#fff",
},
},
yAxis: {
show: true,
axisLabel: {
show: false,
},
splitNumber: 7,
splitLine: {
show: true,
lineStyle: {
color: "#0b3b67",
},
},
},
series: getSeriesData(),
});