Feature scaling and Learning Rate
- 1、数据集
- 2、学习率
- 3、特征缩放
- 3.1 特征缩放的原因
- 3.2 Z-score 归一化
- 3.3 预测
- 3.4 损失等值线
导入所需的库
import numpy as np
np.set_printoptions(precision=2)
import matplotlib.pyplot as plt
dlblue = '#0096ff'; dlorange = '#FF9300'; dldarkred='#C00000'; dlmagenta='#FF40FF'; dlpurple='#7030A0';
plt.style.use('./deeplearning.mplstyle')
from lab_utils_multi import  load_house_data, compute_cost, run_gradient_descent
from lab_utils_multi import  norm_plot, plt_contour_multi, plt_equal_scale, plot_cost_i_w
1、数据集
| Size (sqft) | Number of Bedrooms | Number of floors | Age of Home | Price (1000s dollars) |
|---|---|---|---|---|
| 952 | 2 | 1 | 65 | 271.5 |
| 1244 | 3 | 2 | 64 | 232 |
| 1947 | 3 | 2 | 17 | 509.8 |
| … | … | … | … | … |
利用以上表格中的数据构建一个线性模型,这样我们可以预测房屋的价格(1200 sqft, 3 bedrooms, 1 floor, 40 years old)
# load the dataset
X_train, y_train = load_house_data()
X_features = ['size(sqft)','bedrooms','floors','age']
绘制每个房子特征与房屋价格之间的关系图
fig,ax=plt.subplots(1, 4, figsize=(12, 3), sharey=True)
for i in range(len(ax)):
    ax[i].scatter(X_train[:,i],y_train)
    ax[i].set_xlabel(X_features[i])
ax[0].set_ylabel("Price (1000's)")
plt.show()

对每个特征与目标变量(价格)进行绘图可以提供一些关于哪些特征对价格有最强影响的线索。如上所述,增加房屋面积也会增加价格。而卧室数和楼层数似乎对价格影响不大。新房比旧房价格更高。
2、学习率
设置不同的学习率进行梯度下降,观察一下的结果
2.1 α \alpha α = 9.9e-7
#set alpha to 9.9e-7
_, _, hist = run_gradient_descent(X_train, y_train, 10, alpha = 9.9e-7)
运行过程:

看起来学习率太高了。解决方案没有收敛。损失在增加而不是减少,绘制结果可视化:
plot_cost_i_w(X_train, y_train, hist)

右侧的图显示了参数
w
0
w_0
w0 的值。在每次迭代中,它超过了最优值,结果导致成本增加而不是接近最小值。需要注意的是,这不是一个完全准确的图,因为每次迭代时有4个参数被修改,而不仅仅是一个。该图仅显示了
w
0
w_0
w0 的值,其他参数被设定为一些良好的值。在这个图和后面的图中,可能会注意到蓝线和橙线略有偏差。
2.2 α \alpha α = 9e-7
#set alpha to 9e-7
_,_,hist = run_gradient_descent(X_train, y_train, 10, alpha = 9e-7)

损失在整个运行过程中都在减少,这表明学习率 α \alpha α 不是太大。
plot_cost_i_w(X_train, y_train, hist)

在左图中,可以看到损失在逐渐减少,这是预期的结果。在右图中,可以看到
w
0
w_0
w0 仍然在最小值周围振荡,但每次迭代它都在减小,而不是增加。dj_dw[0] 在每次迭代中改变符号,因为 w[0] 跳过了最优值。
2.3 α \alpha α = 1e-7
#set alpha to 1e-7
_,_,hist = run_gradient_descent(X_train, y_train, 10, alpha = 1e-7)

plot_cost_i_w(X_train,y_train,hist)

在左图中,可以看到损失在逐渐减少,这是预期的结果。在右图中,可以看到
w
0
w_0
w0 在没有越过最小值的情况下逐渐减小。dj_w0 在整个运行过程中都是负数。尽管可能不如前面的例子那么快,但是这个解也会收敛。
3、特征缩放
3.1 特征缩放的原因
让我们再看看
α
\alpha
α = 9e-7的情况。这非常接近可以设置
α
\alpha
α到不发散的最大值。这是前几次迭代的简短运行:

如上所示,虽然损失正在降低,但很明显由于
w
0
w_0
w0的梯度更大,因此比其他参数取得更快的进展。
下图显示了
α
\alpha
α = 9e-7非常长时间的运行结果。这花费几个小时。

从上图中可以看到,损失在最初降低后缓慢下降。注意w0 和 w0,w1,w2 以及 dj_dw0 和dj_dw1-3 之间的区别。w0 很快达到了接近最终值的状态, dj_dw0 快速减小到一个很小的值来显示w0接近最终值,而其他参数更缓慢地减小。
为什么会是这样? 有什么办法可以改进它?

上图说明了
w
w
w更新不均匀的原因。
- α \alpha α 由所有的参数更新共享.
- 公共误差项被乘以特征值来更新 w w w,而不是偏置项 b b b.
- 特征值的大小变化幅度差异很大,导致一些特征的更新速度比其他特征快得多。在这个例子中, w 0 w_0 w0 乘以 ‘size(sqft)’,该特征通常大于 1000,而 w 1 w_1 w1 乘以 ‘number of bedrooms’,该特征通常在 2-4 范围内。
所以,解决方案就是特征缩放。
在课程中介绍了三种不同的技术:
- 特征缩放,本质上是将每个特征除以用户选择的值,使得特征值的范围在 -1 到 1 之间。
- 均值归一化: x i : = x i − μ i m a x − m i n x_i := \dfrac{x_i - \mu_i}{max - min} xi:=max−minxi−μi
- Z-score 归一化.
3.2 Z-score 归一化
Z-score 归一化后,所有特征的均值为 0,标准差为 1.
为实现 Z-score 归一化, 根据以下公式调整输入值:
x
j
(
i
)
=
x
j
(
i
)
−
μ
j
σ
j
(4)
x^{(i)}_j = \dfrac{x^{(i)}_j - \mu_j}{\sigma_j} \tag{4}
xj(i)=σjxj(i)−μj(4)
其中,
j
j
j 选择一个特征或矩阵 X 中的一列。
µ
j
µ_j
µj 是特征(j)所有值的平均值,
σ
j
\sigma_j
σj 是特征(j)的标准差。
μ
j
=
1
m
∑
i
=
0
m
−
1
x
j
(
i
)
σ
j
2
=
1
m
∑
i
=
0
m
−
1
(
x
j
(
i
)
−
μ
j
)
2
\begin{align} \mu_j &= \frac{1}{m} \sum_{i=0}^{m-1} x^{(i)}_j \tag{5}\\ \sigma^2_j &= \frac{1}{m} \sum_{i=0}^{m-1} (x^{(i)}_j - \mu_j)^2 \tag{6} \end{align}
μjσj2=m1i=0∑m−1xj(i)=m1i=0∑m−1(xj(i)−μj)2(5)(6)
这里需要注意:对特征进行归一化时,存储用于归一化的值(用于计算的平均值和标准差)非常重要。从模型中学习参数后,我们经常想要预测我们以前没有见过的房屋的价格。给定一个新的 x 值(客厅面积和卧室数量),我们必须首先使用我们之前根据训练集计算的平均值和标准差对 x 进行标准化。
以下是实现过程:
def zscore_normalize_features(X):
    """
    computes  X, zcore normalized by column

    Args:
      X (ndarray): Shape (m,n) input data, m examples, n features

    Returns:
      X_norm (ndarray): Shape (m,n)  input normalized by column
      mu (ndarray):     Shape (n,)   mean of each feature
      sigma (ndarray):  Shape (n,)   standard deviation of each feature
    """
    # find the mean of each column/feature
    mu     = np.mean(X, axis=0)                 # mu will have shape (n,)
    # find the standard deviation of each column/feature
    sigma  = np.std(X, axis=0)                  # sigma will have shape (n,)
    # element-wise, subtract mu for that column from each example, divide by std for that column
    X_norm = (X - mu) / sigma

    return (X_norm, mu, sigma)

#check our work
#from sklearn.preprocessing import scale
#scale(X_orig, axis=0, with_mean=True, with_std=True, copy=True)
可以看一下 Z-score 归一化逐步的转变过程:
mu     = np.mean(X_train,axis=0)
sigma  = np.std(X_train,axis=0)
X_mean = (X_train - mu)
X_norm = (X_train - mu)/sigma

fig,ax=plt.subplots(1, 3, figsize=(12, 3))
ax[0].scatter(X_train[:,0], X_train[:,3])
ax[0].set_xlabel(X_features[0]); ax[0].set_ylabel(X_features[3]);
ax[0].set_title("unnormalized")
ax[0].axis('equal')

ax[1].scatter(X_mean[:,0], X_mean[:,3])
ax[1].set_xlabel(X_features[0]); ax[0].set_ylabel(X_features[3]);
ax[1].set_title(r"X - $\mu$")
ax[1].axis('equal')

ax[2].scatter(X_norm[:,0], X_norm[:,3])
ax[2].set_xlabel(X_features[0]); ax[0].set_ylabel(X_features[3]);
ax[2].set_title(r"Z-score normalized")
ax[2].axis('equal')
plt.tight_layout(rect=[0, 0.03, 1, 0.95])
fig.suptitle("distribution of features before, during, after normalization")
plt.show()

上图显示了两个训练集参数“年龄”和“平方英尺”之间的关系。这些都是以相同比例绘制的。
左:未标准化:“尺寸(平方英尺)”特征的值范围或方差远大于年龄的范围。
中:第一步查找从每个特征中减去平均值。这留下了以零为中心的特征。很难看出“年龄”特征的差异,但“尺寸(平方英尺)”显然在零左右。
右:第二步除以方差。这使得两个特征都以零为中心,具有相似的尺度。
接下来,对数据进行标准化并将其与原始数据进行比较。
# normalize the original features
X_norm, X_mu, X_sigma = zscore_normalize_features(X_train)
print(f"X_mu = {X_mu}, \nX_sigma = {X_sigma}")
print(f"Peak to Peak range by column in Raw        X:{np.ptp(X_train,axis=0)}")
print(f"Peak to Peak range by column in Normalized X:{np.ptp(X_norm,axis=0)}")

通过归一化,每列的峰值范围从数千倍减少到 2-3 倍。
fig,ax=plt.subplots(1, 4, figsize=(12, 3))
for i in range(len(ax)):
    norm_plot(ax[i],X_train[:,i],)
    ax[i].set_xlabel(X_features[i])
ax[0].set_ylabel("count");
fig.suptitle("distribution of features before normalization")
plt.show()
fig,ax=plt.subplots(1,4,figsize=(12,3))
for i in range(len(ax)):
    norm_plot(ax[i],X_norm[:,i],)
    ax[i].set_xlabel(X_features[i])
ax[0].set_ylabel("count");
fig.suptitle(f"distribution of features after normalization")

plt.show()


接下来,使用归一化的数据重新运行梯度下降算法。
w_norm, b_norm, hist = run_gradient_descent(X_norm, y_train, 1000, 1.0e-1, )

缩放后的特征可以更快地获得非常准确的结果!请注意,在这个相当短的运行结束时,每个参数的梯度都很小。0.1 的学习率是使用归一化特征进行回归的良好开端。接下来绘制预测值与目标值的关系图。请注意,预测是使用归一化特征进行的,而绘图是使用原始特征值显示的。
#predict target using normalized features
m = X_norm.shape[0]
yp = np.zeros(m)
for i in range(m):
    yp[i] = np.dot(X_norm[i], w_norm) + b_norm

    # plot predictions and targets versus original features
fig,ax=plt.subplots(1,4,figsize=(12, 3),sharey=True)
for i in range(len(ax)):
    ax[i].scatter(X_train[:,i],y_train, label = 'target')
    ax[i].set_xlabel(X_features[i])
    ax[i].scatter(X_train[:,i],yp,color=dlorange, label = 'predict')
ax[0].set_ylabel("Price"); ax[0].legend();
fig.suptitle("target versus prediction using z-score normalized model")
plt.show()

3.3 预测
生成模型的目的是用它来预测数据集中没有的房价。我们来预测一套 1200 平方英尺、3 间卧室、1 层、40 年楼龄的房子的价格。必须使用训练数据标准化时得出的平均值和标准差来标准化数据。
# First, normalize out example.
x_house = np.array([1200, 3, 1, 40])
x_house_norm = (x_house - X_mu) / X_sigma
print(x_house_norm)
x_house_predict = np.dot(x_house_norm, w_norm) + b_norm
print(f" predicted price of a house with 1200 sqft, 3 bedrooms, 1 floor, 40 years old = ${x_house_predict*1000:0.0f}")

3.4 损失等值线
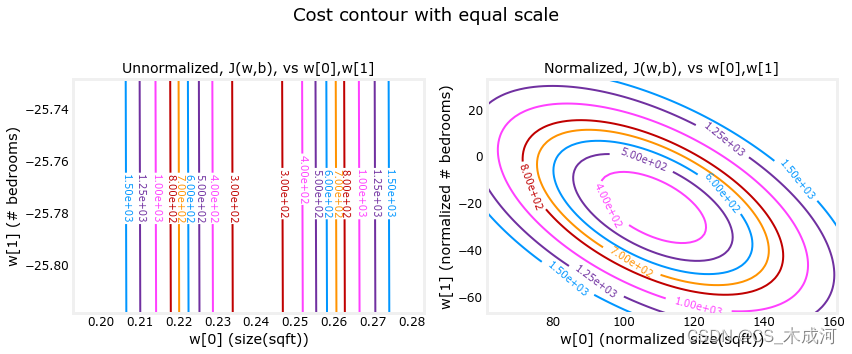
查看特征缩放的另一种方法是根据损失等值线。当特征尺度不匹配时,等值线图中损失与参数的关系图是不对称的。在下图中,参数的比例是匹配的。左图是 w[0](平方英尺)与 w[1](标准化特征之前的卧室数量)的损失等值线图。该图非常不对称,以至于看不到完整轮廓的曲线。相反,当特征标准化时,损失轮廓更加对称。结果是,在梯度下降期间更新参数可以使每个参数取得相同的进展。

plt_equal_scale(X_train, X_norm, y_train)
