Python 日志记录:6大日志记录库的比较
文章目录
- Python 日志记录:6大日志记录库的比较
- 前言
- 一些日志框架建议
- 1. logging - 内置的标准日志模块
- 默认日志记录器
- 自定义日志记录器
- 生成结构化日志
- 2. Loguru - 最流行的Python第三方日志框架
- 默认日志记录器
- 自定义日志记录器
- 3. Structlog
- 4. Eliot
- 5. Logbook
- 6. Picologging
- 最后的想法
前言
日志记录框架是一种工具,可帮助您标准化应用程序中的日志记录过程。虽然某些编程语言提供内置日志记录模块作为其标准库的一部分,但大多数日志记录框架都是第三方库,例如logging (Python)、Log4j (Java)、 Zerolog (Go) 或 Winston (Node.js)。有时,组织会选择开发自定义日志记录解决方案,但这通常仅限于具有高度专业化需求的大型公司。
虽然 Python 在其标准库中提供了强大且功能丰富的日志记录解决方案,但第三方日志记录生态系统也提供了一系列引人注目的替代方案。根据您的需求,这些外部库可能更适合您的日志记录需求。
因此,本文将介绍 Python 用于跟踪应用程序和库行为的六大日志解决方案。我们将首先讨论标准logging模块,然后研究 Python 社区创建的其他五个logging frameworks。
一些日志框架建议
-
Pino (Node.js)
-
Zerolog, Zap, or Slog (Go)
-
Monolog (PHP)
-
SLF4J with Log4J2 or Logback (Java)
-
Loguru (Python)
-
Semantic Logger (Ruby)
1. logging - 内置的标准日志模块
默认日志记录器
与大多数编程语言不同,Python 在其标准库中包含了一个功能齐全的日志框架。该日志记录解决方案有效地满足了库和应用程序开发人员的需求,并包含了以下严重性级别:DEBUG、INFO、WARNING、ERROR 和 CRITICAL。有了默认日志记录器,无需任何前期设置,您就可以立即开始记录日志。
import logging

logging.debug("A debug message")
logging.info("An info message")
logging.warning("A warning message")
logging.error("An error message")
logging.critical("A critical message")
此default(或root)记录器在该WARNING级别运行,这意味着只有严重性等于或超过的记录调用WARNING才会产生输出:
WARNING:root:A warning message
ERROR:root:An error message
CRITICAL:root:A critical message
自定义日志记录器
这种配置可确保只显示潜在的重要信息,减少日志输出中的噪音。不过,您也可以根据需要自定义日志级别并微调日志记录行为。使用logging模块的推荐方法是通过 getLogger()方法创建自定义日志记录器:
import logging

logger = logging.getLogger(__name__)
一旦有了自定义记录器,您就可以通过 logging模块 提供的Handler(处理程序)、 Formatter(格式化器)和Filter(过滤器) 类来自定义其输出。
-
Handlers决定输出目的地,并可根据日志级别进行定制。一个日志记录器还可添加多个Handlers,以便同时向不同目的地发送日志信息。 -
Formatters决定了日志记录器产生的记录的格式。然而,目前还没有JSON、Logfmt等预定义格式。您必须结合可用的日志记录属性来构建自己的格式。
root日志记录器的默认格式为%(levelname)s:%(name)s:%(message)s。
然而,自定义日志记录器默认为只有%(message)s。 -
Filters由handler和logger objects使用,用于过滤日志记录。与日志级别相比,Filters能更好地控制哪些日志记录应被处理或忽略。在日志被发送到最终目的地之前,它们还能以某种方式增强或修改记录。例如,您可以创建一个自定义过滤器,以删除日志中的敏感数据。
下面是一个使用自定义日志记录器将日志记录到控制台和文件的示例:
import sys
import logging

logger = logging.getLogger("example")
logger.setLevel(logging.DEBUG)

# Create handlers for logging to the standard output and a file
stdoutHandler = logging.StreamHandler(stream=sys.stdout)
errHandler = logging.FileHandler("error.log")

# Set the log levels on the handlers
stdoutHandler.setLevel(logging.DEBUG)
errHandler.setLevel(logging.ERROR)

# Create a log format using Log Record attributes
fmt = logging.Formatter(
    "%(name)s: %(asctime)s | %(levelname)s | %(filename)s:%(lineno)s | %(process)d >>> %(message)s"
)

# Set the log format on each handler
stdoutHandler.setFormatter(fmt)
errHandler.setFormatter(fmt)

# Add each handler to the Logger object
logger.addHandler(stdoutHandler)
logger.addHandler(errHandler)

logger.info("Server started listening on port 8080")
logger.warning(
    "Disk space on drive '/var/log' is running low. Consider freeing up space"
)

try:
    raise Exception("Failed to connect to database: 'my_db'")
except Exception as e:
    # exc_info=True ensures that a Traceback is included
    logger.error(e, exc_info=True)
执行上述程序时,控制台会如期打印出以下日志信息:
example: 2023-07-23 14:42:18,599 | INFO | main.py:30 | 187901 >>> Server started listening on port 8080

example: 2023-07-23 14:14:47,578 | WARNING | main.py:28 | 143936 >>> Disk space on drive '/var/log' is running low. Consider freeing up space

example: 2023-07-23 14:14:47,578 | ERROR | main.py:34 | 143936 >>> Failed to connect to database: 'my_db'

Traceback (most recent call last):
  File "/home/ayo/dev/betterstack/demo/python-logging/main.py", line 32, in <module>
    raise Exception("Failed to connect to database: 'my_db'")
Exception: Failed to connect to database: 'my_db'
同时还创建了 error.log 文件,该文件应仅包含 ERROR 日志,因为 errHandler 的最小级别已设置为 ERROR:
example: 2023-07-23 14:14:47,578 | ERROR | main.py:34 | 143936 >>> Failed to connect to database: 'my_db'
Traceback (most recent call last):
  File "/home/ayo/dev/betterstack/demo/python-logging/main.py", line 32, in <module>
    raise Exception("Failed to connect to database: 'my_db'")
Exception: Failed to connect to database: 'my_db'
生成结构化日志
在撰写本文时,除非执行一些附加代码,否则logging模块无法生成结构化日志。值得庆幸的是,有一种更简单、更好的方法可以获得结构化输出:python-json-logger 库。
$ pip install python-json-logger
安装后,您可以按以下方式使用它:
import sys
import logging
from pythonjsonlogger import jsonlogger

. . .

# The desired Log Record attributes must be included here, and they can be
# renamed if necessary
fmt = jsonlogger.JsonFormatter(
    "%(name)s %(asctime)s %(levelname)s %(filename)s %(lineno)s %(process)d %(message)s",
    rename_fields={"levelname": "severity", "asctime": "timestamp"},
)

# Set the log format on each handler
stdoutHandler.setFormatter(fmt)
errHandler.setFormatter(fmt)

. . .
如果用上面突出显示的几行修改前面的示例,执行时将观察到以下输出:
{"name": "example", "filename": "main.py", "lineno": 31, "process": 179775, "message": "Server started listening on port 8080", "severity": "INFO", "timestamp": "2023-07-23 14:39:03,265"}
{"name": "example", "filename": "main.py", "lineno": 32, "process": 179775, "message": "Disk space on drive '/var/log' is running low. Consider freeing up space", "severity": "WARNING", "timestamp": "2023-07-23 14:39:03,265"}
{"name": "example", "filename": "main.py", "lineno": 38, "process": 179775, "message": "Failed to connect to database: 'my_db'", "exc_info": "Traceback (most recent call last):\n  File \"/home/ayo/dev/betterstack/demo/python-logging/main.py\", line 36, in <module>\n    raise Exception(\"Failed to connect to database: 'my_db'\")\nException: Failed to connect to database: 'my_db'", "severity": "ERROR", "timestamp": "2023-07-23 14:39:03,265"}
还可以通过 level 方法上的extra属性在log point添加上下文数据,如下所示:
logger.info(
    "Server started listening on port 8080",
    extra={"python_version": 3.10, "os": "linux", "host": "fedora 38"},
)
{"name": "example", "filename": "main.py", "lineno": 31, "process": 195301, "message": "Server started listening on port 8080", "python_version": 3.1, "os": "linux", "host": "fedora 38", "severity": "INFO", "timestamp": "2023-07-23 14:45:42,472"}
正如您所看到的,built-in的 logging module 能够满足各种日志记录需求,并且具有可扩展性。不过,它的初始配置和自定义可能比较麻烦,因为在开始有效记录之前,你必须创建和配置loggers、handlers和formatters。
请参阅我们的 Python 日志指南和官方文档,进一步了解日志模块的功能和最佳实践。
2. Loguru - 最流行的Python第三方日志框架
Loguru 是最流行的 Python 第三方日志框架,在撰写本文时已在 GitHub 上获得超过 15k颗星。它旨在通过预配置日志记录器来简化日志记录过程,并通过其 add() 方法使自定义日志记录器变得非常容易。
默认日志记录器
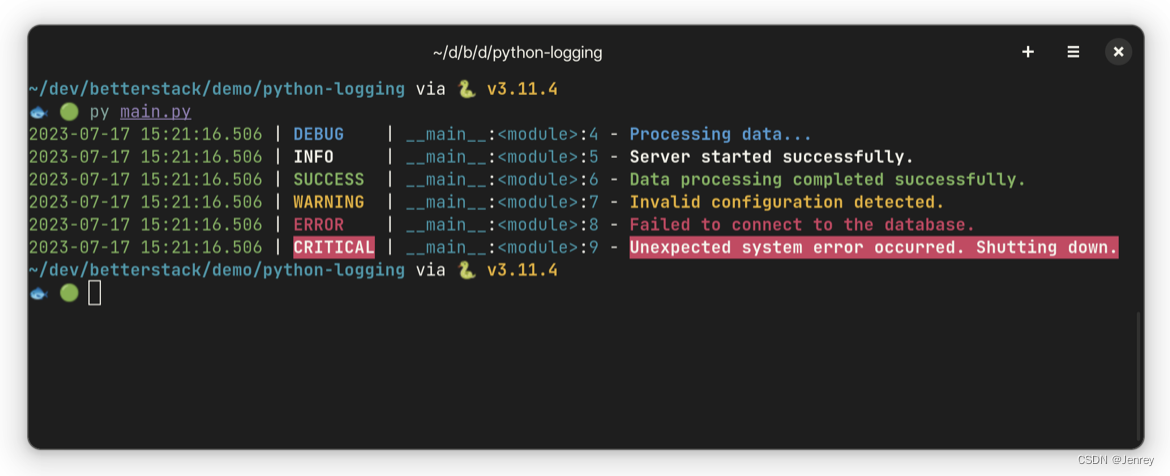
使用 Loguru 启动日志记录非常简单,只需安装软件包并导入,然后调用其级别方法即可,如下所示:
$ pip install loguru
from loguru import logger

logger.trace("Executing program")
logger.debug("Processing data...")
logger.info("Server started successfully.")
logger.success("Data processing completed successfully.")
logger.warning("Invalid configuration detected.")
logger.error("Failed to connect to the database.")
logger.critical("Unexpected system error occurred. Shutting down.")
默认配置将半结构化和彩色化的输出记录到标准错误。它还默认将 DEBUG 作为最低级别,这也解释了为什么 TRACE 输出不会被记录。
自定义日志记录器
通过 add() 函数,可以轻松定制 Loguru 的内部工作机制,该函数可处理从日志格式化到日志目的地设置等一切操作。例如,您可以将日志记录到标准输出,将默认级别更改为 INFO,并使用下面的配置将日志格式化为 JSON:
from loguru import logger
import sys

logger.remove(0) # remove the default handler configuration
logger.add(sys.stdout, level="INFO", serialize=True)

. . .
{"text": "2023-07-17 15:26:21.597 | INFO | __main__:<module>:9 - Server started successfully.\n", "record": {"elapsed": {"repr": "0:00:00.006401", "seconds": 0.006401}, "exception": null, "extra": {}, "file": {"name": "main.py", "path": "/home/ayo/dev/betterstack/demo/python-logging/main.py"}, "function": "<module>", "level": {"icon": "ℹ️", "name": "INFO", "no": 20}, "line": 9, "message": "Server started successfully.", "module": "main", "name": "__main__", "process": {"id": 3852028, "name": "MainProcess"}, "thread": {"id": 140653618894656, "name": "MainThread"}, "time": {"repr": "2023-07-17 15:26:21.597156+02:00", "timestamp": 1689600381.597156}}}
Loguru 生成的默认 JSON 输出可能相当冗长,但使用类似这样的自定义函数可以轻松地将日志信息序列化:
from loguru import logger
import sys
import json

def serialize(record):
    subset = {
        "timestamp": record["time"].timestamp(),
        "message": record["message"],
        "level": record["level"].name,
        "file": record["file"].name,
        "context": record["extra"],
    }
    return json.dumps(subset)

def patching(record):
    record["extra"]["serialized"] = serialize(record)

logger.remove(0)

logger = logger.patch(patching)
logger.add(sys.stderr, format="{extra[serialized]}")

logger.bind(user_id="USR-1243", doc_id="DOC-2348").debug("Processing document")
{"timestamp": 1689601339.628792, "message": "Processing document", "level": "DEBUG", "file": "main.py", "context": {"user_id": "USR-1243", "doc_id": "DOC-2348"}}
Loguru 也完全支持上下文日志记录。您已经看到上面的 bind() 方法,它允许在 log point 添加上下文数据。
您还可以使用 bind() 方法来创建子记录器来记录共享相同上下文的记录:
child = logger.bind(user_id="USR-1243", doc_id="DOC-2348")
child.debug("Processing document")
child.warning("Invalid configuration detected. Falling back to defaults")
child.success("Document processed successfully")
请注意,user_id 和 doc_id 字段出现在所有三条记录中:
{"timestamp": 1689601518.884659, "message": "Processing document", "level": "DEBUG", "file": "main.py", "context": {"user_id": "USR-1243", "doc_id": "DOC-2348"}}

{"timestamp": 1689601518.884706, "message": "Invalid configuration detected. Falling back to defaults", "level": "WARNING", "file": "main.py", "context": {"user_id": "USR-1243", "doc_id": "DOC-2348"}}

{"timestamp": 1689601518.884729, "message": "Document processed successfully", "level": "SUCCESS", "file": "main.py", "context": {"user_id": "USR-1243", "doc_id": "DOC-2348"}}
另一方面,它的 contextualize() 方法可以轻松地为特定范围或上下文中的所有日志记录添加上下文字段。例如,下面的代码段演示了将唯一的请求 ID 属性添加到因该请求而创建的所有日志中:
from loguru import logger
import uuid

def logging_middleware(get_response):
    def middleware(request):
        request_id = str(uuid.uuid4())

        with logger.contextualize(request_id=request_id):
            response = get_response(request)
            response["X-Request-ID"] = request_id
            return response

    return middleware
Loguru 还支持优秀日志框架所应具备的所有功能,如通过自动旋转和压缩将日志记录到文件、自定义日志级别、异常处理、同时记录到多个目的地等。它还为来自标准logging模块的用户提供了迁移指南。
请参阅Loguru 官方文档和我们专用 Loguru 指南,了解有关使用 Loguru 为 Python 应用程序创建production-ready日志设置的更多信息。
3. Structlog
Structlog 是一个日志库,专门用于生成 JSON 或 Logfmt 格式的结构化输出。它支持为开发环境提供彩色、美观的控制台输出,也允许完全自定义日志格式,以满足不同需求。你可以使用下面的命令安装 Structlog 软件包:
$ pip install structlog
Structlog 最简单的用法是调用 get_logger()方法,然后在生成的logger上使用任何level方法:
import structlog

logger = structlog.get_logger()

logger.debug("Database query executed in 0.025 seconds")
logger.info(
    "Processing file 'data.csv' completed. 1000 records were imported",
    file="data.csv",
    elapsed_ms=300,
    num_records=1000,
)
logger.warning(
    "Unable to load configuration file 'config.ini'. Using default settings instead",
    file="config.ini",
)

try:
    1 / 0
except ZeroDivisionError as e:
    logger.exception(
        "Division by zero error occurred during calculation. Check the input values",
        exc_info=e,
    )
logger.critical("Application crashed due to an unhandled exception")
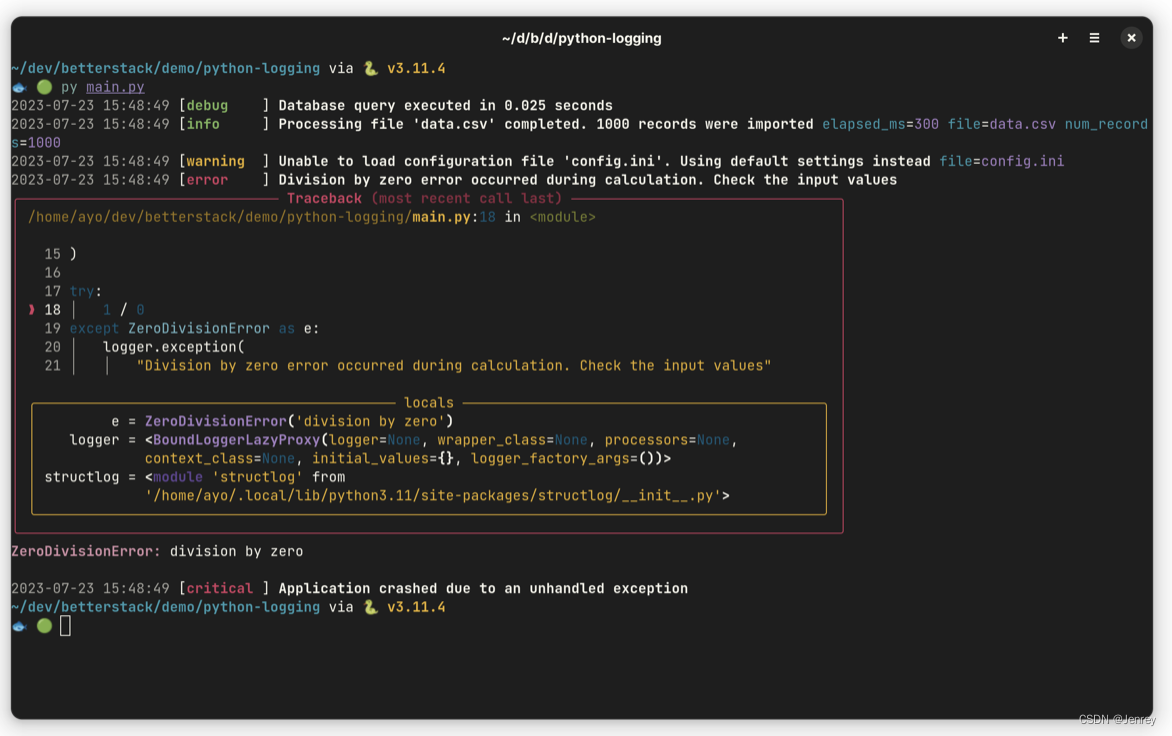
Structlog 日志记录器的默认配置对开发环境非常友好。输出是彩色的,任何包含的上下文数据都以 key=value 对的形式出现。此外,tracebacks的格式和organized都很整齐,因此更容易发现问题的原因。
Structlog 的独特之处在于,它不会按levels去过滤记录。这就是为什么上面所有的levels都被写入控制台的原因。不过,通过 configure() 方法配置默认级别也很简单,如下所示:
import structlog
import logging

structlog.configure(wrapper_class=structlog.make_filtering_bound_logger(logging.INFO))
Structlog 与标准logging模块中的日志级别兼容,因此可以使用上述 logging.INFO 常量。你也可以直接使用与级别相关的数字:
structlog.configure(wrapper_class=structlog.make_filtering_bound_logger(20))
get_logger()函数返回的日志记录器称为绑定日志记录器,因为您可以将上下文值与之绑定。一旦绑定了key/value pairs,它们将包含在日志记录器生成的每个后续日志条目中。
import structlog
import platform

logger = structlog.get_logger()

logger = logger.bind(python_version=platform.python_version(), os="linux")

. . .
2023-07-23 17:20:10 [debug] Database query executed in 0.025 seconds os=linux python_version=3.11.4

2023-07-23 17:20:10 [info] Processing file 'data.csv' completed. 1000 records were imported elapsed_ms=300 file=data.csv num_records=1000 os=linux python_version=3.11.4
绑定日志记录器还包括一系列处理器函数,可在日志记录通过日志记录管道时对日志记录进行转换和丰富。例如,您可以使用以下配置以 JSON 格式记录日志:
import structlog
import platform

structlog.configure(
    processors=[
        structlog.processors.TimeStamper(fmt="iso"),
        structlog.processors.add_log_level,
        structlog.processors.JSONRenderer(),
    ]
)

. . .
每个处理器都按照声明顺序执行,因此首先调用 TimeStamper() 为每个条目添加 ISO-8601 格式的时间戳,然后通过 add_log_level 添加严重级别,最后调用 JSONRenderer() 将整个记录序列化为 JSON 格式。对程序进行高亮显示的修改后,您将看到以下输出:
{"python_version": "3.11.4", "os": "linux", "event": "Database query executed in 0.025 seconds", "timestamp": "2023-07-23T15:32:21.590688Z", "level": "debug"}

{"python_version": "3.11.4", "os": "linux", "file": "data.csv", "elapsed_ms": 300, "num_records": 1000, "event": "Processing file 'data.csv' completed. 1000 records were imported", "timestamp": "2023-07-23T15:32:21.590720Z", "level": "info"}
Structlog 能做的另一件很酷的事情是自动格式化tracebacks,使其也以 JSON 格式序列化。你只需要像这样使用 dict_tracebacks 处理器:
structlog.configure(
    processors=[
        structlog.processors.TimeStamper(fmt="iso"),
        structlog.processors.add_log_level,
        structlog.processors.dict_tracebacks,
        structlog.processors.JSONRenderer(),
    ]
)
每当记录异常情况时,你会发现记录中的异常情况信息格式非常丰富,便于在日志管理服务中进行分析。
{"python_version": "3.11.4", "os": "linux", "event": "Division by zero error occurred during calculation. Check the input values", "timestamp": "2023-07-23T16:07:50.127241Z", "level": "error", "exception": [{"exc_type": "ZeroDivisionError", "exc_value": "division by zero", "syntax_error": null, "is_cause": false, "frames": [{"filename": "/home/ayo/dev/betterstack/demo/python-logging/main.py", "lineno": 32, "name": "<module>", "line": "", "locals": {"__name__": "__main__", "__doc__": "None", "__package__": "None", "__loader__": "<_frozen_importlib_external.SourceFileLoader object at 0x7fdb22df2ed0>", "__spec__": "None", "__annotations__": "{}", "__builtins__": "<module 'builtins' (built-in)>", "__file__": "/home/ayo/dev/betterstack/demo/python-logging/main.py", "__cached__": "None", "structlog": "\"<module 'structlog' from '/home/ayo/.local/lib/python3.11/site-packages/structlo\"+15", "platform": "<module 'platform' from '/usr/lib64/python3.11/platform.py'>", "logging": "<module 'logging' from '/usr/lib64/python3.11/logging/__init__.py'>", "logger": "\"<BoundLoggerFilteringAtDebug(context={'python_version': '3.11.4', 'os': 'linux'}\"+249", "e": "ZeroDivisionError('division by zero')"}}]}]}
这里只介绍了 Structlog 所提供的常用功能,因此请务必查看其文档以了解更多信息。
4. Eliot
Eliot 是一种独特的 Python 日志解决方案,它不仅能记录程序中发生的事件,还能输出导致事件发生的行为因果链。使用 pip 安装 Eliot 的方法如下:
$ pip install eliot
Eliot 的一个关键概念是 “动作”(action),它代表任何可以开始并成功完成或因异常而失败的任务。当你启动一个动作时,会产生两条日志记录:一条用来表示action的开始,另一条用来表示action的成功或失败。演示此模型的最佳方式是举例说明:
import sys
from eliot import start_action, to_file

to_file(sys.stdout)


def calculate(x, y):
    with start_action(action_type="multiply"):
        return x * y


calculate(10, 5)
这里使用start_action函数来表示一个新action的开始。一旦执行calculate()函数,两个日志就会被发送到to_file()配置的目的地:
{"action_status": "started", "timestamp": 1690213156.7701144, "task_uuid": "a9a47808-15a9-439b-8335-b88d50013f75", "action_type": "multiply", "task_level": [1]}

{"action_status": "succeeded", "timestamp": 1690213156.7701554, "task_uuid": "a9a47808-15a9-439b-8335-b88d50013f75", "action_type": "multiply", "task_level": [2]}
Eliot 默认生成结构化的 JSON 输出,其中包括以下记录:
task_uuid: 生成消息的唯一任务标识符。action_status: 表示action的状态。timestamp: 信息的 UNIX 时间戳。task_level: 信息在actions树中的位置。action_type: 提供的action_type参数。
您可以向action的开始消息和成功消息添加其他字段,如下所示:
def calculate(x, y):
    # additional fields here are added to the start message of the action alone
    with start_action(action_type="multiply", x=x, y=y) as action:
        result = x * y
        # fields added here show up only in the success message of the action
        action.add_success_fields(result=result)
        return result
{"x": 10, "y": 5, "action_status": "started", "timestamp": 1690213820.4083755, "task_uuid": "09df3632-96d2-4dd8-b782-1926cd87ccc9", "action_type": "multiply", "task_level": [1]}

{"result": 50, "action_status": "succeeded", "timestamp": 1690213820.4084144, "task_uuid": "09df3632-96d2-4dd8-b782-1926cd87ccc9", "action_type": "multiply", "task_level": [2]}
另一种记录函数的输入和结果的方法是通过log_call装饰器:
from eliot import log_call, to_file

to_file(sys.stdout)

@log_call
def calculate(x, y):
    return x * y

calculate(10, 5)
在这种情况下,action_type 将是模块和函数名称的连接,但其余字段将与之前相同:
{"x": 10, "y": 5, "action_status": "started", "timestamp": 1690214038.799868, "task_uuid": "2c78b304-12a1-474a-8b95-e80deadb8dde", "action_type": "__main__.calculate", "task_level": [1]}

{"result": 50, "action_status": "succeeded", "timestamp": 1690214038.7999015, "task_uuid": "2c78b304-12a1-474a-8b95-e80deadb8dde", "action_type": "__main__.calculate", "task_level": [2]}
您可以通过更改 action_type 字段并排除某些参数或结果来自定义 log_call 装饰器的行为:
@log_call(action_type="CALC", include_args=["x"], include_result=False)
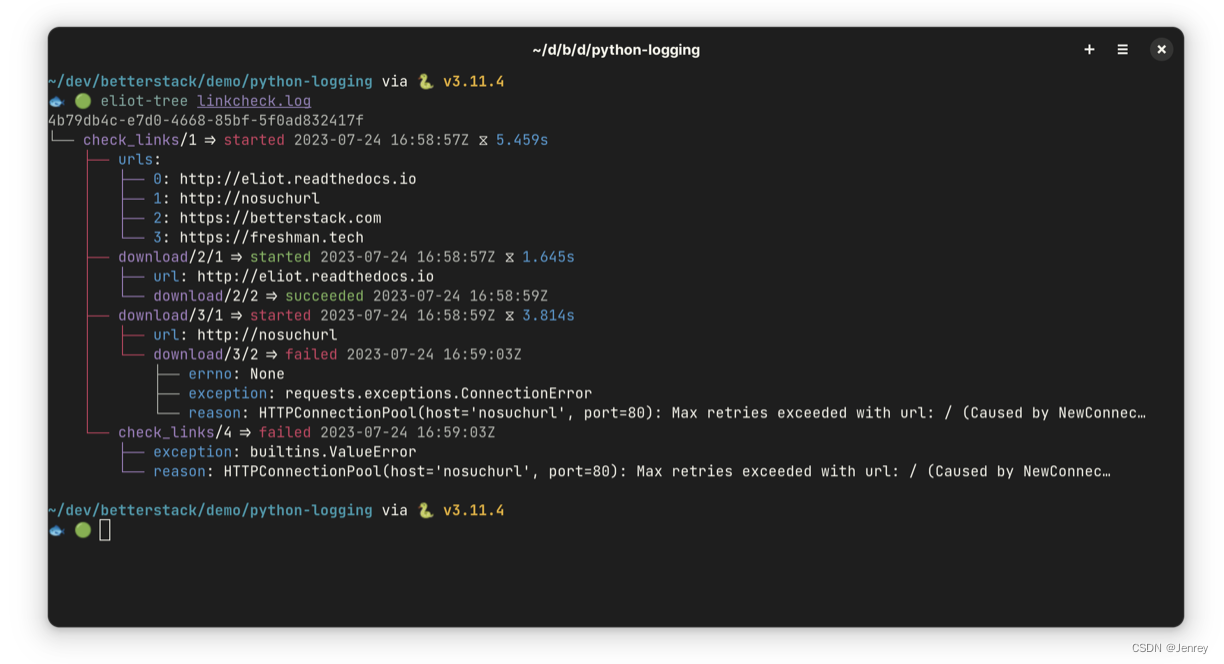
如果在某个action的上下文中检测到uncaught exception,该操作将被标记为失败,并将记录一条异常消息,而不是成功消息:
import sys
from eliot import log_call, to_file

to_file(sys.stdout)

@log_call
def calculate(x, y):
    return x / y

try:
    calculate(1, 0)
except ZeroDivisionError as e:
    print("division by zero detected")
您现在看到的不是成功信息,而是一条exception信息,并附有reason:
{"x": 1, "y": 0, "action_status": "started", "timestamp": 1690215830.1103916, "task_uuid": "f267b0f5-8c07-4828-a973-0a8a273f272d", "action_type": "__main__.calculate", "task_level": [1]}

{"exception": "builtins.ZeroDivisionError", "reason": "division by zero", "action_status": "failed", "timestamp": 1690215830.1104264, "task_uuid": "f267b0f5-8c07-4828-a973-0a8a273f272d", "action_type": "__main__.calculate", "task_level": [2]}
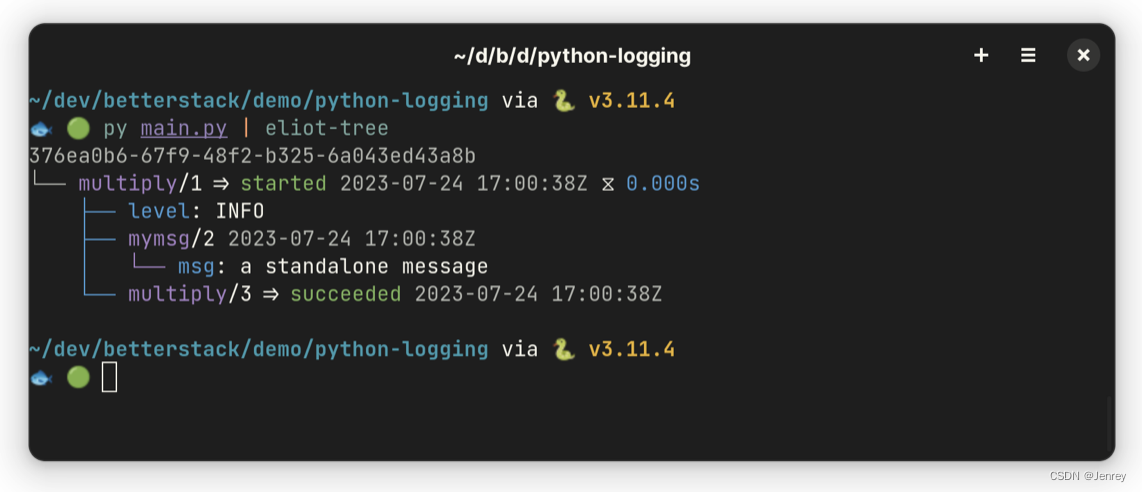
当您需要在action的上下文中记录独立的消息时,可以使用log方法,如下所示:
def calculate(x, y):
    with start_action(action_type="multiply") as ctx:
        ctx.log(message_type="mymsg", msg="a standalone message")
        return x * y
{"msg": "a standalone message", "timestamp": 1690217318.2063951, "task_uuid": "500b06e6-c0ba-42b4-9d6c-466ea3f1634d", "task_level": [2], "message_type": "mymsg"}
Eliot没有 log levels 的概念,因此只能在需要时手动添加level字段:
def calculate(x, y):
    with start_action(action_type="multiply", level="INFO") as ctx:
        ctx.log(message_type="mymsg", msg="a standalone message", level="INFO")
        return x * y
Eliot 的另一项出色功能是通过 eliot-tree 命令行工具实现日志可视化。
$ pip install eliot-tree
安装 eliot -tree 后,您可以将 Eliot 生成的 JSON 日志通过管道传输到命令,如下所示:
$ python main.py | eliot-tree
如果你将日志记录到文件,可以将这个文件作为参数传递给工具:
$ eliot-tree <file>
Eliot的内容远不止于此,因此请务必查看其文档以了解更多信息。
5. Logbook
Logbook 自称是 Python 标准库logging模块的酷炫替代品,其目的是让日志记录变得有趣。你可以使用以下命令将其安装到你的项目中:
$ pip install logbook
开始使用 Logbook 也非常简单:
import sys
import logbook

logger = logbook.Logger(__name__)

handler = logbook.StreamHandler(sys.stdout, level="INFO")
handler.push_application()

logger.info("Successfully connected to the database 'my_db' on host 'ubuntu'")

logger.warning("Detected suspicious activity from IP address: 111.222.333.444")
[2023-07-24 21:41:50.932575] INFO: __main__: Successfully connected to the database 'my_db' on host 'ubuntu'

[2023-07-24 21:41:50.932623] WARNING: __main__: Detected suspicious activity from IP address: 111.222.333.444
如上图所示,logbook.Logger 方法用于创建一个新的 logger channel。该 logger provides 提供了对 info() 和 warning() 等级别方法的访问,用于写入日志信息。支持logging模块中的所有日志levels,并增加了介于 INFO 和 WARNING 之间的 NOTICE 级别。
Logbook 还使用Handler概念来确定日志的目的地和格式。StreamHandler 类可将日志发送到任何输出流(本例中为标准output),其他处理程序可将日志发送到文件、Syslog、Redis、Slack 等。
不过,与标准logging模块不同的是,我们不鼓励你直接在日志记录器上注册handlers。相反,你应该分别通过 push_application()、push_thread() 和 push_greenlet() 方法将处理程序绑定到process、thread或 greenlet stack中。相应的 pop_application()、pop_thread() 和 pop_greenlet() 方法用于取消处理程序的注册:
handler = MyHandler()
handler.push_application()
# everything logged here here goes to that handler
handler.pop_application()
您还可以在 with-block 的持续时间内绑定一个handler。这样可以确保在块内创建的日志只发送给指定的handler:
with handler.applicationbound():
    logger.info(...)

with handler.threadbound():
    logger.info(...)

with handler.greenletbound():
    logger.info(...)
日志格式化也是通过handlers完成的。为此,每个处理程序都有一个 format_string 属性,它接受 LogRecord 类的属性:
import sys
import logbook

logger = logbook.Logger(__name__)

handler = logbook.StreamHandler(sys.stdout, level="INFO")
handler.format_string = "{record.channel} | {record.level_name} | {record.message}"
handler.push_application()

logger.info("Successfully connected to the database 'my_db' on host 'ubuntu'")

logger.warning("Detected suspicious activity from IP address: 111.222.333.444")
__main__ | INFO | Successfully connected to the database 'my_db' on host 'ubuntu'
__main__ | WARNING | Detected suspicious activity from IP address: 111.222.333.444
遗憾的是,Logbook 的任何内置处理程序都不支持结构化日志记录。您必须通过自定义处理程序自行实现。有关详细信息,请参阅 Logbook 文档。
6. Picologging
Mirosoft 的 Picologging 库是 Python 日志生态系统的一个相对较新的补充。如其 GitHub Readme 所述,它被定位为标准日志模块的高性能直接替代品,速度可显著提高 4-10 倍。要将其集成到你的项目中,你可以用以下命令安装它:
$ pip install picologging
Picologging 与 Python 中的logging模块共享相同的熟悉的 API,并且使用相同的日志记录属性进行格式化:
import sys
import picologging as logging

logger = logging.getLogger(__name__)
logger.setLevel(logging.INFO)

stdout_handler = logging.StreamHandler(sys.stdout)
fmt = logging.Formatter(
    "%(name)s: %(asctime)s | %(levelname)s | %(process)d >>> %(message)s"
)

stdout_handler.setFormatter(fmt)
logger.addHandler(stdout_handler)

logger.info(
    "Successfully connected to the database '%s' on host '%s'", "my_db", "ubuntu20.04"
)

logger.warning("Detected suspicious activity from IP address: %s", "111.222.333.444")
__main__: 2023-07-24 05:46:38,-2046715687 | INFO | 795975 >>> Successfully connected to the database 'my_db' on host 'ubuntu20.04'
__main__: 2023-07-24 05:46:38,-2046715687 | WARNING | 795975 >>> Detected suspicious activity from IP address: 111.222.333.444
Picologging 的文档强调,它目前还处于早期开发阶段,因此应暂缓在生产中使用。不过,根据这些benchmarks,Picologging 在提高标准日志模块的性能方面已经显示出了一定的前景。有关其功能和限制的更多信息,请参阅文档。
最后的想法
在 Python 中使用日志记录时,我们的主要推荐是使用 Loguru,因为它具有令人印象深刻的功能和用户友好的 API。不过,熟悉built-in logging 模块也很重要,因为它仍然是一个功能强大、使用广泛的解决方案。
Structlog 是另一个值得考虑的强大选项,Eliot 也可能是一个不错的选择,只要它缺乏日志级别并不是您的用例的主要问题。另一方面,Picologging 目前还处于早期开发阶段,而 Logbook 缺乏对结构化日志记录的原生支持,因此不太适合在生产环境中进行日志记录。