vue+leaflet笔记之地图量测
文章目录
- vue+leaflet笔记之地图量测
- 开发环境
- 代码简介
- 插件简介与安装
- 使用简介
- 图形量测
- 动态量测
- 详细源码(Vue3)
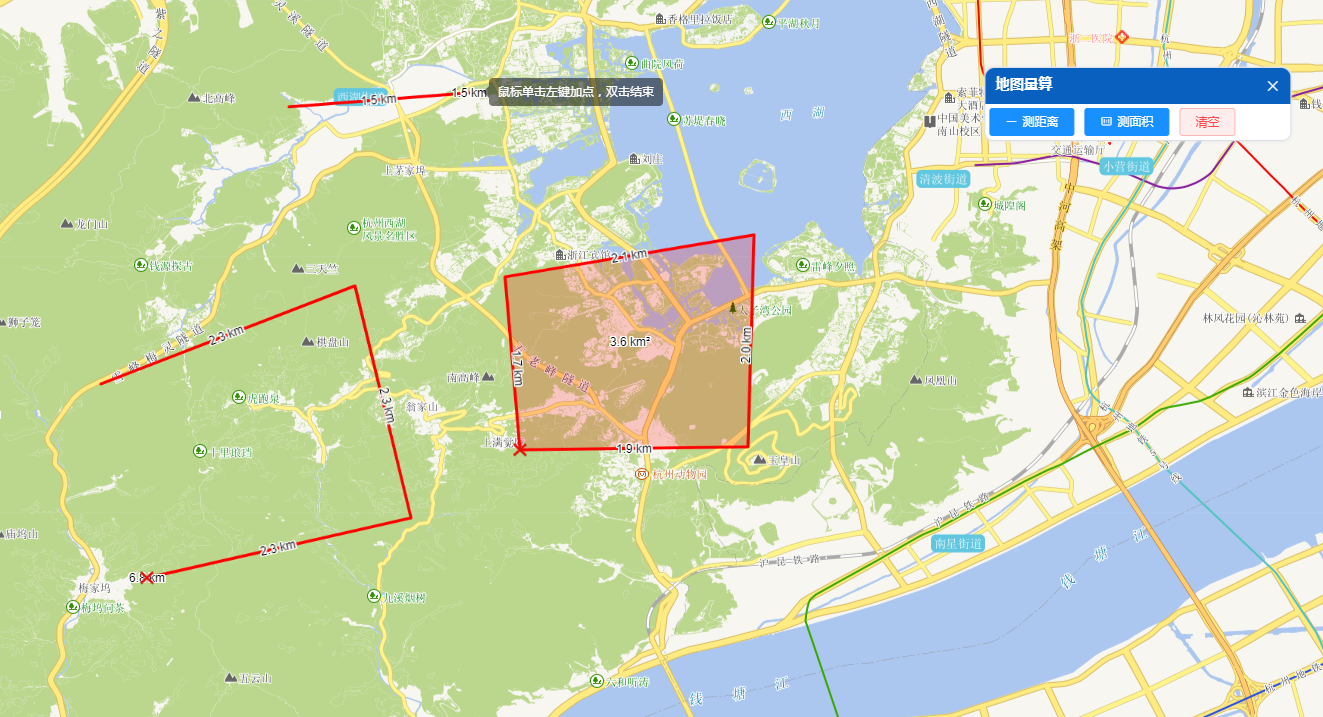
本文介绍了Web端使用Leaflet开发库进行距离量测的一种方法 (底图来源:天地图),结合leaflet-measure-path插件能够快速的实现地图量测功能。显示效果如下图所示。
开发环境
Vue开发库:3.2.37 & Leaflet开发库:1.9.3
Leaflet主要插件:leaflet-measure-path
代码简介
插件简介与安装
leaflet-measure-path是一个在路径的上显示测量结果的插件(目前支持线、面和圆圈),优点是简单易用,缺点是线要素的长度信息标注在最后一个点的位置觉得不太合理,测量精度的话勉强够用。
官方文档 https://github.com/ProminentEdge/leaflet-measure-path
# 插件安装
npm i leaflet-measure-path
# 插件安装(国内镜像,速度较快)
npm --registry https://registry.npm.taobao.org install leaflet-measure-path
# 引入地图量测插件 leaflet-measure-path
import 'leaflet-measure-path/leaflet-measure-path.css'
import 'leaflet-measure-path/leaflet-measure-path.js'
使用简介
图形量测
创建一些基础图形,然后利用leaflet-measure-path中的方法和属性,对图形进行量测,效果如下图所示 。

// 创建一个矢量面,并显示多边形的测量值
let polygon = L.polygon([[57.69, 11.89], [57.697, 11.88], [57.71, 11.89], [57.71, 11.91], [57.69, 11.91]], { showMeasurements: true }).addTo(map);
// 创建一个矢量面,当光标悬停在多边形上时,显示测量值的多边形
let polygonWithHover = L.polygon([[57.668, 11.89], [57.675, 11.88], [57.688, 11.89], [57.688, 11.91], [57.668, 11.91]], { showMeasurements: true, measurementOptions: { showOnHover: true } }).addTo(map);
// 创建一条折线,并显示测量值(对测量值格式化)
L.polyline([[57.67, 11.85], [57.677, 11.86], [57.68, 11.85], [57.69, 11.86],],
  {
    showMeasurements: true, color: 'green', measurementOptions: {
      showTotalDistance:false,
      formatDistance: function valFormat(val) {
        // 测量值保留一位小数
        return '测量值:' + val.toFixed(1)
      }
    }
  }).addTo(map);
// 创建一个圆,并显示测量值
let circle = L.circle([57.699, 11.86], {
  color: 'red',
  fillColor: '#f03',
  fillOpacity: 0.5,
  radius: 300,
  showMeasurements: true,
}).addTo(map);
此外,measurementOptions还提供了几个别的属性:
| 属性 | 默认值 | 说明 | 备注 |
|---|---|---|---|
| showOnHover: Boolean | false | 为true时,当用户将光标悬停在图形上时,测量值才会显示 | |
| showTotalDistance: Boolean | true | 为false时,则不会显示多段线的总长度 | |
| minDistance: Number | 30 | 线段测量时,要素中的线段必须具有的最小长度 | 实测,不生效 |
| formatDistance: Function | / | 覆盖内置函数,该函数以米为单位格式化地图中显示的字符串的距离 | 对显示测量值格式化 |
| formatArea: Function | / | 覆盖内置函数,该函数将面积(平方米)格式化为地图中显示的字符串 | 对显示测量值格式化 |
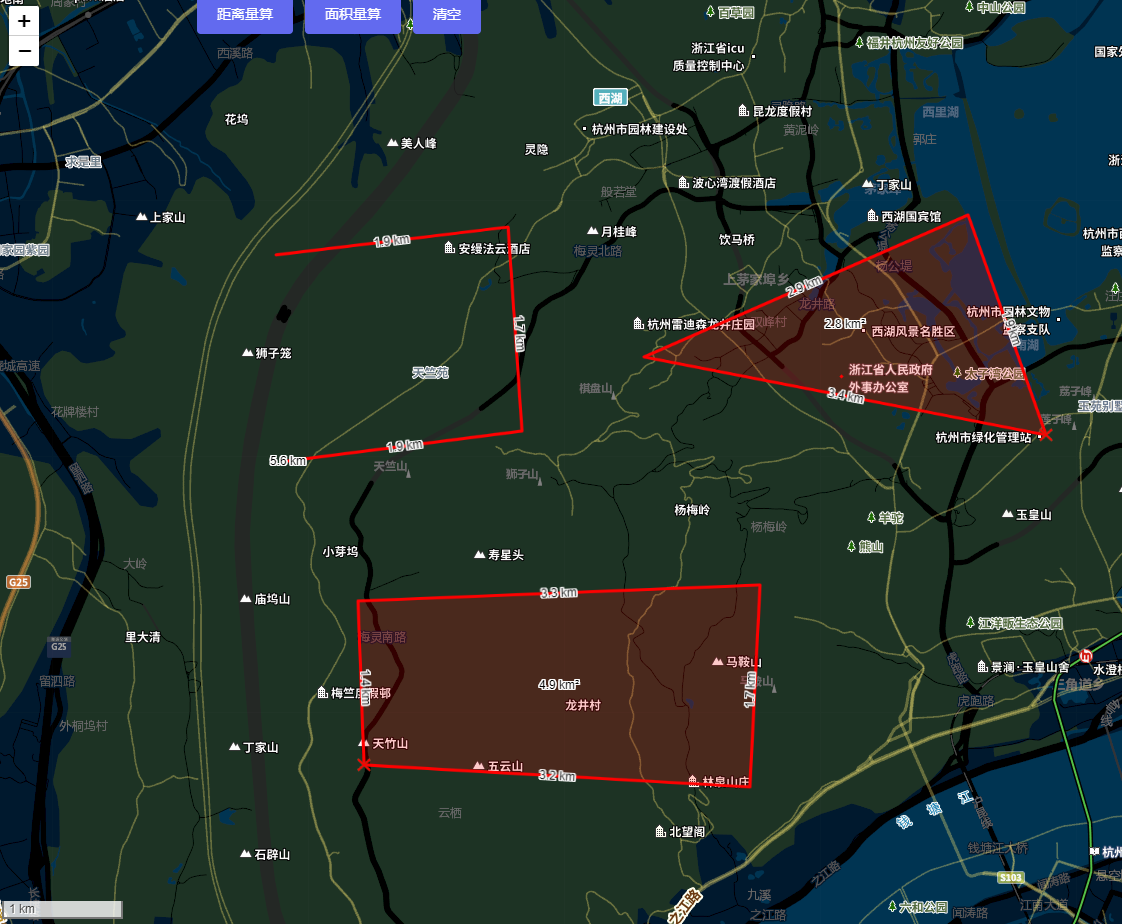
动态量测
在地图上动态绘制线或面,进行长度或面积的量测。
详细源码(Vue3)
源代码下载地址 链接:https://pan.baidu.com/s/1axmOSj3cc8ve26_aODISeg?pwd=GIS6
提取码:GIS6
<template>
  <div class="app-contain">
    <!-- leaflet 地图容器 -->
    <div id="myMap"></div>
    <div class="controls">
      <el-button color="#626aef" @click="handMeasureDistance()">距离量算</el-button>
      <el-button color="#626aef" @click="handMeasureArea()">面积量算</el-button>
      <el-button color="#626aef" @click="handMeasureClear()">清空</el-button>
    </div>
  </div>
</template>

<script setup>
// 引入本地标记图片
import deleteIconUrl from '/@/assets/images/deleteIcon.png'
// 引入样式
import L from 'leaflet';
import 'leaflet/dist/leaflet.css'

// 鼠标提示控件
import './store/MouseTips'
import './store/MouseTips.css'
// 引入地图量测插件 leaflet-measure-path
import 'leaflet-measure-path/leaflet-measure-path.css'
import 'leaflet-measure-path/leaflet-measure-path.js'
// 标记点
let deleteIcon = L.icon({
  iconUrl: deleteIconUrl,
  iconSize: [14, 14], // 图标大小
  iconAnchor: [7, 7], // 图标偏移量,否则无法居住显示
});
import { onMounted } from 'vue'
// 天地图TK
let tdtKey = 'YOURS_TK'
// 地图
let map = null;
// 创建鼠标提示控件
let mouseTips = L.control.mouseTips({
  show: true,
  message: '鼠标单击左键加点,双击结束'
});
// 距离测量方法
let distanceMeasure = {
  points: [],
  color: "red",
  layers: L.layerGroup(),
  polyline: null,
  polylineGroup: [],
  marker: null,
  markerGroup: [],
  init: function () {
    distanceMeasure.points = [];
    distanceMeasure.polyline = null;
    distanceMeasure.marker = null;
    map.on('click', distanceMeasure.click).on('dblclick', distanceMeasure.dblclick);
  },
  click: function (e) {
    map.doubleClickZoom.disable();
    // 添加点信息
    distanceMeasure.points.push(e.latlng);
    // 添加线
    map.on('mousemove', distanceMeasure.mousemove);
  },
  mousemove: function (e) {
    distanceMeasure.points.push(e.latlng);
    if (distanceMeasure.polyline)
      map.removeLayer(distanceMeasure.polyline);
    distanceMeasure.polyline = L.polyline(distanceMeasure.points, { showMeasurements: true, color: distanceMeasure.color });
    distanceMeasure.polyline.addTo(distanceMeasure.layers);
    distanceMeasure.layers.addTo(map);
    distanceMeasure.points.pop();
  },
  dblclick: function (e) { // 双击结束
    // 移除鼠标绘制提示
    mouseTips.hide()
    distanceMeasure.polyline.addTo(distanceMeasure.layers);
    distanceMeasure.polylineGroup.push(distanceMeasure.polyline)
    map.off('click', distanceMeasure.click).off('mousemove', distanceMeasure.mousemove).off('dblclick', distanceMeasure.dblclick);
  },
  destory: function () {
    if (distanceMeasure.polyline) {
      // map.removeLayer(distanceMeasure.polyline);
      distanceMeasure.polylineGroup.forEach(element => {
        map.removeLayer(element);
      });
    }

    if (distanceMeasure.marker) {
      // distanceMeasure.marker.remove();
      distanceMeasure.markerGroup.forEach(element => {
        element.remove()
      })
    }

  }
}
// 面积测量方法
let areaMeasure = {
  points: [],
  color: "red",
  layers: L.layerGroup(),
  polygon: null,
  polygonGroup: [],
  marker: null,
  markerGroup: [],
  init: function () {
    areaMeasure.points = [];
    areaMeasure.polygon = null;
    areaMeasure.marker = null;
    map.on('click', areaMeasure.click).on('dblclick', areaMeasure.dblclick);
  },
  close: function (latlng) {
    areaMeasure.marker = L.marker(latlng, { icon: deleteIcon }).addTo(map).on("click", function (e) {
      if (areaMeasure.polygon)
        map.removeLayer(areaMeasure.polygon);

      if (areaMeasure.marker)
        areaMeasure.marker.remove();
    });
    areaMeasure.markerGroup.push(areaMeasure.marker);
  },
  click: function (e) {
    map.doubleClickZoom.disable();
    // 添加点信息
    areaMeasure.points.push(e.latlng);
    // 添加面
    map.on('mousemove', areaMeasure.mousemove);
  },
  mousemove: function (e) {
    areaMeasure.points.push(e.latlng);
    if (areaMeasure.polygon)
      map.removeLayer(areaMeasure.polygon);
    areaMeasure.polygon = L.polygon(areaMeasure.points, { showMeasurements: true, color: areaMeasure.color });
    areaMeasure.polygon.addTo(areaMeasure.layers);
    areaMeasure.layers.addTo(map);
    areaMeasure.points.pop();
  },
  dblclick: function (e) { // 双击结束
    // 移除鼠标绘制提示
    mouseTips.hide()
    areaMeasure.polygon.addTo(areaMeasure.layers);
    areaMeasure.polygonGroup.push(areaMeasure.polygon)
    areaMeasure.close(e.latlng);
    map.off('click', areaMeasure.click).off('mousemove', areaMeasure.mousemove).off('dblclick', areaMeasure.dblclick);
  },
  destory: function () {
    if (areaMeasure.polygon) {
      areaMeasure.polygonGroup.forEach(element => {
        map.removeLayer(element);
      });
    }
    if (areaMeasure.marker) {
      areaMeasure.markerGroup.forEach(element => {
        element.remove()
      })
    }

  }
}
// 地图初始化
const initMap = () => {
  //影像地图
  const sourceMap = L.tileLayer(`https://map.geoq.cn/ArcGIS/rest/services/ChinaOnlineStreetPurplishBlue/MapServer/tile/{z}/{y}/{x}`)
  // 注记
  const tiandituText = L.tileLayer(`http://t0.tianditu.gov.cn/cia_w/wmts?SERVICE=WMTS&REQUEST=GetTile&VERSION=1.0.0&LAYER=cia&STYLE=default&TILEMATRIXSET=w&FORMAT=tiles&TILEMATRIX={z}&TILEROW={y}&TILECOL={x}&tk=${tdtKey}`)
  const layers = L.layerGroup([sourceMap, tiandituText])
  map = L.map('myMap', {  //需绑定地图容器div的id
    attributionControl: false,
    zoomControl: true, // 显示缩放控件
    // 最小显示等级
    minZoom: 1,
    // 最大显示等级
    maxZoom: 18,
    crs: L.CRS.EPSG3857,//设置坐标系类型  EPSG3857伪墨卡托投影
    scrollWheelZoom: true, //默认开启鼠标滚轮缩放
    // 限制显示地理范围
    maxBounds: L.latLngBounds(L.latLng(-90, -180), L.latLng(90, 180)),
    // 限制显示地理范围
    layers: [layers] // 图层
  }).setView([30, 120], 6)
  // 添加比例尺
  L.control.scale({ maxWidth: 240, metric: true, imperial: false, position: 'bottomleft' }).addTo(map);
}
// 距离量测
const handMeasureDistance = () => {
  // 鼠标绘制提示
  mouseTips.addTo(map).show();
  distanceMeasure.init()
}
// 面积量测
const handMeasureArea = () => {
  // 鼠标绘制提示
  mouseTips.addTo(map).show();
  areaMeasure.init()
}
// 清空量测内容
const handMeasureClear = () => {
  // 鼠标绘制提示
  mouseTips.addTo(map).hide();
  // 销毁测量组件
  distanceMeasure.destory()
  areaMeasure.destory()
}
onMounted(() => {
  initMap()
})
</script>

<style scoped>
#myMap {
  width: 94vw;
  height: 96vh;
}

.controls {
  position: absolute;
  top: 0px;
  left: 200px;
  padding: 15px;
  z-index: 1000;
}
</style>