QChart还有专门画极坐标的类QPolarChart,它的界面是一个圆盘。
#include <QApplication>
#include <QDebug>
#include <QtCharts/QScatterSeries>
#include <QtCharts/QLineSeries>
#include <QtCharts/QPolarChart>
#include <QtCharts/QValueAxis>
#include <QtCharts/QChartView>
#include "mainwindow.h"
//[1]
QT_CHARTS_USE_NAMESPACE

int main(int argc, char *argv[])
{
    QApplication a(argc, argv);

    //曲线
    QLineSeries *seriesLine = new QLineSeries();
    seriesLine->setName("LinePolar");


    //图表
    QPolarChart *polarChart = new QPolarChart();
    polarChart->addSeries(seriesLine);
    polarChart->setTitle("First Polar Chart");

    //坐标轴
    QValueAxis *angleAxis = new QValueAxis();
    angleAxis->setTickCount(9);
    angleAxis->setLabelFormat("%d");
    //角度
    polarChart->addAxis(angleAxis, QPolarChart::PolarOrientationAngular);

    QValueAxis *radiusAxis = new QValueAxis();
    radiusAxis->setTickCount(9);
    radiusAxis->setLabelFormat("%d");
    //半径
    polarChart->addAxis(radiusAxis, QPolarChart::PolarOrientationRadial);

    seriesLine->attachAxis(radiusAxis);
    seriesLine->attachAxis(angleAxis);

    radiusAxis->setRange(0, 360); //设置半径范围
    angleAxis->setRange(0, 360);    //设置角度范围

    for (int i = 0; i <= 360; i += 10)
        seriesLine->append(i, (i / 360.0) * 360);

    QChartView *polarChartView = new QChartView();
    polarChartView->setChart(polarChart);

    MainWindow w;
    w.SetWidget(polarChartView);
    w.show();

    return a.exec();
}

setTickCount(int count)设置大刻度线的数目,默认是5,不能小于2。程序中设置的是9,但是数一下好像不对。setTickCount(4)换个4体验一下。对于半径,第4条线就是圆心,看不太出来。对于角度,第1条和第4条线会重合。

QPolarChart自带了一些主题,跟手机一样可以换主题,默认主题就是上面的效果,换个Dark主题:
polarChart->setTheme(QChart::ChartThemeDark); //设置主题
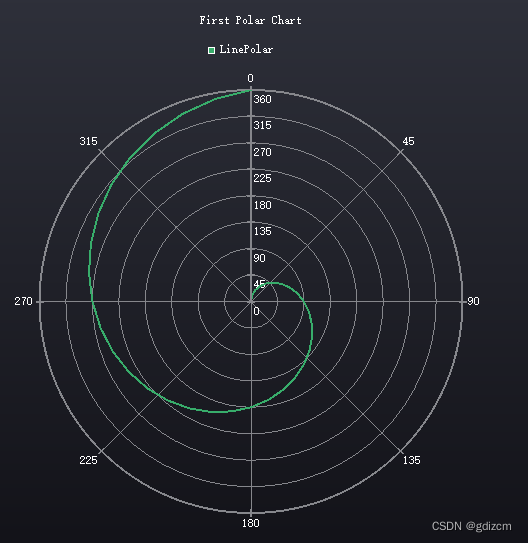
还有蓝色,棕色等其他主题,具体主题如下:
| 主题名 | 描述 |
| QChart::ChartThemeLight | The light theme, which is the default theme. |
| QChart::ChartThemeBlueCerulean | The cerulean blue theme. |
| QChart::ChartThemeDark | The dark theme. |
| QChart::ChartThemeBrownSand | The sand brown theme. |
| QChart::ChartThemeBlueNcs | The natural color system (NCS) blue theme. |
| QChart::ChartThemeHighContrast | The high contrast theme. |
| QChart::ChartThemeBlueIcy | The icy blue theme. |
| QChart::ChartThemeQt | The Qt theme. |
