机型M350RTK,其飞行记录文件为加密的,我的完善代码如下
git@github.com:huashu996/DJFlightRecordParsing2TXT.git
一、下载安装官方的DJIFlightRecord
git clone git@github.com:dji-sdk/FlightRecordParsingLib.git
飞行记录文件在打开【我的电脑】,进入遥控器内存,
文件路径:此电脑 > pm430 > 内部共享存储空间> DJI > com.dji.industry.pilot > FlightRecord
二、注册成为大疆开发者获取SDK 密钥
网址如下DJI Developer
注册完之后新建APP获得密钥
-
登录 DJI 开发者平台,点击"创建应用",App Type 选择 "Open API",自行填写“App 名称”“分类”和“描述”,点击 "创建"。
-
通过个人邮箱激活 App,在开发者网平台个人点击查看对应 App 信息,其中 App Key 即为下文所需的 SDK 密钥参数。

三、编译运行
编译
cd FlightRecordParsingLib-master/dji-flightrecord-kit/build/Ubuntu/FlightRecordStandardizationCpp
sh generate.sh
运行
cd ~/FlightRecordParsingLib-master/dji-flightrecord-kit/build/Ubuntu/FRSample
export SDK_KEY=your_sdk_key_value
./FRSample /home/cxl/FlightRecordParsingLib-master/DJrecord/DJIFlightRecord_2023-07-18_[16-14-57].txt
此时会在终端打印出一系列无人机的状态信息,但还是不能够使用
于是我更改了main.cc文件,使它能够保存数据到txt文件

四、获取单个数据
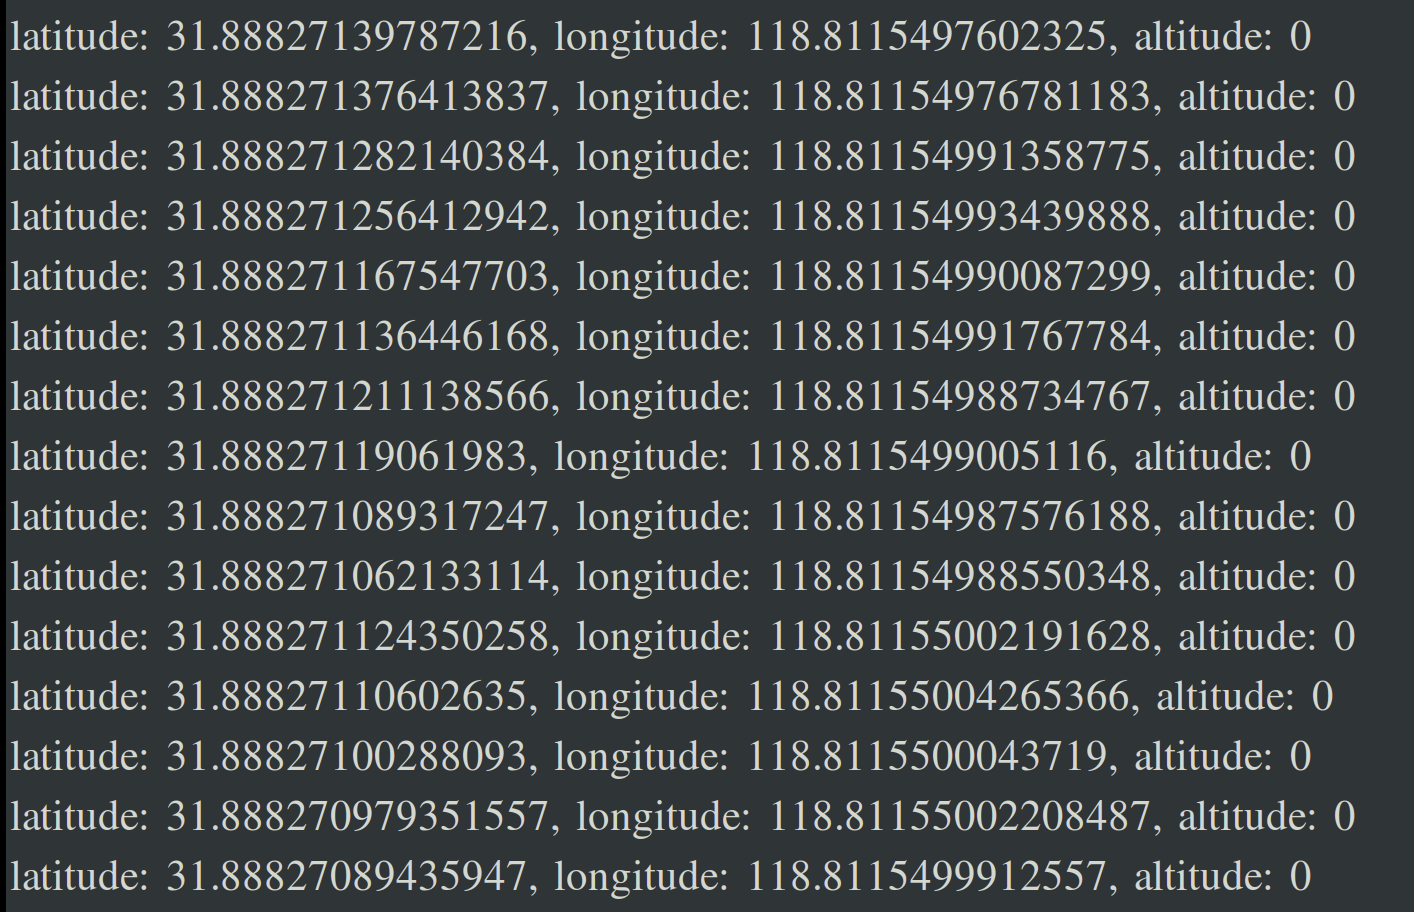
上一步生成的txt文件由于参数众多是巨大的,这里我写了一个py文件用于提取重要的信息,例如提取经纬度和高度
import json

# Read JSON fragment from txt file
with open("output.txt", "r") as file:
    json_data = json.load(file)

# Extract all "aircraftLocation" and "altitude" data
location_altitude_data = []
for frame_state in json_data["info"]["frameTimeStates"]:
    aircraft_location = frame_state["flightControllerState"]["aircraftLocation"]
    altitude = frame_state["flightControllerState"]["altitude"]
    location_altitude_data.append({"latitude": aircraft_location["latitude"], "longitude": aircraft_location["longitude"], "altitude": altitude})

# Write values to a new txt file
with open("xyz_output.txt", "w") as f:
    for data in location_altitude_data:
        f.write(f"latitude: {data['latitude']}, longitude: {data['longitude']}, altitude: {data['altitude']}\n")

print("Values extracted and written to 'output.txt' file.")
就能够生成只有这几个参数的txt文件
五、生成轨迹
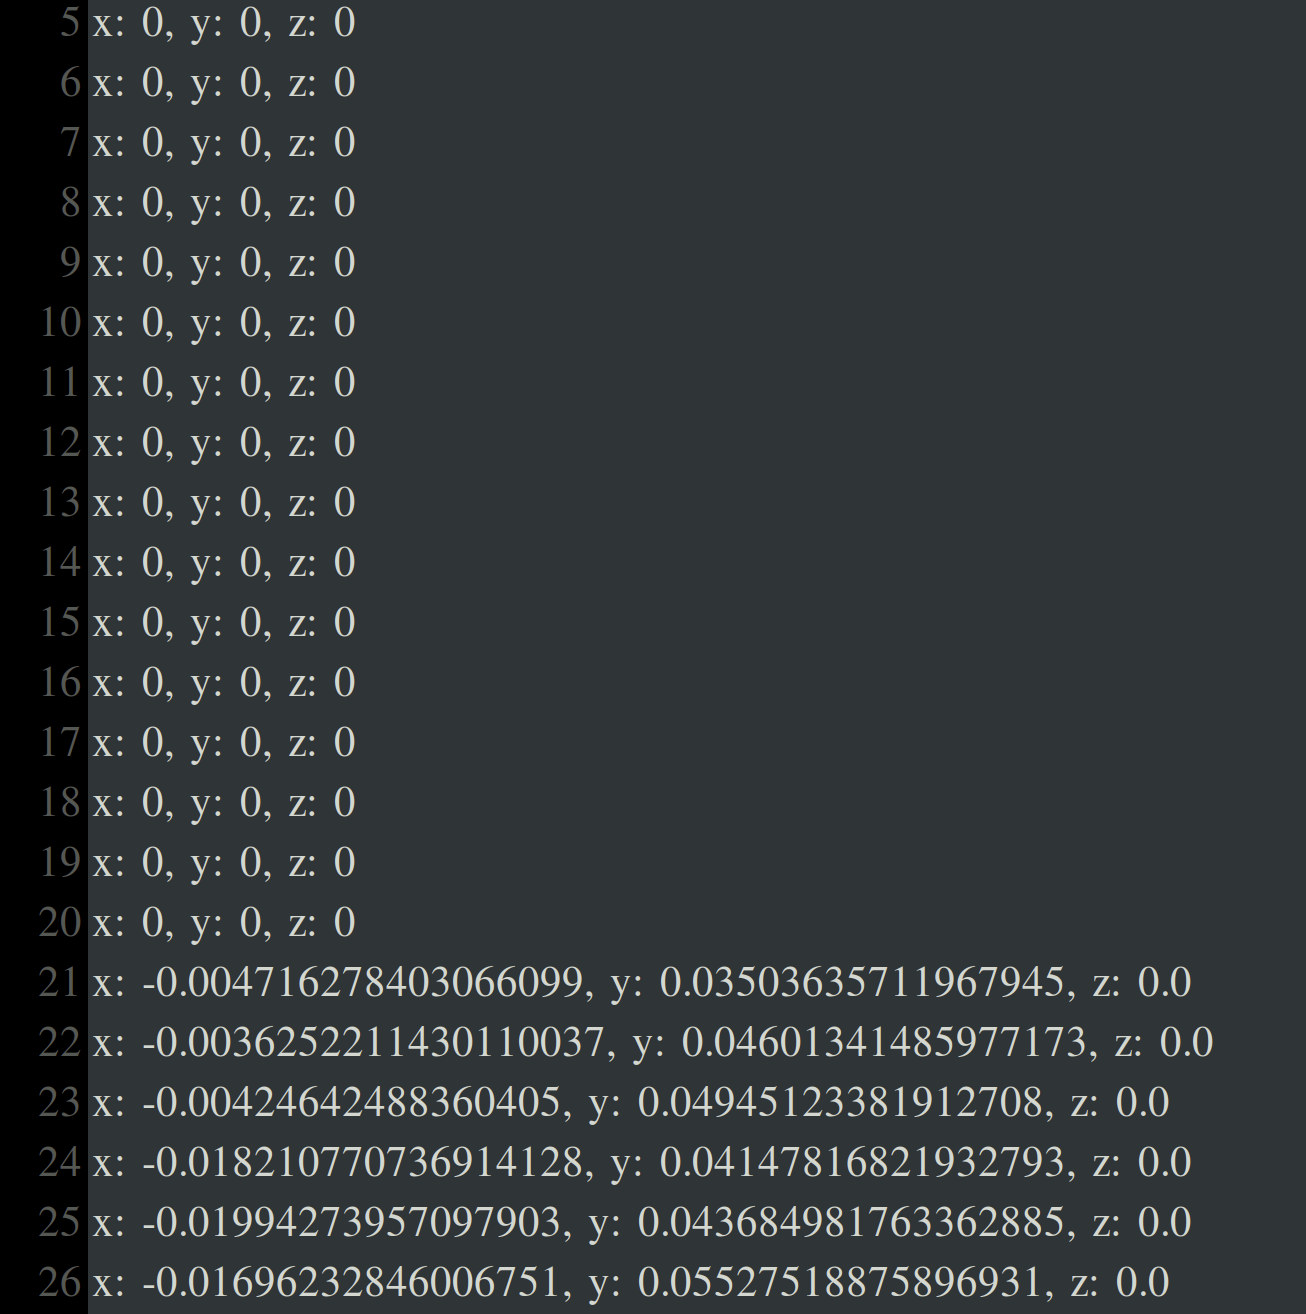
将经纬度和高度生成xyz坐标和画图,暂定以前20个点的均值作为投影坐标系的原点
from pyproj import Proj
import matplotlib.pyplot as plt
import mpl_toolkits.mplot3d as mplot3d
def read_coordinates_from_txt(file_path):
    coordinates = []
    with open(file_path, 'r') as file:
        for line in file:
            parts = line.strip().split(',')
            latitude = float(parts[0].split(':')[1].strip())
            longitude = float(parts[1].split(':')[1].strip())
            altitude = float(parts[2].split(':')[1].strip())
            coordinates.append((latitude, longitude, altitude))
    return coordinates

def calculate_avg_coordinates(coordinates):
    num_points = len(coordinates)
    avg_latitude = sum(coord[0] for coord in coordinates) / num_points
    avg_longitude = sum(coord[1] for coord in coordinates) / num_points
    return avg_latitude, avg_longitude


def project_coordinates_to_xyz(coordinates, avg_latitude, avg_longitude, origin_x, origin_y):
    # Define the projection coordinate system (UTM zone 10, WGS84 ellipsoid)
    p = Proj(proj='utm', zone=20, ellps='WGS84', preserve_units=False)

    # Project all points in the coordinates list to xy coordinate system
    projected_coordinates = [p(longitude, latitude) for latitude, longitude, _ in coordinates]

    # Calculate the relative xyz values for each point with respect to the origin
    relative_xyz_coordinates = []
    for (x, y), (_, _, altitude) in zip(projected_coordinates, coordinates):
        relative_x = x - origin_x
        relative_y = y - origin_y
        relative_xyz_coordinates.append((relative_x, relative_y, altitude))
    return relative_xyz_coordinates

def three_plot_coordinates(coordinates):
    # Separate the x, y, z coordinates for plotting
    x_values, y_values, z_values = zip(*coordinates)

    # Create a new figure for the 3D plot
    fig = plt.figure()
    ax = fig.add_subplot(111, projection='3d')

    # Plot points as a 3D scatter plot
    ax.scatter(x_values, y_values, z_values, c='blue', label='Points')

    # Connect points with lines
    for i in range(1, len(x_values)):
        ax.plot([x_values[i - 1], x_values[i]], [y_values[i - 1], y_values[i]], [z_values[i - 1], z_values[i]], 'k-', linewidth=0.5)

    # Add labels and title
    ax.set_xlabel('X (meters)')
    ax.set_ylabel('Y (meters)')
    ax.set_zlabel('Z (meters)')
    ax.set_title('Projected Coordinates - 3D')

    # Display the 3D plot in a separate window
    plt.show()

def two_plot_coordinates(coordinates):
    # Separate the x, y, z coordinates for plotting
    x_values, y_values, z_values = zip(*coordinates)

    # Create a new figure for the 2D plot
    fig = plt.figure()

    # Plot points
    plt.scatter(x_values, y_values, c='blue', label='Points')

    # Connect points with lines
    for i in range(1, len(x_values)):
        plt.plot([x_values[i - 1], x_values[i]], [y_values[i - 1], y_values[i]], 'k-', linewidth=0.5)

    # Add labels and title
    plt.xlabel('X (meters)')
    plt.ylabel('Y (meters)')
    plt.title('Projected Coordinates - 2D')
    plt.legend()

    # Display the 2D plot in a separate window
    plt.show()

if __name__ == "__main__":
    input_file_path = "xyz_output.txt"  # Replace with the actual input file path

    coordinates = read_coordinates_from_txt(input_file_path)

    # Use the first 10 points to define the projection coordinate system
    num_points_for_avg = 20
    avg_coordinates = coordinates[:num_points_for_avg]
    avg_latitude, avg_longitude = calculate_avg_coordinates(avg_coordinates)

    # Project the average latitude and longitude to xy coordinate system
    p = Proj(proj='utm', zone=20, ellps='WGS84', preserve_units=False)
    origin_x, origin_y = p(avg_longitude, avg_latitude)

    print(f"Average Latitude: {avg_latitude}, Average Longitude: {avg_longitude}")
    print(f"Projected Coordinates (x, y): {origin_x}, {origin_y}")

    # Project all points in the coordinates list to xy coordinate system
    first_coordinates = [(0, 0, 0)] * min(len(coordinates), num_points_for_avg)
    projected_coordinates2 = project_coordinates_to_xyz(coordinates[num_points_for_avg:], avg_latitude, avg_longitude, origin_x, origin_y)
    projected_coordinates = first_coordinates+projected_coordinates2
    # Save projected coordinates to a new text file
    output_file_path = "projected_coordinates.txt"
    with open(output_file_path, 'w') as output_file:
        for x, y, z in projected_coordinates:
            output_file.write(f"x: {x}, y: {y}, z: {z}\n")
    three_plot_coordinates(projected_coordinates)
    two_plot_coordinates(projected_coordinates)
生成xyz的txt文档


上述只以坐标为例子,想获取其他数据,改变参数即可。