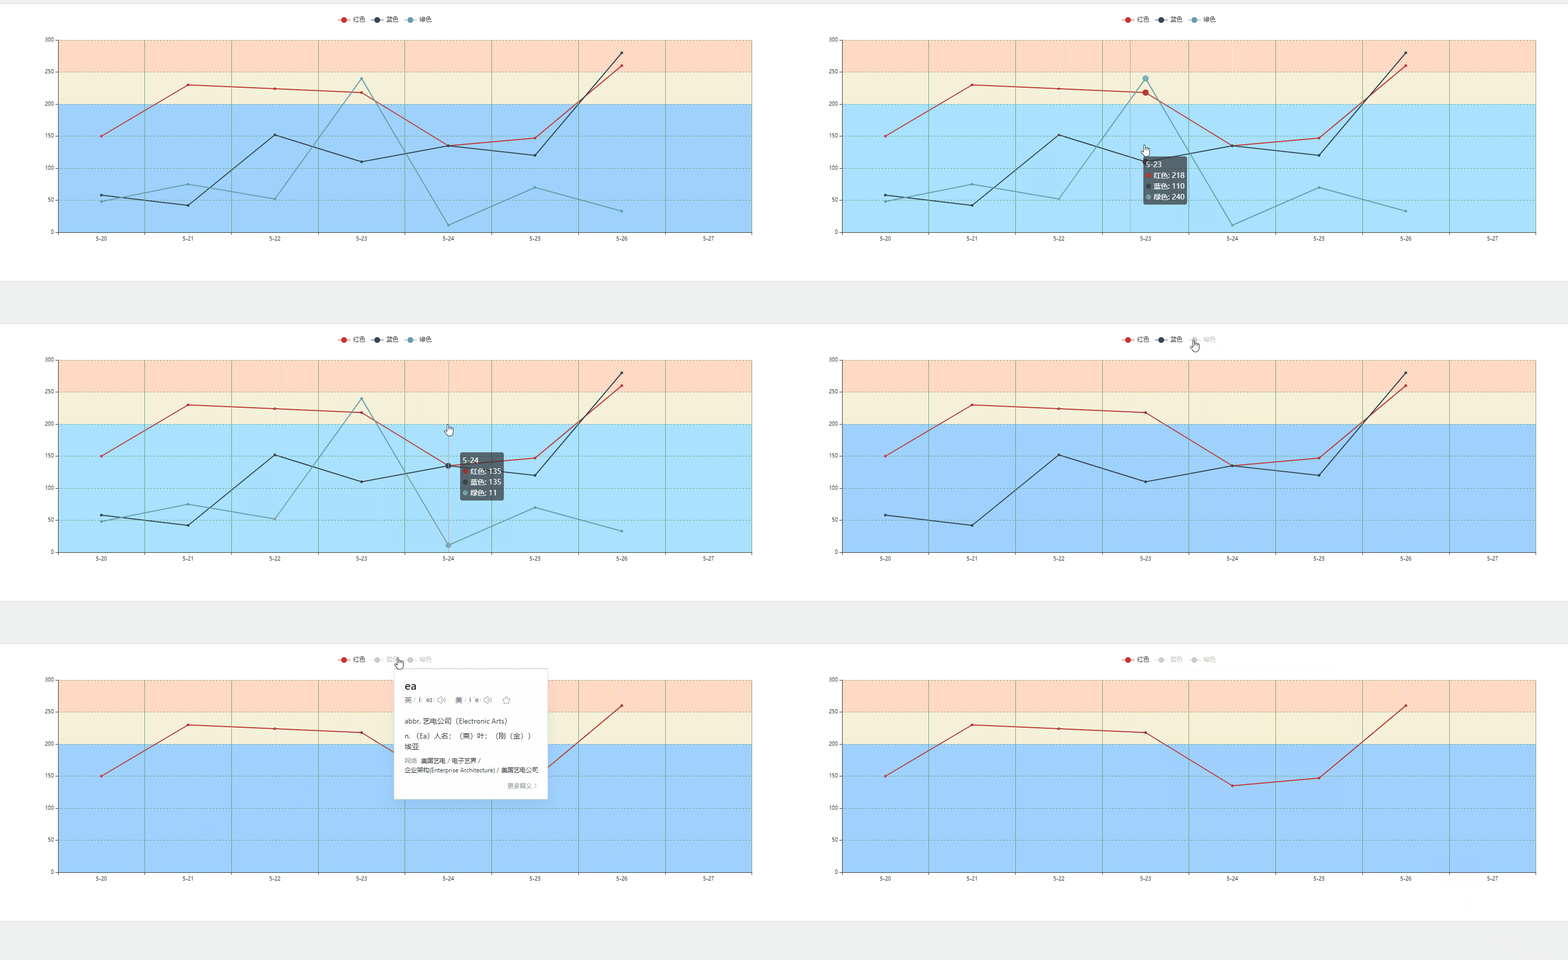
需求:根据传入的值对背景进行分层颜色展示,比如y轴20-40区间颜色为蓝色,40-50为红色这种,折线图的小圆点设置为实现,实现缩放功能
1.效果如下
2.代码讲解如下
首先下载echarts
npm install echarts@4.9.0 -S
我这边吓得是4.9版本,高版本会出现一个问题,那就是如果写了背景的话,y轴线的刻度会显示不出来,只有线没有刻度了,所以我这边用的还是以前的版本。
其中onZero:X 轴或者 Y 轴的轴线是否在另一个轴的 0 刻度上,只有在另一个轴为数值轴且包含 0 刻度时有效,如果你的值中有负数,直接把这个关了,不然效果如下,刻度线跑0度上面去了

axisLine: {
                        show: true, //是否显示轴线
                        onZero: false,
                        lineStyle: {
                            color: '#333'
                        }
                    }
legend:就是最上面可以点的部分,这个data的值要和series的name值一致,不然写了不显示
  legend: {
                    data: ['红色', '蓝色', '绿色']
}, 
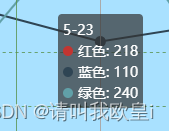
tooltip:做了个防止抖动,transitionDuration最好都加上这个,如果图例翻转的话不加一直就会一直抖动,效果也不好
 tooltip: {
                    trigger: 'axis',
                    transitionDuration: 0 // 让toolltip紧跟鼠标,防止抖动
                },
背景区间色:markArea中yAxis是纵轴的范围,这边是0-200设置是蓝色
   markArea: {
                            data: [
                                [
                                    {
                                        yAxis: '0', //开始
                                        itemStyle: {
                                            //  看这里,加了这个属性
                                            color: '#87c6fe',
                                            //   borderWidth: 1,
                                            //   borderType: "dashed",
                                            opacity: 0.8
                                        }
                                    },
                                    {
                                        yAxis: '200',//结束
                                    }
                                ],

                                //  如果有多种颜色,就继续在这里写区间数组,复制上面的下来改颜色
                            ]
                        }
3.完整代码如下
<template>
    <div class="content-box">
        <div class="container">
            <div id="echartsData"></div>
        </div>
    </div>
</template>

<script>
import * as echarts from 'echarts';
export default {
    data() {
        return {};
    },
    mounted() {
        this.lineEcharts();
    },
    methods: {
        lineEcharts() {
            const option = {
                xAxis: {
                    name: '',
                    // type: "",
                    position: 'bottom',
                    offset: 0,
                    axisLabel: {
                        color: '#0000000',
                        fontSize: 10
                    },
                    data: ['5-20', '5-21', '5-22', '5-23', '5-24', '5-25', '5-26', '5-27'],
                    splitLine: {
                        show: true,
                        lineStyle: {
                            color: '#59924d',
                            type: 'solid',
                            width: 0.8
                        }
                    },
                    zlevel: 9,
                    axisTick: {
                        show: true,
                        inside: false
                    },
                    axisLine: {
                        show: true,
                        onZero: false,
                        lineStyle: {
                            color: '#333'
                        }
                    }
                },
                // 内置区域缩放
                dataZoom: [
                    {
                        xAxisIndex: [0],
                        type: 'inside',
                        filterMode: 'none'
                    },
                    {
                        yAxisIndex: [0],
                        type: 'inside',
                        filterMode: 'none'
                    }
                ],
                tooltip: {
                    trigger: 'axis',
                    transitionDuration: 0 // 让toolltip紧跟鼠标,防止抖动
                },
                legend: {
                    data: ['红色','蓝色','绿色']
                },
                yAxis: [
                    {
                        name: '',
                        type: 'value',
                        show: true,
                        axisLabel: {
                            boundaryGap: false,
                            color: '#000000',
                            fontSize: 10,
                            interval: 0
                        },
                        splitLine: {
                            show: true,
                            lineStyle: {
                                color: '#59924d',
                                type: 'dashed',
                                width: 0.8
                            }
                        },
                        zlevel: 9,
                        axisTick: {
                            show: true
                        },
                        axisLine: {
                            show: true,
                            onZero: false,
                            lineStyle: {
                                color: '#333'
                            }
                        }
                    }
                ],
                grid: {
                    top: '10%',
                    left: '10%',
                    right: '5%',
                    bottom: '15%'
                },
                series: [
                    {
                        name: '红色',
                        data: [150, 230, 224, 218, 135, 147, 260],
                        type: 'line',
                        symbol: 'circle', //将小圆点改成实心 不写symbol默认空心
                        symbolSize: 5, //小圆点的大小
                        markArea: {
                            data: [
                                [
                                    {
                                        yAxis: '0', //开始
                                        itemStyle: {
                                            //  看这里,加了这个属性
                                            color: '#87c6fe',
                                            //   borderWidth: 1,
                                            //   borderType: "dashed",
                                            opacity: 0.8
                                        }
                                    },
                                    {
                                        yAxis: '200'
                                    }
                                ],
                                [
                                    {
                                        yAxis: '200', //结束
                                        itemStyle: {
                                            //  看这里,加了这个属性
                                            color: '#ece6b2',
                                            //   borderWidth: 1,
                                            //   borderType: "solid",
                                            opacity: 0.5
                                        }
                                    },
                                    {
                                        yAxis: '250'
                                    }
                                ],
                                [
                                    {
                                        yAxis: '250',
                                        itemStyle: {
                                            //  看这里,加了这个属性
                                            color: '#ffbf9c',
                                            opacity: 0.6
                                        }
                                    },
                                    {
                                        yAxis: '300'
                                    }
                                ]
                                //  如果有多种颜色,就继续在这里写区间数组,复制上面的下来改颜色
                            ]
                        }
                    },
                    {
                        name: '蓝色',
                        data: [58, 42, 152, 110, 135, 120, 280],
                        type: 'line',
                        symbol: 'circle', //将小圆点改成实心 不写symbol默认空心
                        symbolSize: 5 //小圆点的大小
                    },
                    {
                        name: '绿色',
                        data: [48, 75, 52, 240, 11, 70, 33],
                        type: 'line',
                        symbol: 'circle', //将小圆点改成实心 不写symbol默认空心
                        symbolSize: 5 //小圆点的大小
                    }
                ]
            };
            const myChart = echarts.init(document.getElementById('echartsData'));
            myChart.setOption(option);
            //随着屏幕大小调节图表
            window.addEventListener('resize', () => {
                myChart.resize();
            });
        }
    }
};
</script>

<style lang="scss" scoped>
#echartsData {
    height: 500px;
    width: 100%;
}
</style>
文章到此结束,希望对你有所帮助~

