< ! --
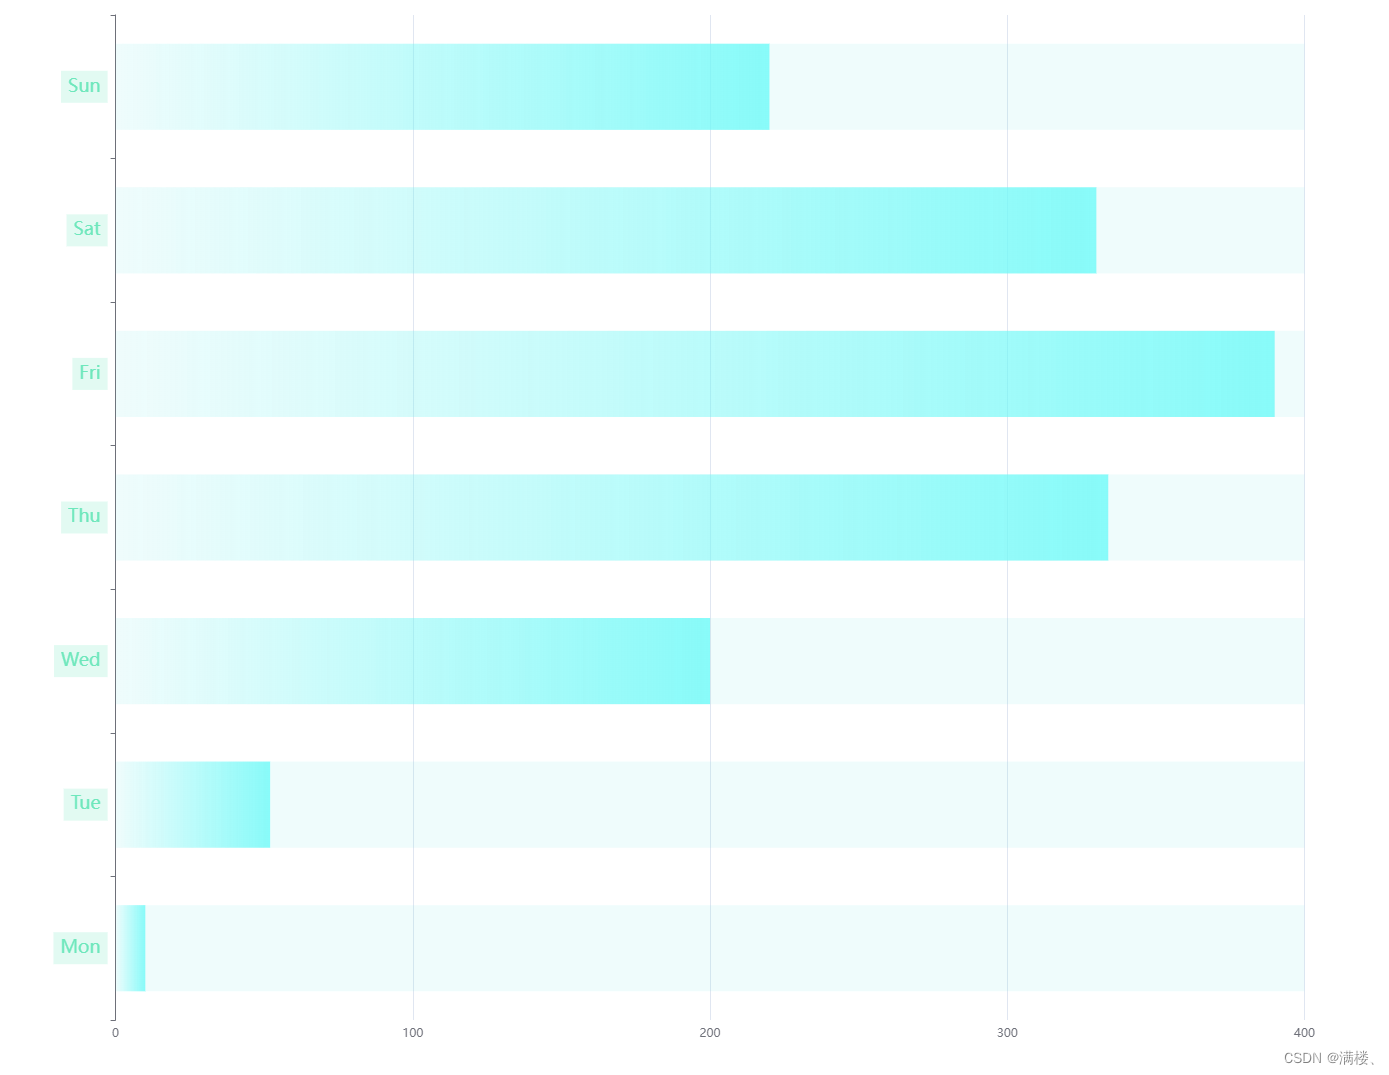
@Description: 横向渐变柱状图
-- >
< template>
< div ref= "horizontal" class = "w-full h-full" > < / div>
< / template>
< script>
import * as echarts from 'echarts'
export default {
components : { } ,
props : [ 'data' ] ,
data ( ) {
return { }
} ,
computed : { } ,
watch : {
data : {
handler ( ) {
this . initCharts ( ) ;
} ,
}
} ,
created ( ) { } ,
mounted ( ) {
this . $nextTick ( ( ) => {
this . initCharts ( )
} )
} ,
methods : {
initCharts ( ) {
const myChart = echarts. init ( this . $refs. horizontal)
var data = this . data
var colorList = [
[ 'rgba(110,250,248,0.00)' , 'rgba(110,250,248,0.80)' ] ,
[ 'rgba(110,250,248,0.00)' , 'rgba(110,250,248,0.80)' ] ,
[ 'rgba(110,250,248,0.00)' , 'rgba(110,250,248,0.80)' ] ,
[ 'rgba(110,250,248,0.00)' , 'rgba(110,250,248,0.80)' ] ,
[ 'rgba(110,250,248,0.00)' , 'rgba(110,250,248,0.80)' ] ,
]
let idx = this . data. findIndex ( ( item ) => Math. max . apply ( null , this . data) === item)
if ( idx !== - 1 ) {
colorList[ idx] = [ 'rgba(242,180,89,0.10)' , 'rgba(231,162,110,0.70)' ]
}
var className = [ '立项' , '初设' , '施工图计划' , '用地审批' , '批复' ]
var option = {
grid : {
left : '5%' ,
right : '5%' ,
bottom : '5%' ,
top : '5%' ,
containLabel : true
} ,
legend : {
show : false
} ,
tooltip : {
show : false ,
trigger : 'axis' ,
axisPointer : {
type : 'none'
} ,
} ,
xAxis : {
axisLabel : {
color : '#6d756e' ,
width : 100
} ,
type : 'value' ,
splitLine : {
show : false ,
} ,
axisTick : {
show : false
} ,
axisLine : {
show : false
} ,
} ,
yAxis : [
{
type : 'category' ,
inverse : true ,
interval : 0 ,
axisLabel : {
borderType : "solid" ,
padding : [ 7 , 7 , 7 , 7 ] ,
fontSize : 14 ,
width : 100 ,
formatter : ( e ) => {
if ( e === className[ idx] ) {
return ` {b| ${ e} } ` }
return ` {a| ${ e} } ` } ,
rich : {
a : {
align : 'center' ,
width : 90 ,
color : '#6EE7BC' ,
height : 28 ,
backgroundColor : "rgba(94,221,230,0.10)" ,
borderRadius : 4
} ,
b : {
align : 'center' ,
width : 90 ,
color : '#E7A26E' ,
height : 28 ,
backgroundColor : "rgba(231,162,110,0.2)" ,
borderRadius : 4
}
}
} ,
splitLine : {
show : false
} ,
axisTick : {
show : false
} ,
axisLine : {
show : false
} ,
data : className
} ,
] ,
series : [
{
type : 'bar' ,
stack : 'aa' ,
zlevel : 1 ,
itemStyle : {
normal : {
barBorderRadius : 0 ,
color : function ( params ) {
var colorItem = colorList[ params. dataIndex] ;
return new echarts. graphic. LinearGradient ( 1 , 0 , 0 , 0 , [
{
offset : 1 ,
color : colorItem[ 0 ]
} ,
{
offset : 0 ,
color : colorItem[ 1 ]
}
] )
}
} ,
} ,
barWidth : 15 ,
data : data
} ,
]
}
myChart. setOption ( option)
}
}
}
< / script>
< style lang= "scss" scoped> < / style>
