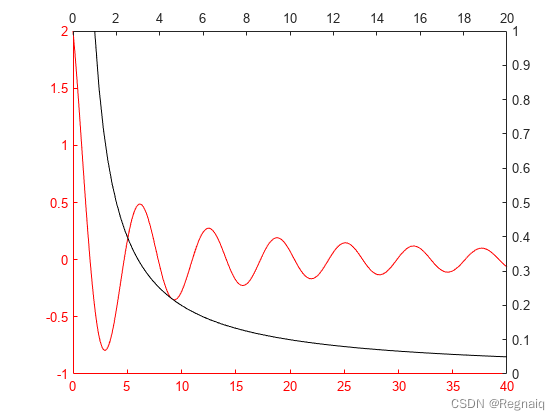
我们知道画两个y轴可以用yyaxis. 那么画两个x轴呢? 这时候可以用神奇的tiledlayout.
% 创建两组数据
x1 = 0:0.1:40;
y1 = 4.*cos(x1)./(x1+2);
x2 = 1:0.2:20;
y2 = x2.^2./x2.^3;

t = tiledlayout(1,1); % 创建一个tiledlayout
% 第一个坐标系
ax1 = axes(t); % 创建坐标系, 指定t为父对象
plot(ax1,x1,y1,'-r')
ax1.XColor = 'r';
ax1.YColor = 'r';
% 第二个坐标系
ax2 = axes(t); % 创建第二个坐标系, 指定t为父对象
plot(ax2,x2,y2,'-k')
ax2.XAxisLocation = 'top'; % 把第二个坐标系的x轴移到上面
ax2.YAxisLocation = 'right'; % y轴移到右边
ax2.Color = 'none';
ax1.Box = 'off';
ax2.Box = 'off';
可以得到结果:
Reference
Display Data with Multiple Scales and Axes Limits


