文章目录
- 第2章 k-近邻算法
- 2.1k-近邻算法概述
- 2.1.1准备:使用Python导入数据
- 2.1.2实施kNN分类算法
- 2.2示例:使用k近邻算法改进约会网站的
- 2.2.2分析数据:使用Matplotlib创建散点图
- 2.2.3准备数据:归一化数值
- 2.2.4测试算法
第2章 k-近邻算法
2.1k-近邻算法概述
它的⼯作原理是:
存在⼀个样本数据集合,也称作训练样本集,并且样本集中每个数据都存在标签,即我们知道样本集中每⼀数据与所属分类的对应关系。输⼊没有标签的新数据后,将新数据的每个特征与样本集中数据对应的特征进行比较,然后算法提取样本集中特征**最相似数据(最近邻)**的分类标签
- 优点:精度⾼、对异常值不敏感、⽆数据输⼊假定。
- 缺点:计算复杂度⾼、空间复杂度⾼。 适⽤数据范围:数值型和标称型。
2.1.1准备:使用Python导入数据
import numpy as np
def createDataSet():
    group = np.array([[1.0, 1.1], [1.0, 1.0], [0, 0], [0, 0.1]])
    labels = ['A', 'A', 'B', 'B']
    return group, labels
group, labels=createDataSet()
2.1.2实施kNN分类算法
对未知类别属性的数据集中的每个点依次执行以下操作:
- 计算已知类别数据集中的点与当前点之间的距离;
- 按照距离递增次序排序;
- 选取与当前点距离最⼩的k个点;
- 确定前k个点所在类别的出现频率;
- 返回前k个点出现频率最⾼的类别作为当前点的预测分类。
from collections import Counter
def classify0(inX, dataSet, labels, k):
    size = dataSet.shape[0]
    dif_mat = np.tile(inX, (size, 1))-dataSet
    square_mat = dif_mat**2
    square_distance = square_mat.sum(axis=1)
    indexs = square_distance.argsort()
    lable_count = Counter([labels[index] for index in indexs[:k]])
    sort_count = sorted(lable_count.items(), key=lambda tp: -tp[1])
    return sort_count[0][0]


print(classify0([0, 0], group, labels, 3))
B
2.2示例:使用k近邻算法改进约会网站的
分类标签:
- 不喜欢的⼈didntLike
- 魅力⼀般的⼈smallDoses
- 极具魅力的⼈largeDoses
数据存放在文本文件datingTestSet.txt中,每个样本数据占据⼀行,总共有1000行。样本主要包含以下3种特征:
- 每年获得的飞行常客⾥程数Number of frequent flyers per year
- 玩视频游戏所耗时间百分⽐Percentage of Time Spent Playing Video Games
- 每周消费的冰琪淋公升数Liters of Ice Cream Consumed Per Week
import numpy as np


def file2matrix(filename):
    fr = open(filename)
    arrayOlines = fr.readlines()
    numberOfLines = len(arrayOlines)
    returnMat = np.zeros((numberOfLines, 3))
    classLabelVector = []
    index = 0
    for index in range(numberOfLines):
        line = arrayOlines[index].strip()
        listFromLine = line.split('\t')
        returnMat[index, :] = listFromLine[0:3] #存在类型转换
        classLabelVector.append(listFromLine[-1])
    return returnMat, classLabelVector


datingDataMat, datingLabels = file2matrix('datingTestSet.txt')
print(type(datingDataMat[0][0]))
print(datingDataMat)
print(datingLabels[:7])
<class 'numpy.float64'>
[[4.0920000e+04 8.3269760e+00 9.5395200e-01]
 [1.4488000e+04 7.1534690e+00 1.6739040e+00]
 [2.6052000e+04 1.4418710e+00 8.0512400e-01]
 ...
 [2.6575000e+04 1.0650102e+01 8.6662700e-01]
 [4.8111000e+04 9.1345280e+00 7.2804500e-01]
 [4.3757000e+04 7.8826010e+00 1.3324460e+00]]
['largeDoses', 'smallDoses', 'didntLike', 'didntLike', 'didntLike', 'didntLike', 'largeDoses']
2.2.2分析数据:使用Matplotlib创建散点图
import matplotlib
import matplotlib.pyplot as plt
fig = plt.figure()
plt.figure(figsize=(20, 20))
ax = fig.add_subplot(111,projection='3d')
colors={'largeDoses':'r', 'smallDoses':'y', 'didntLike':'g'}
clr=[colors[x] for x in datingLabels]
ax.scatter(datingDataMat[:,0],datingDataMat[:,1], datingDataMat[:,2],color=clr)
ax.set_xlabel('Flight Mileage')
ax.set_ylabel('Games Time ')
ax.set_zlabel('Liters of Ice Cream')

plt.show()
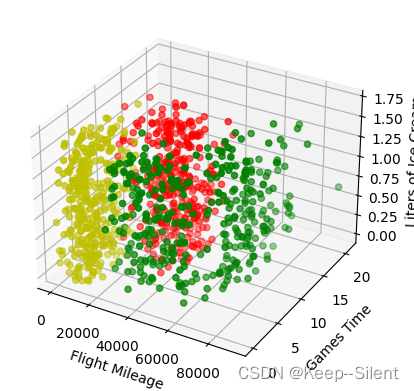
x、y、z坐标分别是每年获得的飞行常客里程数、玩视频游戏所耗时间百分比、每周消费的冰琪淋公升数
红、黄、绿分别是不喜欢的人didntLike、魅力⼀般的人smallDoses、极具魅力的人largeDoses
上图可看出,颜色相同的点大多各自聚集在一起,可以使用k近邻
2.2.3准备数据:归一化数值
距离:
d
=
(
x
1
−
x
2
)
2
+
(
y
1
−
y
2
)
2
+
(
z
1
−
z
2
)
2
d=\sqrt{(x_1-x_2)^2+(y_1-y_2)^2+(z_1-z_2)^2}
d=(x1−x2)2+(y1−y2)2+(z1−z2)2
但是由于参数的大小不同,并不能直接使用,如里程40920变为41000实际上没有百分比1%变为3%变化得大,所以需要归一化处理(转为0到1):
n
e
w
V
a
l
u
e
=
o
l
d
V
a
l
u
e
−
m
i
n
m
a
x
−
m
i
n
\mathrm{newValue}=\cfrac{\mathrm{oldValue}-\mathrm{min}}{\mathrm{max}-\mathrm{min}}
newValue=max−minoldValue−min
from sklearn.preprocessing import MinMaxScaler
print(datingDataMat[:3,:3])
transfer=MinMaxScaler(feature_range=(0, 1))
datingDataMat=transfer.fit_transform(datingDataMat)
print(datingDataMat[:3,:3])
[[4.092000e+04 8.326976e+00 9.539520e-01]
 [1.448800e+04 7.153469e+00 1.673904e+00]
 [2.605200e+04 1.441871e+00 8.051240e-01]]
[[0.44832535 0.39805139 0.56233353]
 [0.15873259 0.34195467 0.98724416]
 [0.28542943 0.06892523 0.47449629]]
可以看出,数据得到了很好的归一化
2.2.4测试算法
采用90%作为训练数据,10%为测试数据
from sklearn.datasets import load_iris
from sklearn.model_selection import train_test_split

train_data,test_data,train_lable,test_lable=train_test_split(datingDataMat,datingLabels,test_size=0.1)
test_number=len(test_data)
acc_number=0
for i in range(test_number):
    prediction=classify0(test_data[i],train_data,train_lable,10)
    print('%3dth: label:%s,prediction:%s'%((i+1), test_lable[i],prediction))
    if prediction==test_lable[i]:
        acc_number+=1
print('Accuracy:%.2f%%'%(acc_number/test_number*100))
  1th: label:smallDoses,prediction:smallDoses
  2th: label:smallDoses,prediction:smallDoses
  3th: label:largeDoses,prediction:largeDoses
  4th: label:largeDoses,prediction:largeDoses
  5th: label:largeDoses,prediction:smallDoses
  6th: label:largeDoses,prediction:largeDoses
  7th: label:smallDoses,prediction:smallDoses
...
 98th: label:didntLike,prediction:didntLike
 99th: label:didntLike,prediction:didntLike
100th: label:didntLike,prediction:didntLike
Accuracy:94.00%
可以看出,在此数据集中,k近邻的正确率高达90%以上


