matlab2016b可运行,输入城市位置,可以动态显示规划过程
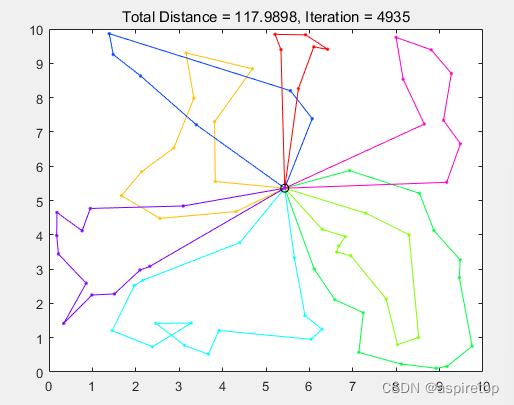

% MTSPF_GA Fixed Multiple Traveling Salesmen Problem (M-TSP) Genetic Algorithm (GA)
%   Finds a (near) optimal solution to a variation of the M-TSP by setting
%   up a GA to search for the shortest route (least distance needed for
%   each salesman to travel from the start location to individual cities
%   and back to the original starting place)
%
% Summary:
%     1. Each salesman starts at the first point, and ends at the first
%        point, but travels to a unique set of cities in between
%     2. Except for the first, each city is visited by exactly one salesman
%
% Note: The Fixed Start/End location is taken to be the first XY point
%
% Input:
%     USERCONFIG (structure) with zero or more of the following fields:
%     - XY (float) is an Nx2 matrix of city locations, where N is the number of cities
%     - DMAT (float) is an NxN matrix of city-to-city distances or costs
%     - NSALESMEN (scalar integer) is the number of salesmen to visit the cities
%     - MINTOUR (scalar integer) is the minimum tour length for any of the
%         salesmen, NOT including the start/end point
%     - POPSIZE (scalar integer) is the size of the population (should be divisible by 8)
%     - NUMITER (scalar integer) is the number of desired iterations for the algorithm to run
%     - SHOWPROG (scalar logical) shows the GA progress if true
%     - SHOWRESULT (scalar logical) shows the GA results if true
%     - SHOWWAITBAR (scalar logical) shows a waitbar if true
%
% Input Notes:
%     1. Rather than passing in a structure containing these fields, any/all of
%        these inputs can be passed in as parameter/value pairs in any order instead.
%     2. Field/parameter names are case insensitive but must match exactly otherwise.
%
% Output:
%     RESULTSTRUCT (structure) with the following fields:
%         (in addition to a record of the algorithm configuration)
%     - OPTROUTE (integer array) is the best route found by the algorithm
%     - OPTBREAK (integer array) is the list of route break points (these specify the indices
%         into the route used to obtain the individual salesman routes)
%     - MINDIST (scalar float) is the total distance traveled by the salesmen
%
% Route/Breakpoint Details:
%     If there are 10 cities and 3 salesmen, a possible route/break
%     combination might be: rte = [5 6 9 4 2 8 10 3 7], brks = [3 7]
%     Taken together, these represent the solution [1 5 6 9 1][1 4 2 8 10 1][1 3 7 1],
%     which designates the routes for the 3 salesmen as follows:
%         . Salesman 1 travels from city 1 to 5 to 6 to 9 and back to 1
%         . Salesman 2 travels from city 1 to 4 to 2 to 8 to 10 and back to 1
%         . Salesman 3 travels from city 1 to 3 to 7 and back to 1
%
% Usage:
%     mtspf_ga
%       -or-
%     mtspf_ga(userConfig)
%       -or-
%     resultStruct = mtspf_ga;
%       -or-
%     resultStruct = mtspf_ga(userConfig);
%       -or-
%     [...] = mtspf_ga('Param1',Value1,'Param2',Value2, ...);
%
% Example:
%     % Let the function create an example problem to solve
%     mtspf_ga;
%
% Example:
%     % Request the output structure from the solver
%     resultStruct = mtspf_ga;
%
% Example:
%     % Pass a random set of user-defined XY points to the solver
%     userConfig = struct('xy',10*rand(35,2));
%     resultStruct = mtspf_ga(userConfig);
%
% Example:
%     % Pass a more interesting set of XY points to the solver
%     n = 50;
%     phi = (sqrt(5)-1)/2;
%     theta = 2*pi*phi*(0:n-1);
%     rho = (1:n).^phi;
%     [x,y] = pol2cart(theta(:),rho(:));
%     xy = 10*([x y]-min([x;y]))/(max([x;y])-min([x;y]));
%     userConfig = struct('xy',xy);
%     resultStruct = mtspf_ga(userConfig);
%
% Example:
%     % Pass a random set of 3D (XYZ) points to the solver
%     xyz = 10*rand(35,3);
%     userConfig = struct('xy',xyz);
%     resultStruct = mtspf_ga(userConfig);
%
% Example:
%     % Change the defaults for GA population size and number of iterations
%     userConfig = struct('popSize',200,'numIter',1e4);
%     resultStruct = mtspf_ga(userConfig);
%
% Example:
%     % Turn off the plots but show a waitbar
%     userConfig = struct('showProg',false,'showResult',false,'showWaitbar',true);
%     resultStruct = mtspf_ga(userConfig);
%
% See also: mtsp_ga, mtspo_ga, mtspof_ga, mtspofs_ga, mtspv_ga, distmat
%
% Author: Joseph Kirk
% Email: jdkirk630@gmail.com
% Release: 2.0
% Release Date: 05/01/2014
function varargout = mtspf_ga(varargin)

    % Initialize default configuration
    defaultConfig.xy          = 10*rand(80,2)
    defaultConfig.dmat        = [];  % N*N距离矩阵
    defaultConfig.nSalesmen   = 8;
    defaultConfig.minTour     = 3;
    defaultConfig.popSize     = 80;
    defaultConfig.numIter     = 5e3;
    defaultConfig.showProg    = true;
    defaultConfig.showResult  = true;
    defaultConfig.showWaitbar = false;

    % Interpret user configuration inputs
    if ~nargin
        userConfig = struct();
    elseif isstruct(varargin{1})
        userConfig = varargin{1};
    else
        try
            userConfig = struct(varargin{:});
        catch
            error('Expected inputs are either a structure or parameter/value pairs');
        end
    end

    % Override default configuration with user inputs
    configStruct = get_config(defaultConfig,userConfig);

    % Extract configuration
    xy          = configStruct.xy;
    dmat        = configStruct.dmat;
    nSalesmen   = configStruct.nSalesmen;
    minTour     = configStruct.minTour;
    popSize     = configStruct.popSize;
    numIter     = configStruct.numIter;
    showProg    = configStruct.showProg;
    showResult  = configStruct.showResult;
    showWaitbar = configStruct.showWaitbar;
    if isempty(dmat)
        nPoints = size(xy,1);
        a = meshgrid(1:nPoints);
        dmat = reshape(sqrt(sum((xy(a,:)-xy(a',:)).^2,2)),nPoints,nPoints);
    end

    % Verify Inputs 验证输入
    [N,dims] = size(xy);
    [nr,nc] = size(dmat);
    if N ~= nr || N ~= nc
        error('Invalid XY or DMAT inputs!')
    end
    n = N - 1; % Separate Start/End City

    % Sanity Checks
    nSalesmen   = max(1,min(n,round(real(nSalesmen(1)))));
    minTour     = max(1,min(floor(n/nSalesmen),round(real(minTour(1)))));
    popSize     = max(8,8*ceil(popSize(1)/8));
    numIter     = max(1,round(real(numIter(1))));
    showProg    = logical(showProg(1));
    showResult  = logical(showResult(1));
    showWaitbar = logical(showWaitbar(1));

    % Initializations for Route Break Point Selection 路径断点选择的初始化
    nBreaks = nSalesmen-1;
    dof = n - minTour*nSalesmen;          % degrees of freedom
    addto = ones(1,dof+1);
    for k = 2:nBreaks
        addto = cumsum(addto);
    end
    cumProb = cumsum(addto)/sum(addto);

    % Initialize the Populations
    popRoute = zeros(popSize,n);         % population of routes
    popBreak = zeros(popSize,nBreaks);   % population of breaks
    popRoute(1,:) = (1:n) + 1;
    popBreak(1,:) = rand_breaks();
    for k = 2:popSize
        popRoute(k,:) = randperm(n) + 1;
        popBreak(k,:) = rand_breaks();
    end

    % Select the Colors for the Plotted Routes    所画路径的颜色
    pclr = ~get(0,'DefaultAxesColor');
    clr = [1 0 0; 0 0 1; 0.67 0 1; 0 1 0; 1 0.5 0];
    if nSalesmen > 5
        clr = hsv(nSalesmen);
    end

    % Run the GA
    globalMin = Inf;
    totalDist = zeros(1,popSize);
    distHistory = zeros(1,numIter);
    tmpPopRoute = zeros(8,n);
    tmpPopBreak = zeros(8,nBreaks);
    newPopRoute = zeros(popSize,n);
    newPopBreak = zeros(popSize,nBreaks);
    if showProg
        figure('Name','MTSPF_GA | Current Best Solution','Numbertitle','off');
        hAx = gca;
    end
    if showWaitbar
        hWait = waitbar(0,'Searching for near-optimal solution ...');
    end
    for iter = 1:numIter
    % Evaluate Members of the Population    人口评估
        for p = 1:popSize
            d = 0;
            pRoute = popRoute(p,:);
            pBreak = popBreak(p,:);
            rng = [[1 pBreak+1];[pBreak n]]';
            for s = 1:nSalesmen
                d = d + dmat(1,pRoute(rng(s,1))); % Add Start Distance
                for k = rng(s,1):rng(s,2)-1
                    d = d + dmat(pRoute(k),pRoute(k+1));
                end
                d = d + dmat(pRoute(rng(s,2)),1); % Add End Distance
            end
            totalDist(p) = d;
        end

     % Find the Best Route in the Population
        [minDist,index] = min(totalDist);
        distHistory(iter) = minDist;
        if minDist < globalMin
            globalMin = minDist;
            optRoute = popRoute(index,:);
            optBreak = popBreak(index,:);
            rng = [[1 optBreak+1];[optBreak n]]';
            if showProg
     % Plot the Best Route   实时展示最优路径
                for s = 1:nSalesmen
                    rte = [1 optRoute(rng(s,1):rng(s,2)) 1];
                    if dims > 2, plot3(hAx,xy(rte,1),xy(rte,2),xy(rte,3),'.-','Color',clr(s,:));
                    else plot(hAx,xy(rte,1),xy(rte,2),'.-','Color',clr(s,:)); end
                    hold(hAx,'on');
                end
                if dims > 2, plot3(hAx,xy(1,1),xy(1,2),xy(1,3),'o','Color',pclr);
                else plot(hAx,xy(1,1),xy(1,2),'o','Color',pclr); end
                title(hAx,sprintf('Total Distance = %1.4f, Iteration = %d',minDist,iter));
                hold(hAx,'off');
                drawnow;
            end
        end

      % Genetic Algorithm Operators
        randomOrder = randperm(popSize);
        for p = 8:8:popSize
            rtes = popRoute(randomOrder(p-7:p),:);
            brks = popBreak(randomOrder(p-7:p),:);
            dists = totalDist(randomOrder(p-7:p));
            [ignore,idx] = min(dists); %#ok
            bestOf8Route = rtes(idx,:);
            bestOf8Break = brks(idx,:);
            routeInsertionPoints = sort(ceil(n*rand(1,2)));
            I = routeInsertionPoints(1);
            J = routeInsertionPoints(2);
            for k = 1:8 % Generate New Solutions
                tmpPopRoute(k,:) = bestOf8Route;
                tmpPopBreak(k,:) = bestOf8Break;
                switch k
                    case 2 % Flip
                        tmpPopRoute(k,I:J) = tmpPopRoute(k,J:-1:I);
                    case 3 % Swap
                        tmpPopRoute(k,[I J]) = tmpPopRoute(k,[J I]);
                    case 4 % Slide
                        tmpPopRoute(k,I:J) = tmpPopRoute(k,[I+1:J I]);
                    case 5 % Modify Breaks
                        tmpPopBreak(k,:) = rand_breaks();
                    case 6 % Flip, Modify Breaks
                        tmpPopRoute(k,I:J) = tmpPopRoute(k,J:-1:I);
                        tmpPopBreak(k,:) = rand_breaks();
                    case 7 % Swap, Modify Breaks
                        tmpPopRoute(k,[I J]) = tmpPopRoute(k,[J I]);
                        tmpPopBreak(k,:) = rand_breaks();
                    case 8 % Slide, Modify Breaks
                        tmpPopRoute(k,I:J) = tmpPopRoute(k,[I+1:J I]);
                        tmpPopBreak(k,:) = rand_breaks();
                    otherwise % Do Nothing
                end
            end
            newPopRoute(p-7:p,:) = tmpPopRoute;
            newPopBreak(p-7:p,:) = tmpPopBreak;
        end
        popRoute = newPopRoute;
        popBreak = newPopBreak;

        % Update the waitbar
        if showWaitbar && ~mod(iter,ceil(numIter/325))
            waitbar(iter/numIter,hWait);
        end

    end
    if showWaitbar
        close(hWait);
    end

    if showResult
        % Plots     画图
        figure('Name','MTSPF_GA | Results','Numbertitle','off');
        subplot(2,2,1);
        if dims > 2, plot3(xy(:,1),xy(:,2),xy(:,3),'.','Color',pclr);
        else plot(xy(:,1),xy(:,2),'.','Color',pclr); end
        title('City Locations');
        subplot(2,2,2);
        imagesc(dmat([1 optRoute],[1 optRoute]));
        title('Distance Matrix');
        subplot(2,2,3);
        rng = [[1 optBreak+1];[optBreak n]]';
        for s = 1:nSalesmen
            rte = [1 optRoute(rng(s,1):rng(s,2)) 1];
            if dims > 2, plot3(xy(rte,1),xy(rte,2),xy(rte,3),'.-','Color',clr(s,:));
            else plot(xy(rte,1),xy(rte,2),'.-','Color',clr(s,:)); end
            title(sprintf('Total Distance = %1.4f',minDist));
            hold on;
        end
        if dims > 2, plot3(xy(1,1),xy(1,2),xy(1,3),'o','Color',pclr);
        else plot(xy(1,1),xy(1,2),'o','Color',pclr); end
        subplot(2,2,4);
        plot(distHistory,'b','LineWidth',2);
        title('Best Solution History');
        set(gca,'XLim',[0 numIter+1],'YLim',[0 1.1*max([1 distHistory])]);
    end

    % Return Output
    if nargout
        resultStruct = struct( ...
            'xy',          xy, ...
            'dmat',        dmat, ...
            'nSalesmen',   nSalesmen, ...
            'minTour',     minTour, ...
            'popSize',     popSize, ...
            'numIter',     numIter, ...
            'showProg',    showProg, ...
            'showResult',  showResult, ...
            'showWaitbar', showWaitbar, ...
            'optRoute',    optRoute, ...
            'optBreak',    optBreak, ...
            'minDist',     minDist);

        varargout = {resultStruct};
    end

    % Generate Random Set of Break Points
    function breaks = rand_breaks()
        if minTour == 1 % No Constraints on Breaks
            tmpBreaks = randperm(n-1);
            breaks = sort(tmpBreaks(1:nBreaks));
        else % Force Breaks to be at Least the Minimum Tour Length
            nAdjust = find(rand < cumProb,1)-1;
            spaces = ceil(nBreaks*rand(1,nAdjust));
            adjust = zeros(1,nBreaks);
            for kk = 1:nBreaks
                adjust(kk) = sum(spaces == kk);
            end
            breaks = minTour*(1:nBreaks) + cumsum(adjust);
        end
    end

end

% Subfunction to override the default configuration with user inputs
% 将输入初始化,什么都不输入,就用这个应该是
function config = get_config(defaultConfig,userConfig)

    % Initialize the configuration structure as the default
    config = defaultConfig;

    % Extract the field names of the default configuration structure
    defaultFields = fieldnames(defaultConfig);

    % Extract the field names of the user configuration structure
    userFields = fieldnames(userConfig);
    nUserFields = length(userFields);

    % Override any default configuration fields with user values
    for i = 1:nUserFields
        userField = userFields{i};
        isField = strcmpi(defaultFields,userField);
        if nnz(isField) == 1
            thisField = defaultFields{isField};
            config.(thisField) = userConfig.(userField);
        end
    end

end

