1. 数据集
- 由美国高中生和人口调查局员工手写的70000个数字的图片。
- 数据集获取
# 获取MNIST数据集
from sklearn.datasets import fetch_openml
mnist = fetch_openml('mnist_784', version=1, cache=True, as_frame=False)
mnist
- 查看X和Y

- 找索引为36000的实例,并将其还原成数字(书中是还原成了5,但是我这么获取数据集还原的数字是9,不知道什么原因)
# 随机抽取一个实例,将其还原成数字
%matplotlib inline
import matplotlib
import matplotlib.pyplot as plt

some_digit = X[36000]
some_digit_image = some_digit.reshape(28, 28)
plt.imshow(some_digit_image, cmap=matplotlib.cm.binary, interpolation='nearest')
plt.axis('off')
plt.show()

2. 划分数据集
- 因为有些机器学习算法对训练实例的顺序敏感,如果连续输入许多相似的实例,可能导致执行性能不佳,所以对训练集进行洗牌。
X_train, X_test, y_train, y_test = X[:60000], X[60000:], y[:60000], y[60000:]
# 对数据进行洗牌,防止输入许多相似实例导致的执行性能不佳
import numpy as np
shuffle_index = np.random.permutation(60000)
X_train, y_train = X_train[shuffle_index], y_train[shuffle_index]

3. 重新创建目标向量(以是5和非5作为二分类标准)
y_train_5 = (y_train == '5')
y_test_5 = (y_test == '5')

4. 训练SGD分类器
from sklearn.linear_model import SGDClassifier

sgd_clf = SGDClassifier(random_state=42)
sgd_clf.fit(X_train, y_train_5)

4.1 使用准确率进行评估
from sklearn.model_selection import StratifiedKFold
from sklearn.base import clone

skfolds = StratifiedKFold(n_splits=3, random_state=42, shuffle=True) # 三折

for train_index, test_index in skfolds.split(X_train, y_train_5):
    clone_clf = clone(sgd_clf)
    X_train_folds = X_train[train_index]
    y_train_folds = y_train_5[train_index]
    X_test_folds = X_train[test_index]
    y_test_folds = y_train_5[test_index]

    clone_clf.fit(X_train_folds, y_train_folds)
    y_pred = clone_clf.predict(X_test_folds)
    n_correct = sum(y_pred == y_test_folds)
    print('预测正确的数量比例:', n_correct / len(y_pred))

# 使用 cross_val_score()函数来评估模型
from sklearn.model_selection import cross_val_score

cross_val_score(sgd_clf, X_train, y_train_5, cv=3, scoring='accuracy')

4.2 使用混淆矩阵进行评估(精度、召回率和F1分数)
from sklearn.model_selection import cross_val_predict

y_train_pred = cross_val_predict(sgd_clf, X_train, y_train_5, cv=3)
from sklearn.metrics import confusion_matrix
confusion_matrix(y_train_5, y_train_pred)
# 精度和召回率
from sklearn.metrics import precision_score, recall_score

precision_score(y_train_5, y_train_pred)
# F1-score
from sklearn.metrics import f1_score
f1_score(y_train_5, y_train_pred)

4.3 绘制precision、recall相对于threshold的函数图
# 1. 获取训练集中所有实例的决策分数
y_scores = cross_val_predict(sgd_clf, X_train, y_train_5, cv=3, method='decision_function')
y_scores
# 2. 计算所有可能的阈值的precision、recall
from sklearn.metrics import precision_recall_curve

precisions, recalls, thresholds = precision_recall_curve(y_train_5, y_scores)
# 3. 绘制precision、recall相对于threshold的函数图
def plot_precision_recall_vs_threshold(precisions, recalls, thresholds):
    plt.plot(thresholds, precisions[: -1], 'b--', label='Precision')
    plt.plot(thresholds, recalls[:-1], 'g--', label='Recall')
    plt.xlabel('Threshold')
    plt.legend(loc='upper left') # 图例位置
    plt.ylim([0, 1]) # 设置刻度

plot_precision_recall_vs_threshold(precisions, recalls, thresholds)
plt.show()

4.4 精度-召回率(PR曲线)
# 4.精度-召回率曲线
plt.plot(recalls[:-1], precisions[: -1], 'r--')
plt.xlabel('Recall')
plt.ylabel('Precision')
plt.show()

4.5 ROC曲线、AUC值
4.5.1 ROC曲线
# 1. 计算多种阈值的TPR和FPR
from sklearn.metrics import roc_curve

fpr, tpr, thresholds = roc_curve(y_train_5, y_scores)

# 2. 绘制FPR对TPR的曲线
def plot_roc_curve(fpr, tpr, label=None):
    plt.plot(fpr, tpr, lineWidth=2, label=label)
    plt.plot([0, 1], [0, 1], 'k--')  # 副对角线
    plt.axis([0, 1, 0, 1]) # 设置横轴、竖轴的刻度
    plt.xlabel('False Positive Rate')
    plt.ylabel('True Positive Rate')

plot_roc_curve(fpr, tpr)
plt.show()

4.5.2 AUC值
# 完美分类器的ROC AUC为1,纯随机分类器的ROC AUC等于0.5
from sklearn.metrics import roc_auc_score
roc_auc_score(y_train_5, y_scores)

5. 使用随机森林训练、评估
from sklearn.ensemble import RandomForestClassifier

forest_clf = RandomForestClassifier(random_state=42)
y_probas_forest = cross_val_predict(forest_clf, X_train, y_train_5, cv=3, method='predict_proba')
y_probas_forest # 某个实例属于某个类别的概率
# 使用正类的概率作为分数值(第二列)
y_scores_forest = y_probas_forest[:, 1]
y_scores_forest
fpr_forest, tpr_forest, thresholds_forest = roc_curve(y_train_5, y_scores_forest)
# 绘制ROC曲线
plt.plot(fpr, tpr, "b:", label="SGD")
plot_roc_curve(fpr_forest, tpr_forest, "Random Forest")
plt.legend(loc="lower right") # 右下角
plt.show()

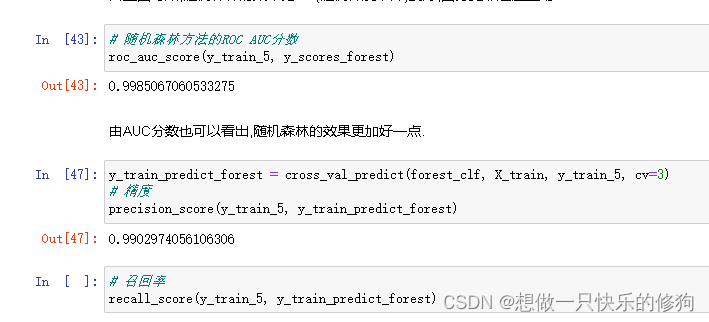
其他评估指标(AUC值、精度、召回率)如下:








![[附源码]JAVA毕业设计社区生活超市管理系统(系统+LW)](https://img-blog.csdnimg.cn/059b0fc131f34d8aac06848d6e8014f1.png)
![[附源码]Python计算机毕业设计SSM计算机学院课程设计管理系统(程序+LW)](https://img-blog.csdnimg.cn/145a2059650c4ae3886217ceb278088d.png)