目录
1.关于逻辑回归的原理解析和准备工作
2.关于激活函数
3.关于数据集
4.编写LogisticsRegression类
5.逻辑回归测试
6.结果
1.关于逻辑回归的原理解析和准备工作
逻辑回归原理相关内容,请参考博主的另一篇文章:机器学习(二)逻辑回归。在本文中的逻辑回归算法实现,不调用sklearn中的相关API,通过纯手写的方式,帮助学习理解逻辑回归的过程。
2.关于激活函数
本文采用Sigmoid函数作为激活函数(也叫逻辑斯谛函数),sigmoid的函数的公式如下:

sigmoid函数可以用于处理二分类问题,其函数图像如下:
import matplotlib.pyplot as plt
import numpy as np


class Sigmoid:
    @staticmethod
    def sigmoid(matrix):
        return 1 / (1 + np.exp(-matrix))


if __name__ == "__main__":
    x = np.linspace(-10, 10, 100)
    y = Sigmoid.sigmoid(x)
    plt.plot(x, y, "b.", label="sigmoid")
    plt.xlabel("x")
    plt.ylabel("y")
    plt.legend()
    plt.grid()
    plt.show()
3.关于数据集
本文采用sklearn中自带数据集iris,iris数据集数据分布状态如下:
import numpy as np
import pandas as pd
import matplotlib.pyplot as plt
from sklearn.datasets import load_iris

# 载入数据
iris = load_iris()
data = pd.DataFrame(data=iris.data, columns=iris.feature_names)
data["class"] = iris.target_names[iris["target"]]
x_axis = "petal length (cm)"
y_axis = "petal width (cm)"
for iris_type in iris.target_names:
    plt.scatter(data[x_axis][data["class"] == iris_type],
                data[y_axis][data["class"] == iris_type],
                label=iris_type)
plt.show()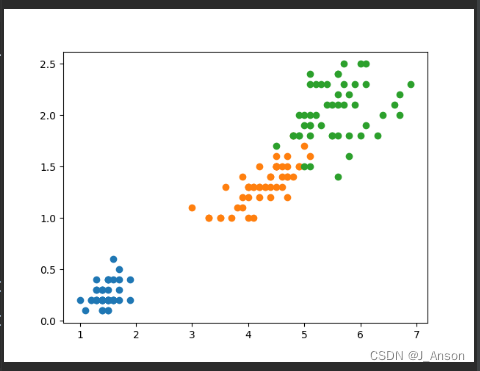
4.编写LogisticsRegression类
import numpy as np
from scipy.optimize import minimize
from utils.features import pre_for_training
from utils.hypothesis.sigmoid import Sigmoid


class LogisticRegression:
    def __init__(self,
                     data,
                     labels,
                     polynomial_degree=0,
                     sinusoid_degree=0,
                     normalize_data=True):
        """
        对数据预处理,获取所有特征个数,初始化参数矩阵
        :param data: 训练特征集
        :param labels: 训练目标值
        :param polynomial_degree: 特征变换
        :param sinusoid_degree: 特征变换
        :param normalize_data: 标准化数据处理
        """
        (data_processed, features_mean, features_deviation) = \
            pre_for_training.prepare(data=data,
                                        polynomial_degree=polynomial_degree,
                                        sinusoid_degree=sinusoid_degree,
                                        normalize_data=normalize_data)
        self.data = data_processed
        self.labels = labels
        self.unique_lables = np.unique(self.labels)
        self.features_mean = features_mean
        self.features_deviation = features_deviation
        self.polynomial_degree = polynomial_degree
        self.sinusoid_degree = sinusoid_degree
        self.normalize_data = normalize_data

        num_unique_labels = np.unique(self.labels).shape[0]
        num_features = self.data.shape[1]
        self.theta = np.zeros((num_unique_labels, num_features))


    def train(self, max_iterations=1000):
        loss_histories = []
        num_features = self.data.shape[1]
        for label_index, unique_label in enumerate(self.unique_lables):
            current_init_theta = np.copy(self.theta[label_index].reshape(num_features, 1))
            current_labels = (self.labels == unique_label).astype(float)
            (
            current_theta,
            loss_history
            ) = LogisticRegression.gradient_descent(data=self.data,
                                                    labels=current_labels,
                                                    current_init_theta=current_init_theta,
                                                    max_iterations=max_iterations)
            self.theta[label_index] = current_theta.T
            loss_histories.append(loss_history)
            return self.theta, loss_histories


    @staticmethod
    def gradient_descent(data, labels, current_init_theta, max_iterations):
        loss_history = []
        num_features = data.shape[1]
        result = minimize(
        fun=lambda current_theta:
            LogisticRegression.loss_function(data=data,
                                                labels=labels,
                                                theta=current_theta.reshape(num_features, 1)),
                                                x0=current_init_theta.reshape(num_features, ),
            method="CG",
            jac=lambda current_theta:
            LogisticRegression.gradient_step(data=data,
                                                labels=labels,
                                                theta=current_theta.reshape(num_features, 1)),
            callback=lambda current_theta:
            loss_history.append(LogisticRegression.loss_function(data=data,
                                                                labels=labels,
                                                                theta=current_theta.reshape(num_features, 1)),
            options={"maxiter": max_iterations}
            )
            if not result.success:
                raise ArithmeticError(f"[Cannot minimize loss function],msg:{result.message},res:{result.x}")
            optimized_theta = result.x.reshape(num_features, 1)
            return optimized_theta, loss_history


    @staticmethod
    def loss_function(data, labels, theta):
        num_examples = data.shape[0]
        predictions = LogisticRegression.hypothesis(data, theta)
        y_is_set_loss = np.dot(labels[labels == 1].T, np.log(predictions[labels == 1]))
        y_is_not_set_loss = np.dot(1 - labels[labels == 0].T, np.log(1 - predictions[labels == 0]))
        loss = (-1 / num_examples) * (y_is_set_loss + y_is_not_set_loss)
        return loss


    @staticmethod
    def gradient_step(data, labels, theta):
        num_examples = data.shape[0]
        predictions = LogisticRegression.hypothesis(data, theta)
        label_diff = predictions - labels
        gradients = (1 / num_examples) * np.dot(data.T, label_diff)
        return gradients.T.flatten()


    @staticmethod
    def hypothesis(data, theta):
        predictions = Sigmoid.sigmoid(np.dot(data, theta))
        return predictions


    def predict(self, data):
        num_examples = data.shape[0]
        (
        data_processed,
        features_mean,
        features_deviation
        ) = pre_for_training.prepare(data=data,
                                        polynomial_degree=self.polynomial_degree,
                                        sinusoid_degree=self.sinusoid_degree,
                                        normalize_data=self.normalize_data)

        prob = LogisticRegression.hypothesis(data_processed, self.theta.T)
        max_prb_index = np.argmax(prob, axis=1)
        class_prediction = np.empty(max_prb_index.shape, dtype=object)
        for index, label in enumerate(self.unique_lables):
            class_prediction[max_prb_index == index] = label
        return class_prediction.reshape((num_examples, 1))
5.逻辑回归测试
import numpy as np
import pandas as pd
import matplotlib.pyplot as plt
from logistic_regression import logical_regression
from sklearn.datasets import load_iris

# 载入数据
iris = load_iris()
data = pd.DataFrame(data=iris.data, columns=iris.feature_names)
data["class"] = iris.target_names[iris["target"]]
x_axis = "petal length (cm)"
y_axis = "petal width (cm)"
for iris_type in iris.target_names:
    plt.scatter(data[x_axis][data["class"] == iris_type],
                data[y_axis][data["class"] == iris_type],
                label=iris_type)
plt.show()


num_examples = data.shape[0]
x_train = data[[x_axis, y_axis]].values.reshape(num_examples, 2)
y_train = data["class"].values.reshape(num_examples, 1)

max_iterations = 1000
polynomial_degree = 0
sinusoid_degree = 0

logi_reg = logical_regression.LogisticRegression(data=x_train,
                                                    labels=y_train,
                                                    polynomial_degree=polynomial_degree,
                                                    sinusoid_degree=sinusoid_degree,
                                                    normalize_data=False)  # 不标准化

thetas, loss_histories = logi_reg.train(max_iterations=max_iterations)
plt.plot(range(len(loss_histories[0])), loss_histories[0], label=logi_reg.unique_lables[0])
plt.plot(range(len(loss_histories[1])), loss_histories[1], label=logi_reg.unique_lables[1])
plt.plot(range(len(loss_histories[2])), loss_histories[2], label=logi_reg.unique_lables[2])
plt.show()
y_train_predictions = logi_reg.predict(x_train)
precision = np.sum((y_train_predictions == y_train) / y_train.shape[0]) * 100
print("precision:", precision)


x_min = np.min(x_train[:, 0])
x_max = np.max(x_train[:, 0])
y_min = np.min(x_train[:, 1])
y_max = np.max(x_train[:, 1])

samples = 150
X = np.linspace(x_min, x_max, samples)
Y = np.linspace(y_min, y_max, samples)

Z_SETOSA = np.zeros((samples, samples))
Z_VERSICOLOR = np.zeros((samples, samples))
Z_VIRGINICA = np.zeros((samples, samples))

predictions = np.zeros((samples, samples))

for x_index, x in enumerate(X):
    for y_index, y in enumerate(Y):
        data = np.array([[x, y]])
        prediction = logi_reg.predict(data=data)[0][0]
        if prediction == "setosa":
            Z_SETOSA[x_index][y_index] = 1
        elif prediction == "versicolor":
            Z_VERSICOLOR[x_index][y_index] = 1
        elif prediction == "virginica":
            Z_VIRGINICA[x_index][y_index] = 1


for iris_type in ["setosa", "versicolor", "virginica"]:
    plt.scatter(
                x_train[(y_train == iris_type).flatten(), 0],
                x_train[(y_train == iris_type).flatten(), 1],
                label=iris_type
                )

plt.contour(X, Y, Z_SETOSA)
plt.contour(X, Y, Z_VERSICOLOR)
plt.contour(X, Y, Z_VIRGINICA)
plt.show()
6.结果
通过测试,可得到分类的准确率,如下:

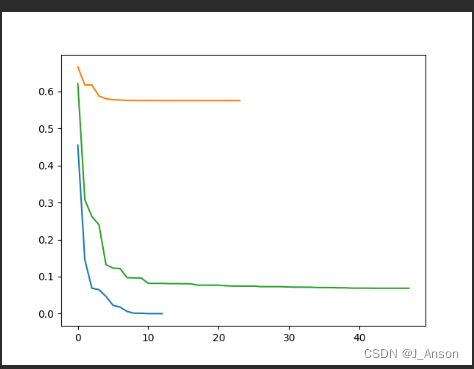
预测的损失,如下:
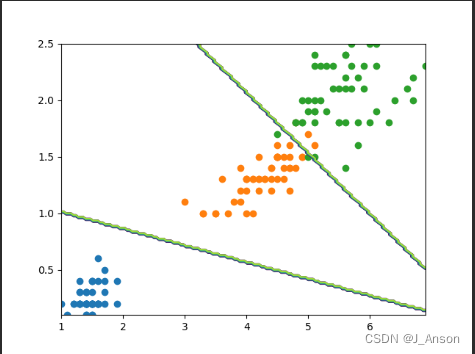
分类的边界线,如下:
