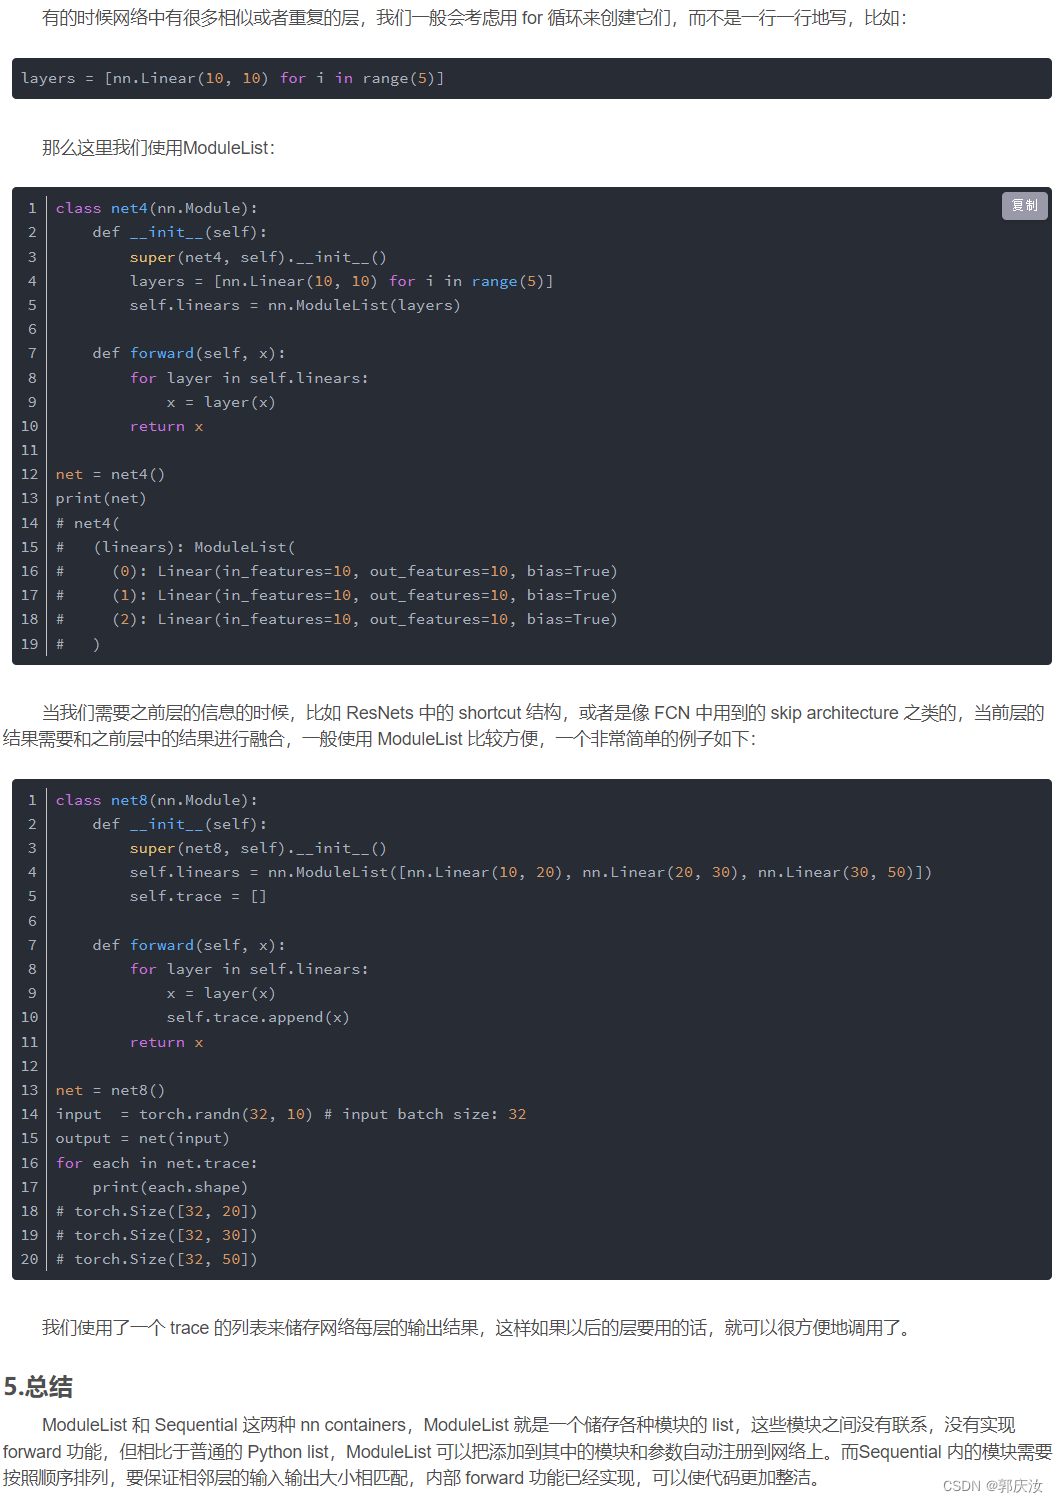
目录
- 一、磁盘性能测试
- 安装fio磁盘性能测试工具
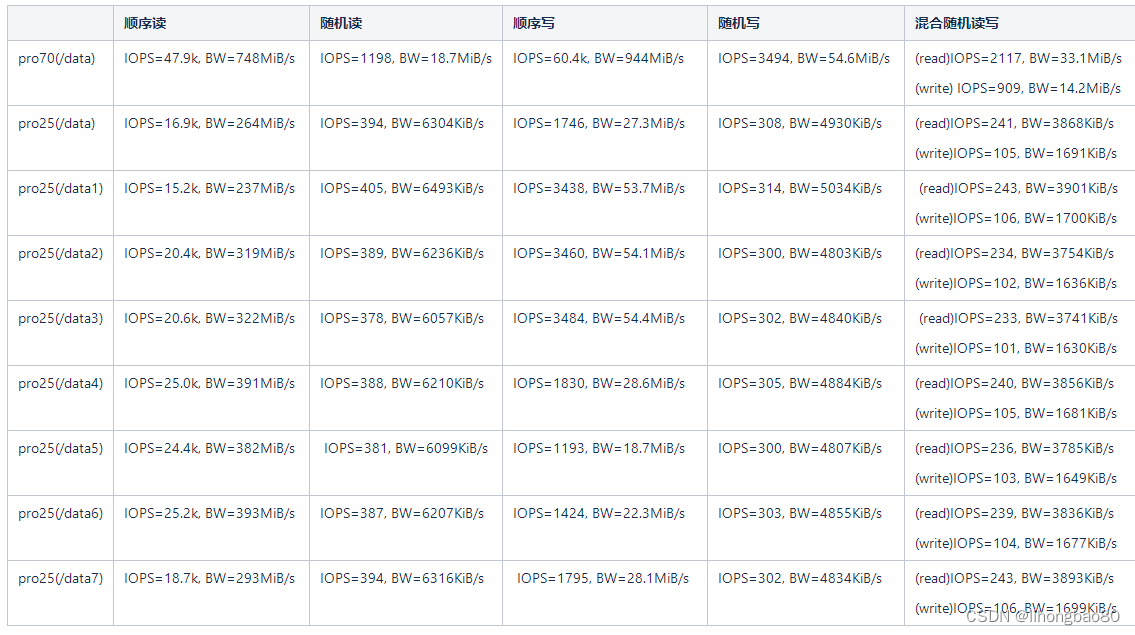
- 测试内容为顺序读、随机读、顺序写、随机写、随机读写
- 结果分析
- 二、CPU性能测试
- 安装sysbench性能测试工具
- 结果分析
- 三、内存性能测试
- 结果分析
- 四、网络性能测试
- 测试iperf3工具
- 测试结果分析
- 1.测试TCP吞吐量
- 2 . 测试UDP丢包和延迟
此次测试服务器为虚拟机(192.168.16.70),物理机(192.168.16.25)
测试内容包括:磁盘性能测试、CPU性能测试、内存性能测试、网络性能测试
一、磁盘性能测试
安装fio磁盘性能测试工具
yum -y install epel-release
yum install -y fio
yum install libaio-devel
测试内容为顺序读、随机读、顺序写、随机写、随机读写
fio  -filename=/data/fiotest  -direct=1 -iodepth 1 -thread -rw=read -ioengine=libaio -bs=16k -size=50G -numjobs=30 -runtime=100 -group_reporting -name=readtest

fio  -filename=/data/fiotest  -direct=1 -iodepth 1 -thread -rw=randread -ioengine=libaio -bs=16k -size=50G -numjobs=30 -runtime=100 -group_reporting -name=randreadtest

fio -filename=/data/fiotest -direct=1 -iodepth 1 -thread -rw=write -ioengine=libaio -bs=16k -size=50G -numjobs=30 -runtime=100 -group_reporting -name=writetest

fio -filename=/data/fiotest -direct=1 -iodepth 1 -thread -rw=randwrite -ioengine=libaio -bs=16k -size=50G -numjobs=30 -runtime=100 -group_reporting -name=randwritetest

fio -filename=/data/fiotest -direct=1 -iodepth 1 -thread -rw=randrw -rwmixread=70 -ioengine=libaio -bs=16k -size=50G -numjobs=30 -runtime=100 -group_reporting -name=randrwtest
参数定义
filename=/tmp/fiotest  支持文件系统或者裸设备,-filename=/dev/sda2或-filename=/dev/sdb

direct=1 测试过程绕过机器自带的buffer,使测试结果更真实

-thread:使用pthread_create创建线程,另一种是fork创建进程。进程的开销比线程要大,一般都采用thread测试。

rw=randwread 测试随机读的I/O

rw=randwrite 测试随机写的I/O

rw=randrw 测试随机混合写和读的I/O

rw=read 测试顺序读的I/O

rw=write 测试顺序写的I/O

rw=rw 测试顺序混合写和读的I/O

bs=4k 单次io的块文件大小为4k

bsrange=512-2048 同上,提定数据块的大小范围

size=50g 本次的测试文件大小为50g,以每次16k的io进行测试

numjobs=30 本次的测试线程为30

runtime=100 测试时间为100秒,如果不写则一直将50g文件分16k每次写完为止

ioengine=libaio io引擎使用libaio方式

#
rwmixwrite=30 在混合读写的模式下,写占30%

group_reporting 关于显示结果的,汇总每个进程的信息

lockmem=1g 只使用1g内存进行测试
zero_buffers 用0初始化系统
buffer nrfiles=8 每个进程生成文件的数量
结果分析
randreadtest: (g=0): rw=randread, bs=(R) 16.0KiB-16.0KiB, (W) 16.0KiB-16.0KiB, (T) 16.0KiB-16.0KiB, ioengine=libaio, iodepth=1
...
fio-3.7
Starting 30 threads

randreadtest: (groupid=0, jobs=30): err= 0: pid=70058: Mon Feb 13 14:03:04 2023
   read: IOPS=394, BW=6304KiB/s (6455kB/s)(1848MiB/300101msec)
    slat (usec): min=5, max=2693, avg=34.48, stdev=14.56
    clat (usec): min=131, max=1014.7k, avg=76084.14, stdev=80707.24
     lat (usec): min=165, max=1014.7k, avg=76119.37, stdev=80707.24
    clat percentiles (msec):
     |  1.00th=[    4],  5.00th=[    6], 10.00th=[    9], 20.00th=[   16],
     | 30.00th=[   25], 40.00th=[   35], 50.00th=[   48], 60.00th=[   66],
     | 70.00th=[   90], 80.00th=[  124], 90.00th=[  182], 95.00th=[  241],
     | 99.00th=[  372], 99.50th=[  426], 99.90th=[  567], 99.95th=[  634],
     | 99.99th=[  802]
   bw (  KiB/s): min=   31, max=  640, per=3.34%, avg=210.53, stdev=86.17, samples=17962
   iops        : min=    1, max=   40, avg=13.10, stdev= 5.39, samples=17962
  lat (usec)   : 250=0.01%, 500=0.02%, 750=0.01%
  lat (msec)   : 2=0.05%, 4=1.56%, 10=9.94%, 20=13.73%, 50=25.94%
  lat (msec)   : 100=22.34%, 250=21.98%, 500=4.22%, 750=0.19%, 1000=0.01%
  cpu          : usr=0.02%, sys=0.07%, ctx=118608, majf=0, minf=3452
  IO depths    : 1=100.0%, 2=0.0%, 4=0.0%, 8=0.0%, 16=0.0%, 32=0.0%, >=64=0.0%
     submit    : 0=0.0%, 4=100.0%, 8=0.0%, 16=0.0%, 32=0.0%, 64=0.0%, >=64=0.0%
     complete  : 0=0.0%, 4=100.0%, 8=0.0%, 16=0.0%, 32=0.0%, 64=0.0%, >=64=0.0%
     issued rwts: total=118242,0,0,0 short=0,0,0,0 dropped=0,0,0,0
     latency   : target=0, window=0, percentile=100.00%, depth=1

Run status group 0 (all jobs):
   READ: bw=6304KiB/s (6455kB/s), 6304KiB/s-6304KiB/s (6455kB/s-6455kB/s), io=1848MiB (1937MB), run=300101-300101msec

Disk stats (read/write):
  sda: ios=118184/928, merge=0/2224, ticks=8989961/890698, in_queue=9821141, util=100.00%
指标主要看每秒 I/O 数(iops) 和 硬盘传输数据流的速度(BW)
二、CPU性能测试
安装sysbench性能测试工具
yum -y install epel-release
yum -y install sysbench
结果分析
pro70
sysbench cpu --cpu-max-prime=20000 --threads=8 --time=30 run
sysbench 1.0.17 (using system LuaJIT 2.0.4)

Running the test with following options:
Number of threads: 8
Initializing random number generator from current time


Prime numbers limit: 20000

Initializing worker threads...

Threads started!

CPU speed:
    events per second:  2787.23

General statistics:
    total time:                          30.0028s
    total number of events:              83630

Latency (ms):
         min:                                    2.70
         avg:                                    2.87
         max:                                   19.43
         95th percentile:                        3.36
         sum:                               239795.21

Threads fairness:
    events (avg/stddev):           10453.7500/47.54
    execution time (avg/stddev):   29.9744/0.01

Prime numbers limit: 20000,每个线程产生的素数上限均为2000
events per second: 2787.23,所有线程每秒完成了2787.23次event
total time: 30.0028s,共耗时30秒
total number of events: 83630,30秒内所有线程一共完成了83630次event
min: 2.70,完成1次event的最少耗时2.70秒
avg: 2.87,所有event的平均耗时2.87毫秒
max: 19.43,完成1次event的最多耗时19.43毫秒
95th percentile: 3.36, 95%次event在3.36秒毫秒内完成
sum: 239795.21,每个线程耗时30秒,8个线程叠加耗时就是240秒
events (avg/stddev): 10453.7500/47.54 // 平均每个线程完成10453次event,标准差为47
execution time (avg/stddev): 29.9744/0.01 // 每个线程平均耗时30秒,标准差为0
pro25
sysbench cpu --cpu-max-prime=20000 --threads=8 --time=30 run

sysbench 1.0.17 (using system LuaJIT 2.0.4)

Running the test with following options:
Number of threads: 8
Initializing random number generator from current time


Prime numbers limit: 20000

Initializing worker threads...

Threads started!

CPU speed:
    events per second:  3799.96

General statistics:
    total time:                          30.0027s
    total number of events:              114027

Latency (ms):
         min:                                    2.03
         avg:                                    2.10
         max:                                    7.76
         95th percentile:                        2.39
         sum:                               239966.24

Threads fairness:
    events (avg/stddev):           14253.3750/22.81
    execution time (avg/stddev):   29.9958/0.00

Prime numbers limit: 20000,每个线程产生的素数上限均为2000
events per second: 3799.96 ,所有线程每秒完成了3799.96次event
total time: 30.0027s,共耗时30秒
total number of events: 114027,30秒内所有线程一共完成了114027次event
min: 2.03,完成1次event的最少耗时2.03秒
avg: 2.10,所有event的平均耗时2.10毫秒
max: 7.76,完成1次event的最多耗时7.76毫秒
95th percentile: 2.39, 95%次event在2.39秒毫秒内完成
sum: 239966.24,每个线程耗时30秒,8个线程叠加耗时就是240秒
events (avg/stddev): 14253.3750/22.81 // 平均每个线程完成14253.3750/22.81次event,标准差为23
execution time (avg/stddev): 29.9958/0.00 // 每个线程平均耗时30秒,标准差为0
三、内存性能测试
结果分析
pro70
sysbench memory --threads=12 --memory-block-size=8K --memory-total-size=100G --memory-access-mode=seq run
sysbench 1.0.17 (using system LuaJIT 2.0.4)

Running the test with following options:
Number of threads: 12
Initializing random number generator from current time


Running memory speed test with the following options:
  block size: 8KiB
  total size: 102400MiB
  operation: write
  scope: global

Initializing worker threads...

Threads started!

Total operations: 10112320 (1011060.89 per second)

79002.50 MiB transferred (7898.91 MiB/sec)


General statistics:
    total time:                          10.0001s
    total number of events:              10112320

Latency (ms):
         min:                                    0.00
         avg:                                    0.01
         max:                                   28.03
         95th percentile:                        0.01
         sum:                               116284.49

Threads fairness:
    events (avg/stddev):           842693.3333/45270.47
    execution time (avg/stddev):   9.6904/0.04


total number of events:  13107200    读/写一个内存块的events数
min:  0.00  最小耗时 这里等于0是因为内存块太小,返回的结果数值精度不够
sum: 62961.90    所有线程总耗时62962ms
events (avg/stddev):  1638400.0000/0.00   平均每线程完成events数1638400/标准差0
execution time (avg/stddev):   7.8702/1.15      平均每线程执行时间8s 标准差1s
pro25
sysbench memory --threads=12 --memory-block-size=8K --memory-total-size=100G --memory-access-mode=seq run
sysbench 1.0.17 (using system LuaJIT 2.0.4)

Running the test with following options:
Number of threads: 12
Initializing random number generator from current time


Running memory speed test with the following options:
  block size: 8KiB
  total size: 102400MiB
  operation: write
  scope: global

Initializing worker threads...

Threads started!

Total operations: 7038742 (703511.93 per second)

54990.17 MiB transferred (5496.19 MiB/sec)


General statistics:
    total time:                          10.0002s
    total number of events:              7038742

Latency (ms):
         min:                                    0.00
         avg:                                    0.02
         max:                                    0.49
         95th percentile:                        0.02
         sum:                               118420.01

Threads fairness:
    events (avg/stddev):           586561.8333/6249.45
    execution time (avg/stddev):   9.8683/0.00

total number of events:  7038742   读/写一个内存块的events数
min:  0.00  最小耗时 这里等于0是因为内存块太小,返回的结果数值精度不够
sum: 118420.01    所有线程总耗时118420ms
events (avg/stddev):  586561.8333/6249.45   平均每线程完成events数586562/标准差6249
execution time (avg/stddev):   9.8683/0.00      平均每线程执行时间10s 标准差0s
四、网络性能测试
测试iperf3工具
yum install -y sysstat wget tar automake make gcc
wget https://downloads.es.net/pub/iperf/iperf-3.9.tar.gz
tar -zxvf iperf-3.9.tar.gz
cd iperf-3.9
./configure && make && make install
测试结果分析
要使用iperf,首先要启用一个服务端,这里指定服务端的IP地址为pro70,在此服务器上运行“iperf3 -s -i 2”即可开启iperf的服务器模式。在默认情况下,iperf3将在服务端打开一个5201监听端口,此时就可以在pro25服务器作为客户端执行iperf功能测试了。
pro70
[root@pro70 ~]# iperf3 -s -i 2
-----------------------------------------------------------
Server listening on 5201
-----------------------------------------------------------
1.测试TCP吞吐量
pro25
[root@pro25 ~]# iperf3 -c 192.168.16.70 -F /data/fiotest -i 5 -t 180
Connecting to host 192.168.16.70, port 5201
[  5] local 192.168.16.25 port 51856 connected to 192.168.16.70 port 5201
[ ID] Interval           Transfer     Bitrate         Retr  Cwnd
[  5]   0.00-5.00   sec  4.76 GBytes  8.17 Gbits/sec  670   1.18 MBytes
[  5]   5.00-10.00  sec  4.80 GBytes  8.25 Gbits/sec  237    854 KBytes
[  5]  10.00-15.00  sec  4.78 GBytes  8.21 Gbits/sec  1172    604 KBytes
[  5]  15.00-20.01  sec  2.21 GBytes  3.79 Gbits/sec   28   1014 KBytes
[  5]  20.01-25.00  sec  1.10 GBytes  1.90 Gbits/sec   42    788 KBytes
[  5]  25.00-30.00  sec  1.06 GBytes  1.83 Gbits/sec   71    274 KBytes
[  5]  30.00-35.00  sec  1.08 GBytes  1.85 Gbits/sec   32    389 KBytes
[  5]  35.00-40.00  sec  1.09 GBytes  1.86 Gbits/sec   20    365 KBytes
[  5]  40.00-45.00  sec  1.10 GBytes  1.88 Gbits/sec   98    304 KBytes
[  5]  45.00-50.00  sec  1.08 GBytes  1.85 Gbits/sec   22    393 KBytes
[  5]  50.00-55.00  sec  1.10 GBytes  1.88 Gbits/sec    1    406 KBytes
[  5]  55.00-60.00  sec  1.06 GBytes  1.82 Gbits/sec   43    337 KBytes
[  5]  60.00-65.00  sec  1.10 GBytes  1.88 Gbits/sec    0    397 KBytes
[  5]  65.00-70.00  sec  1.09 GBytes  1.88 Gbits/sec    0    403 KBytes
[  5]  70.00-75.00  sec  1.10 GBytes  1.89 Gbits/sec    0    419 KBytes
[  5]  75.00-80.00  sec  1.07 GBytes  1.84 Gbits/sec    0    427 KBytes
[  5]  80.00-85.00  sec  1.09 GBytes  1.88 Gbits/sec    0    434 KBytes
[  5]  85.00-90.00  sec  1.09 GBytes  1.88 Gbits/sec    0    443 KBytes
[  5]  90.00-95.00  sec  1.09 GBytes  1.87 Gbits/sec    0    448 KBytes
[  5]  95.00-100.02 sec  1.06 GBytes  1.81 Gbits/sec    0    457 KBytes
[  5] 100.02-105.00 sec  1.09 GBytes  1.88 Gbits/sec    0    465 KBytes
[  5] 105.00-110.00 sec  1.06 GBytes  1.82 Gbits/sec    0    475 KBytes
[  5] 110.00-115.00 sec  1.09 GBytes  1.87 Gbits/sec    0    496 KBytes
[  5] 115.00-120.01 sec  1.09 GBytes  1.88 Gbits/sec    0    663 KBytes
[  5] 120.01-125.00 sec  1.09 GBytes  1.88 Gbits/sec    0    663 KBytes
[  5] 125.00-130.00 sec  1.09 GBytes  1.87 Gbits/sec    0   1003 KBytes
[  5] 130.00-135.00 sec  1.06 GBytes  1.82 Gbits/sec    0   1003 KBytes
[  5] 135.00-140.00 sec  1.08 GBytes  1.86 Gbits/sec    0   1003 KBytes
[  5] 140.00-145.00 sec  1.10 GBytes  1.89 Gbits/sec    0   1003 KBytes
[  5] 145.00-150.00 sec  1.09 GBytes  1.87 Gbits/sec    0   1.42 MBytes
[  5] 150.00-155.00 sec  1.09 GBytes  1.87 Gbits/sec    0   1.42 MBytes
[  5] 155.00-160.00 sec  1.09 GBytes  1.88 Gbits/sec    0   1.42 MBytes
[  5] 160.00-165.00 sec  1.09 GBytes  1.87 Gbits/sec    0   1.42 MBytes
[  5] 165.00-170.00 sec  1.04 GBytes  1.78 Gbits/sec   33   1.01 MBytes
[  5] 170.00-174.36 sec   982 MBytes  1.89 Gbits/sec    0   1.01 MBytes
- - - - - - - - - - - - - - - - - - - - - - - - -
[ ID] Interval           Transfer     Bitrate         Retr
[  5]   0.00-174.36 sec  50.0 GBytes  2.46 Gbits/sec  2469             sender
        Sent 50.0 GByte / 50.0 GByte (100%) of /data/fiotest
[  5]   0.00-174.36 sec  50.0 GBytes  2.46 Gbits/sec                  receiver

iperf Done.
在这此测试中 我们通过“-F”参数指定了一个50G的fiotest文件作为iperf要传输的数据,需要同时指定一个“-t”参数来设置要测试传输的时间,这个时间尽量设置长一些,因为在默认传输时间10秒内,这个文件可能还没有传完。
通过结果我们可以看到传输速率平均在2.46 Gbits/sec
2 . 测试UDP丢包和延迟
iperf也可以用于UDP数据包吞吐量、丢包率和延迟指标,但是由于UDP协议是一个非面向连接的轻量级传输协议,并且不提供可靠的数据传输服务,因此对UDP应用的关注点不是传输数据有多快,而是它的丢包率和延时指标。通过iperf的“-u”参数即可测试UDP应用的传输性能
pro70
[root@pro25 ~]# iperf3 -c 192.168.16.70 -u -b 1G -f M -i 3
Connecting to host 192.168.16.70, port 5201
[  5] local 192.168.16.25 port 47184 connected to 192.168.16.70 port 5201
[ ID] Interval           Transfer     Bitrate         Total Datagrams
[  5]   0.00-3.00   sec   358 MBytes   119 MBytes/sec  258918
[  5]   3.00-6.00   sec   358 MBytes   119 MBytes/sec  258955
[  5]   6.00-9.00   sec   356 MBytes   119 MBytes/sec  257490
[  5]   9.00-10.00  sec   121 MBytes   121 MBytes/sec  87860
- - - - - - - - - - - - - - - - - - - - - - - - -
[ ID] Interval           Transfer     Bitrate         Jitter    Lost/Total Datagrams
[  5]   0.00-10.00  sec  1.16 GBytes   119 MBytes/sec  0.000 ms  0/863223 (0%)  sender
[  5]   0.00-10.00  sec  1.16 GBytes   118 MBytes/sec  0.008 ms  5513/863223 (0.64%)  receiver

iperf Done.
此次测试使用iperf3传输1DB的UDP数据包的输出结果
重点关注虚线下的一段内容,在这段输出中,“Jitter”列表示抖动时间,或者称为传输延迟,“Lost/Total”列表示丢失的数据报和总的数据报数量,后面的0%是平均丢包的比率。
这个输出结果过于简单,要了解更详细的UDP丢包和延时信息,可以在iperf服务端查看,因为在客户端执行传输测试的同时,服务端也会同时显示传输状态