文章目录
- 1. 形状和路径
- 1.1 PatchCollection替换热力图数字
- 1.1.1原始的数字代码
- 1.1.2 替换为PatchCollection的代码
- 1.2 PatchCollection绘制目标检测(COCO)标签
- 1.3 PatchCollection绘制分割(COCO)标签
- 2. 底纹(hatch)
- 2.1 简单示例(add_patch)
- 2.2 add_artist和add_collection(PatchCollection)中hatch设置
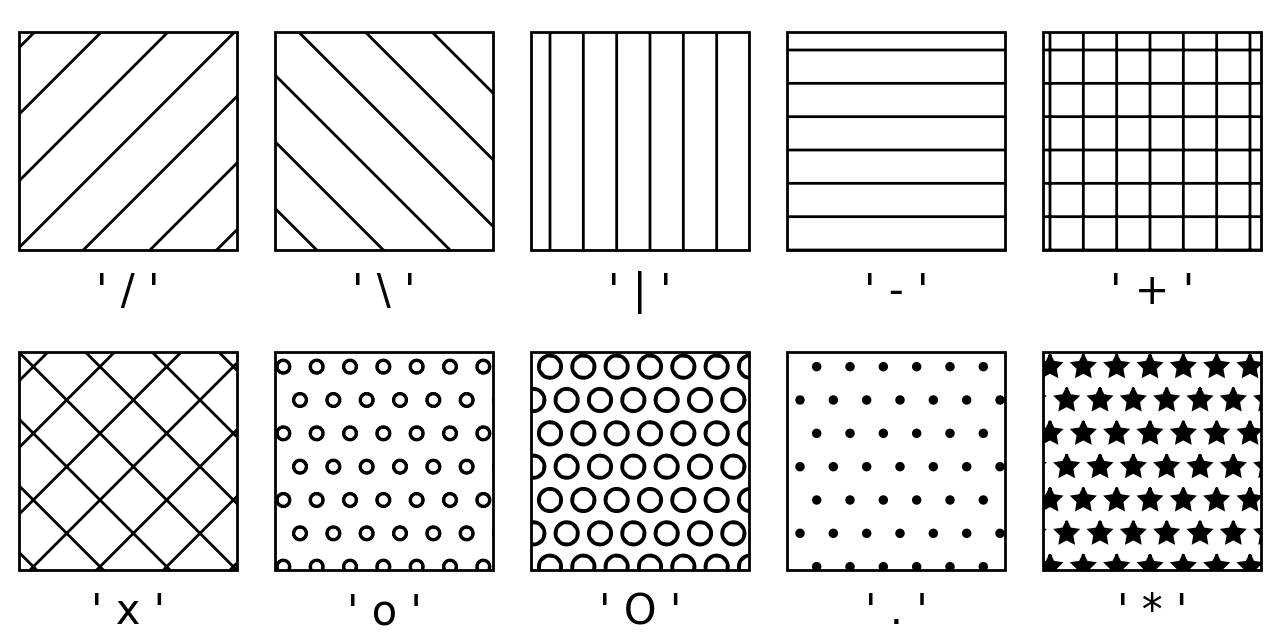
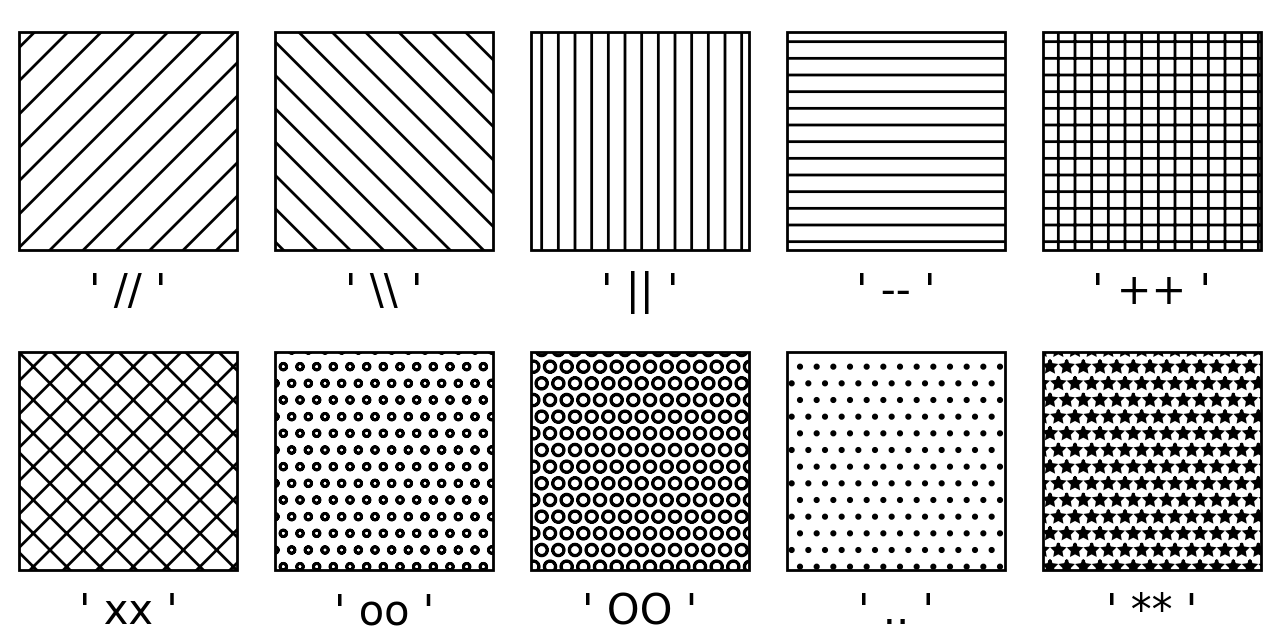
- 2.3 底纹样式列表
1. 形状和路径
先去看这个CSDN博客:matplotlib高级教程之形状与路径——patches和path
- 这个讲了一下patches和path大概是什么东西,就不搬过来了,
- 要是嫌排版丑,可以看这个简书上转载的这篇:matplotlib 之形状与路径:patches和path
参考:
- matplotlib-Reference for Matplotlib artists,左侧
Shapes and collections这一个栏目都可以点点看 - 简书:matplotlib 之形状与路径:patches和path
- 实际上转自CSDN博客:matplotlib高级教程之形状与路径——patches和path
- Matplotlib添加自定义形状
1.1 PatchCollection替换热力图数字
1.1.1原始的数字代码
import numpy as np
import matplotlib
import matplotlib as mpl
import matplotlib.pyplot as plt
from matplotlib import colormaps as cm
from matplotlib.collections import PatchCollection
import matplotlib.patches as mpatches
# %matplotlib inline
%matplotlib ipympl

vegetables = ["cucumber", "tomato", "lettuce", "asparagus",
              "potato", "wheat", "barley"]
farmers = ["Farmer Joe", "Upland Bros.", "Smith Gardening",
           "Agrifun", "Organiculture", "BioGoods Ltd.", "Cornylee Corp."]


harvest = np.array([[0.8, 2.4, 2.5, 3.9, 0.0, 4.0, 0.0],
                    [2.4, 0.0, 4.0, 1.0, 2.7, 0.0, 0.0],
                    [1.1, 2.4, 0.8, 4.3, 1.9, 4.4, 0.0],
                    [0.6, 0.0, 0.3, 0.0, 3.1, 0.0, 0.0],
                    [0.7, 1.7, 0.6, 2.6, 2.2, 6.2, 0.0],
                    [1.3, 1.2, 0.0, 0.0, 0.0, 3.2, 5.1],
                    [0.1, 2.0, 0.0, 1.4, 0.0, 1.9, 6.3]])


fig, ax = plt.subplots()

cb = plt.colorbar(matplotlib.cm.ScalarMappable(cmap = "RdBu_r"),location= "right")
cb.set_label('Y',loc='top')

# 1. 数字显示
# 默认以图像方式显示其实就和热力图效果差不多。。
im = ax.imshow(harvest,cmap='RdBu_r')
# imshow和matshow,对于热力图显示来说,是差不多的,x轴一个在上,一个在下
# https://matplotlib.org/stable/api/_as_gen/matplotlib.pyplot.matshow.html#matplotlib.pyplot.matshow
# im = ax.matshow(harvest,cmap='RdBu_r')

# 为每个格子设置数字label
for i in range(len(farmers)):
    for j in range(len(vegetables)):
        text = ax.text(j, i, harvest[i, j],
                       ha="center", va="center", color="w",fontsize=10)
 # 设置x轴和y轴刻度是上面的类别
ax.set_xticks(np.arange(len(farmers)), labels=farmers,fontsize=10)
ax.set_yticks(np.arange(len(vegetables)), labels=vegetables,fontsize=10)
# ax.set_yticks(np.arange(len(vegetables)), np.arange(len(vegetables)),fontsize=10)

# 旋转x轴刻度,保证显示和对齐
plt.setp(ax.get_xticklabels(), rotation=15, ha="right",
         rotation_mode="anchor")
plt.autoscale(enable=True, axis='both', tight=True)
ax.set_xlabel('X')
ax.set_ylabel('y')
# 这个label设置参考:
# <https://matplotlib.org/stable/gallery/shapes_and_collections/ellipse_collection.html#sphx-glr-gallery-shapes-and-collections-ellipse-collection-py>

plt.show()
# plt.close("all")
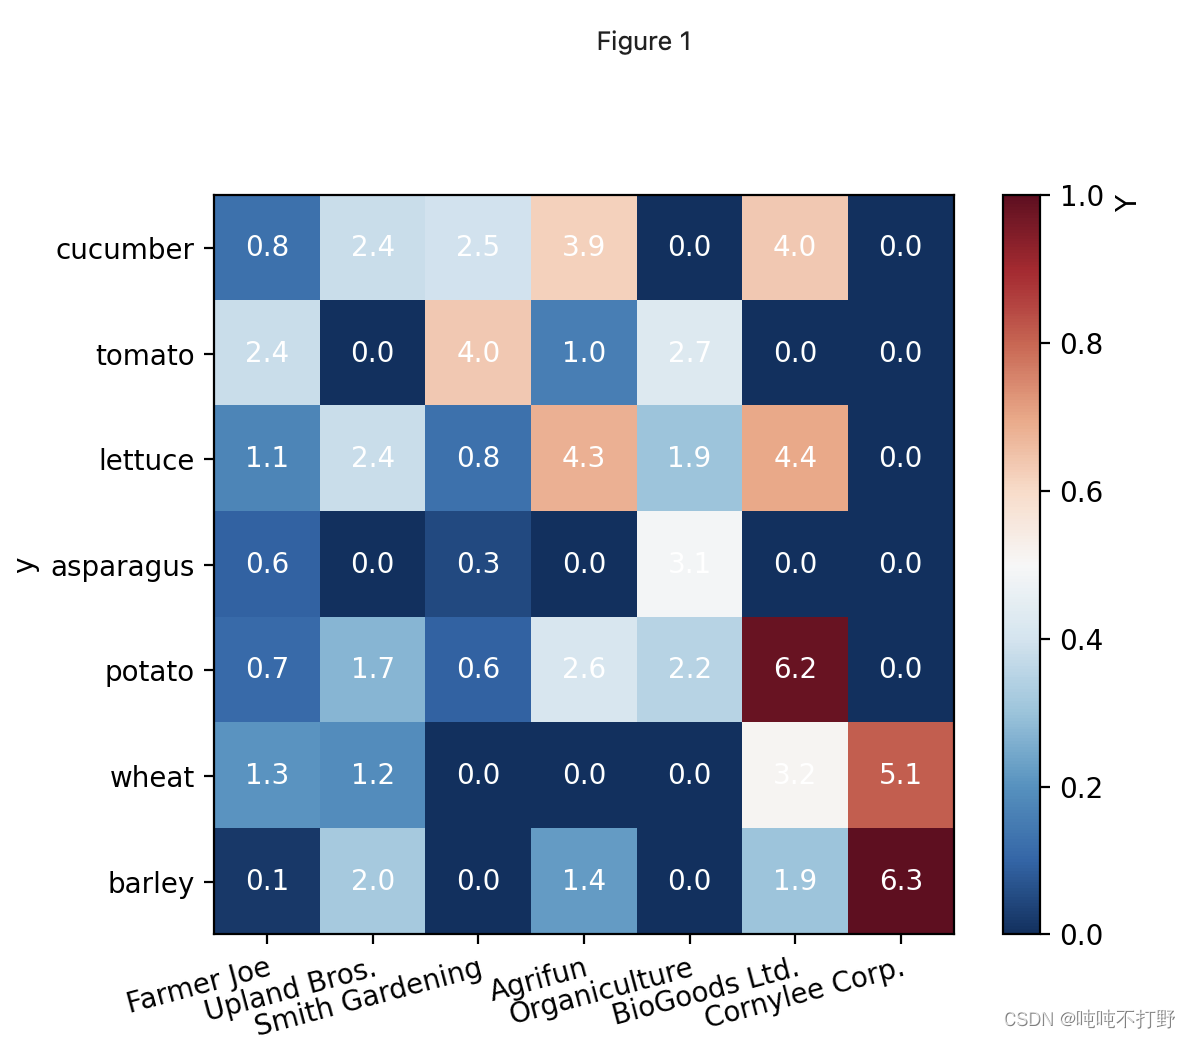
参考: https://matplotlib.org/stable/gallery/images_contours_and_fields/image_annotated_heatmap.html
1.1.2 替换为PatchCollection的代码
import numpy as np
import matplotlib
import matplotlib as mpl
import matplotlib.pyplot as plt
from matplotlib import colormaps as cm
from matplotlib.collections import PatchCollection
import matplotlib.patches as mpatches
# %matplotlib inline
%matplotlib ipympl

vegetables = ["cucumber", "tomato", "lettuce", "asparagus","potato", "wheat", "barley"]
farmers = ["Farmer Joe", "Upland Bros.", "Smith Gardening",
           "Agrifun", "Organiculture", "BioGoods Ltd.", "Cornylee Corp."]


harvest = np.array([[0.8, 2.4, 2.5, 3.9, 0.0, 4.0, 0.0],
                    [2.4, 0.0, 4.0, 1.0, 2.7, 0.0, 0.0],
                    [1.1, 2.4, 0.8, 4.3, 1.9, 4.4, 0.0],
                    [0.6, 0.0, 0.3, 0.0, 3.1, 0.0, 0.0],
                    [0.7, 1.7, 0.6, 2.6, 2.2, 6.2, 0.0],
                    [1.3, 1.2, 0.0, 0.0, 0.0, 3.2, 5.1],
                    [0.1, 2.0, 0.0, 1.4, 0.0, 1.9, 6.3]])

fig2, ax2 = plt.subplots()

allCircles=[]
R = harvest/harvest.max()/2
xLen = len(farmers)
yLen= len(vegetables)
for i in range(xLen):
    for j in range(yLen):
        allCircles.append(mpatches.Circle((j,i),R[j][i]))

col = PatchCollection(allCircles, array =R.flat, cmap="RdBu_r")

ax2.add_collection(col)
colorbar = plt.colorbar(col)
colorbar.set_label('y', rotation=360,loc="top")

# 这里默认设置主要刻度
ax2.set_xticks(np.arange(len(farmers)), labels=farmers,fontsize=10)
ax2.set_yticks(np.arange(len(vegetables)), labels=vegetables,fontsize=10)
# ax.set_yticks(np.arange(len(vegetables)), np.arange(len(vegetables)),fontsize=10)

# 关键是这里的这个minor参数,负责设置主要刻度还是次要刻度。
# If ``False``, set the major ticks; if ``True``, the minor ticks.
# 这里设置次要刻度,有了次要刻度后,每个圆心都对应次要刻度
ax2.set_xticks(np.arange(7+1)-0.5,minor=True)
ax2.set_yticks(np.arange(7+1)-0.5,minor=True)
ax2.grid(which='minor')

# 旋转x轴刻度,保证显示和对齐
plt.setp(ax2.get_xticklabels(), rotation=15, ha="right",
         rotation_mode="anchor")
plt.autoscale(enable=True, axis='both', tight=True)
ax2.set_xlabel('X')
ax2.set_ylabel('Y')
plt.imshow()
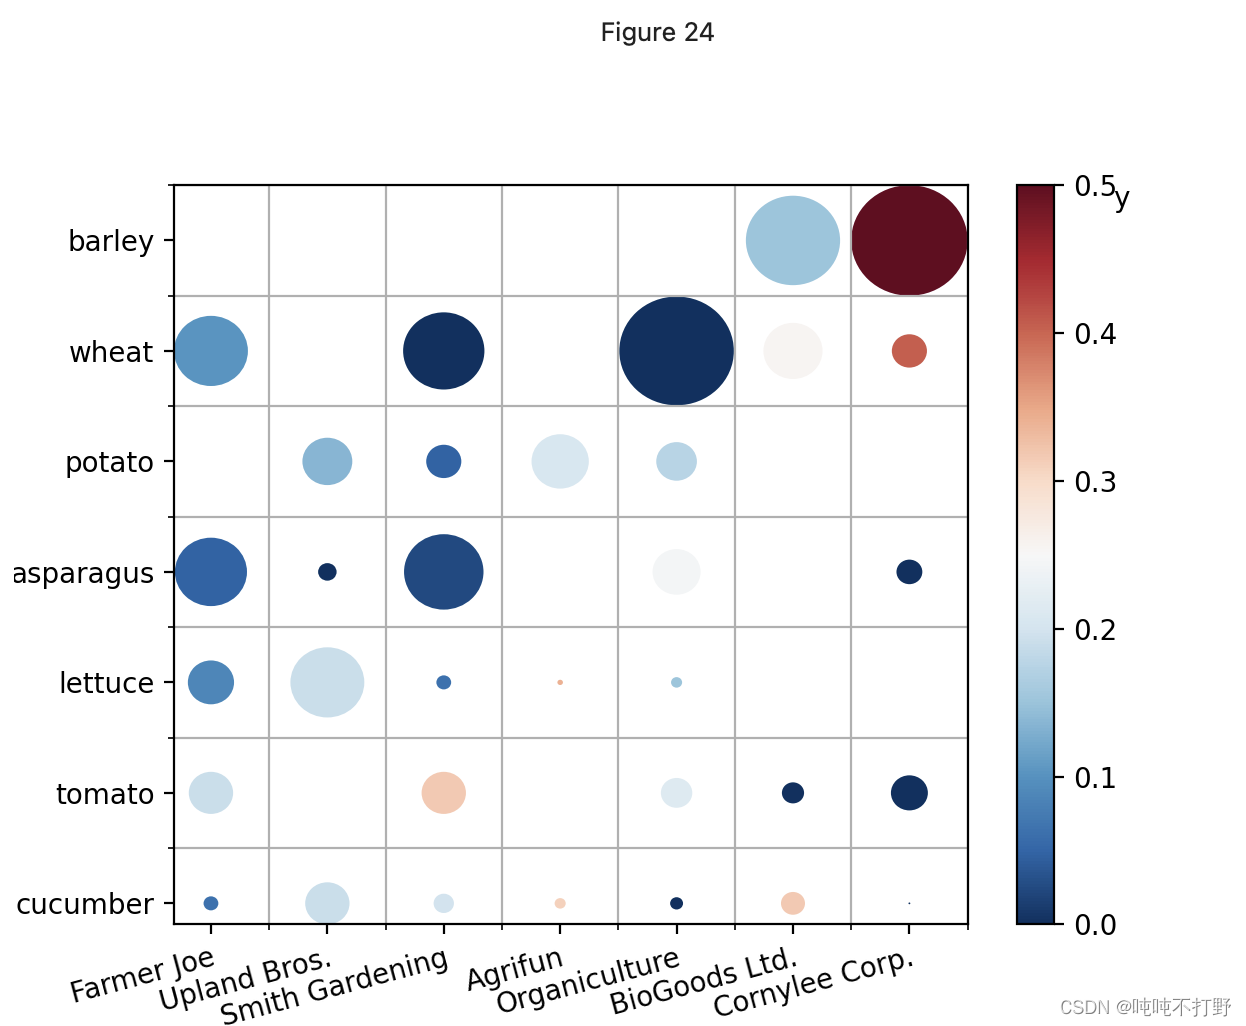
参考:
- CSDN博客:【matplotlib】使用PatchCollection绘制带圆圈的热力图
- stackoverflow:setting color range in matplotlib patchcollection
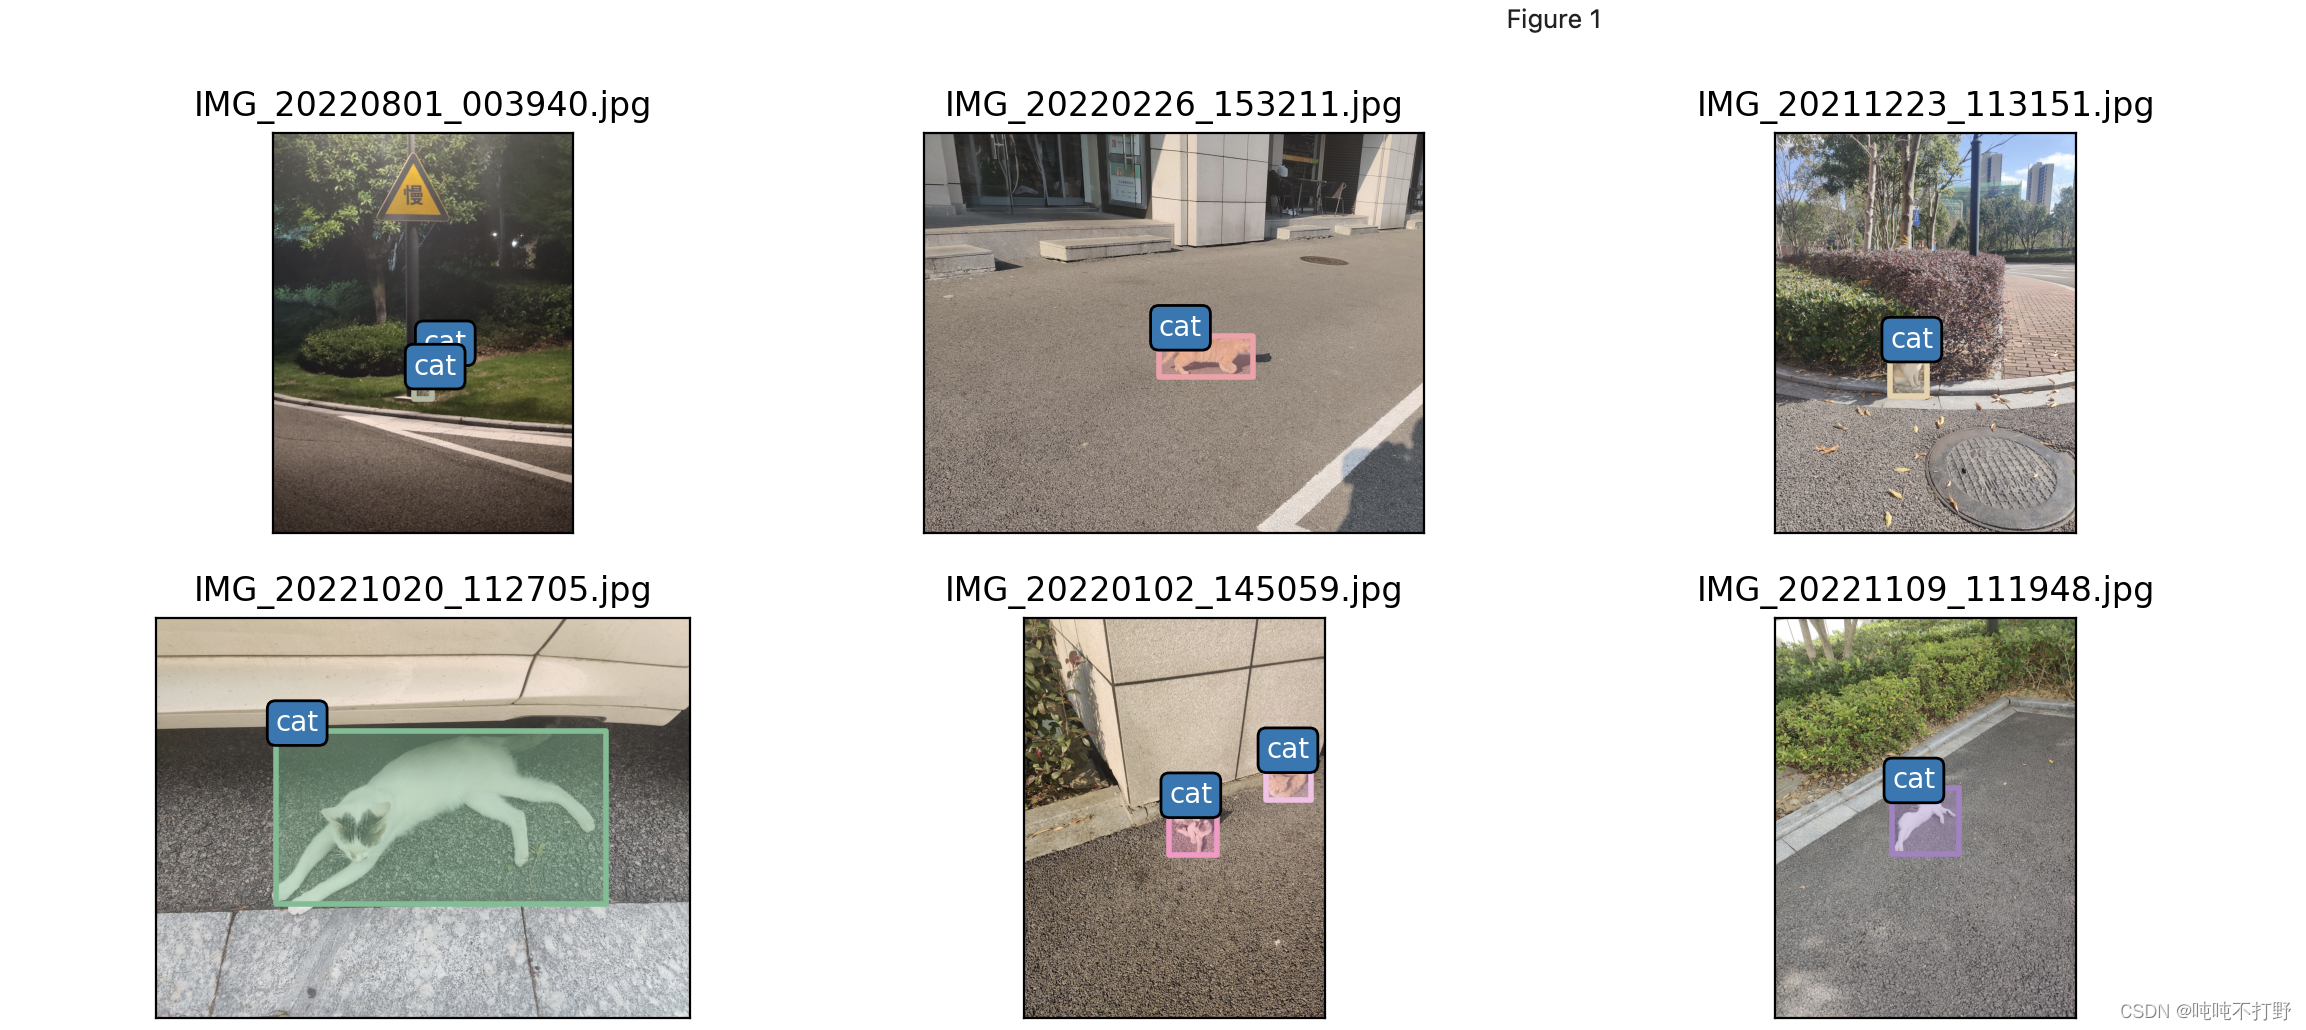
1.2 PatchCollection绘制目标检测(COCO)标签
这是基于coco标记格式进行的,代码如下:
from pycocotools.coco import COCO
import numpy as np
from PIL import Image,ImageOps
from matplotlib.collections import PatchCollection
from matplotlib.patches import Polygon

def show_box_only(coco,anns,show_label_bbox=True,is_filling=True):
    """
    coco:定义的coco对象
    anns:coco对象里得到的标注对象
    show_label_bbox:是否显示标签
    is_filling:是否对box进行填充
    """
    ax = plt.gca()
    ax.set_autoscale_on(False)
    polygons = []
    color = []

    image2color = dict()
    image2color[0]="orchid"
    image2color[1]="tab:blue"
    image2color[2]="pink"

    for ann in anns:
        # 随机生成一个0~1之间的数,作为box颜色
        c = (np.random.random((1, 3))*0.6+0.4).tolist()[0]
        # 获取bbox坐标
        [bbox_x, bbox_y, bbox_w, bbox_h] = ann['bbox']
        # Polygon需要接受四个点的坐标,顺时针或者逆时针都行
        poly = [[bbox_x, bbox_y], [bbox_x, bbox_y+bbox_h], [bbox_x+bbox_w, bbox_y+bbox_h], [bbox_x+bbox_w, bbox_y]]
        np_poly = np.array(poly).reshape((4,2))
        polygons.append(Polygon(np_poly))
        color.append(c)

        # 显示label文字
        if show_label_bbox:
            label_box = dict(facecolor =image2color[ann['category_id']], boxstyle="Round")
            # print(image2color[ann['category_id']])
            ax.text(bbox_x, bbox_y, f"{coco.loadCats(ann['category_id'])[0]['name']}", color="white",fontsize=10,bbox=label_box)
        else:
            pass
    if is_filling:
        # 显示前景色
        p = PatchCollection(polygons, facecolor=color, linewidths=0, alpha=0.4)
        ax.add_collection(p)
    # 只画框
    p = PatchCollection(polygons, facecolor='none', edgecolors=color, linewidths=2)
    ax.add_collection(p)


# 调用上面的函数
import os

dataDir= "datasets/cat_dataset/images"
annFile='datasets/cat_dataset/annotations/annotations_all.json'

coco = COCO(annotation_file=annFile)
image_ids=coco.getImgIds()
np.random.shuffle(image_ids)

plt.figure(figsize=(16,5))
for i in range(8):
    image_data=coco.loadImgs(image_ids[i])[0]
    img_path = os.path.join(dataDir,image_data.get("file_name"))

    annotation_ids = coco.getAnnIds(imgIds=image_data['id'])
    annotation = coco.loadAnns(annotation_ids)

    ax=plt.subplot(2,4,i+1)
    image = Image.open(img_path)
    imageWithEXIF=ImageOps.exif_transpose(image)
    ax.imshow(imageWithEXIF)

    show_box_only(coco,annotation)
    plt.title(image_data["file_name"])
    plt.xticks([])
    plt.yticks([])
plt.tight_layout()
1.3 PatchCollection绘制分割(COCO)标签
和上面差不多,效果如下:

2. 底纹(hatch)
其实matplotlib里的绘制和ppt里很像,都有形状,也有底纹颜色等的设置,比如:
2.1 简单示例(add_patch)
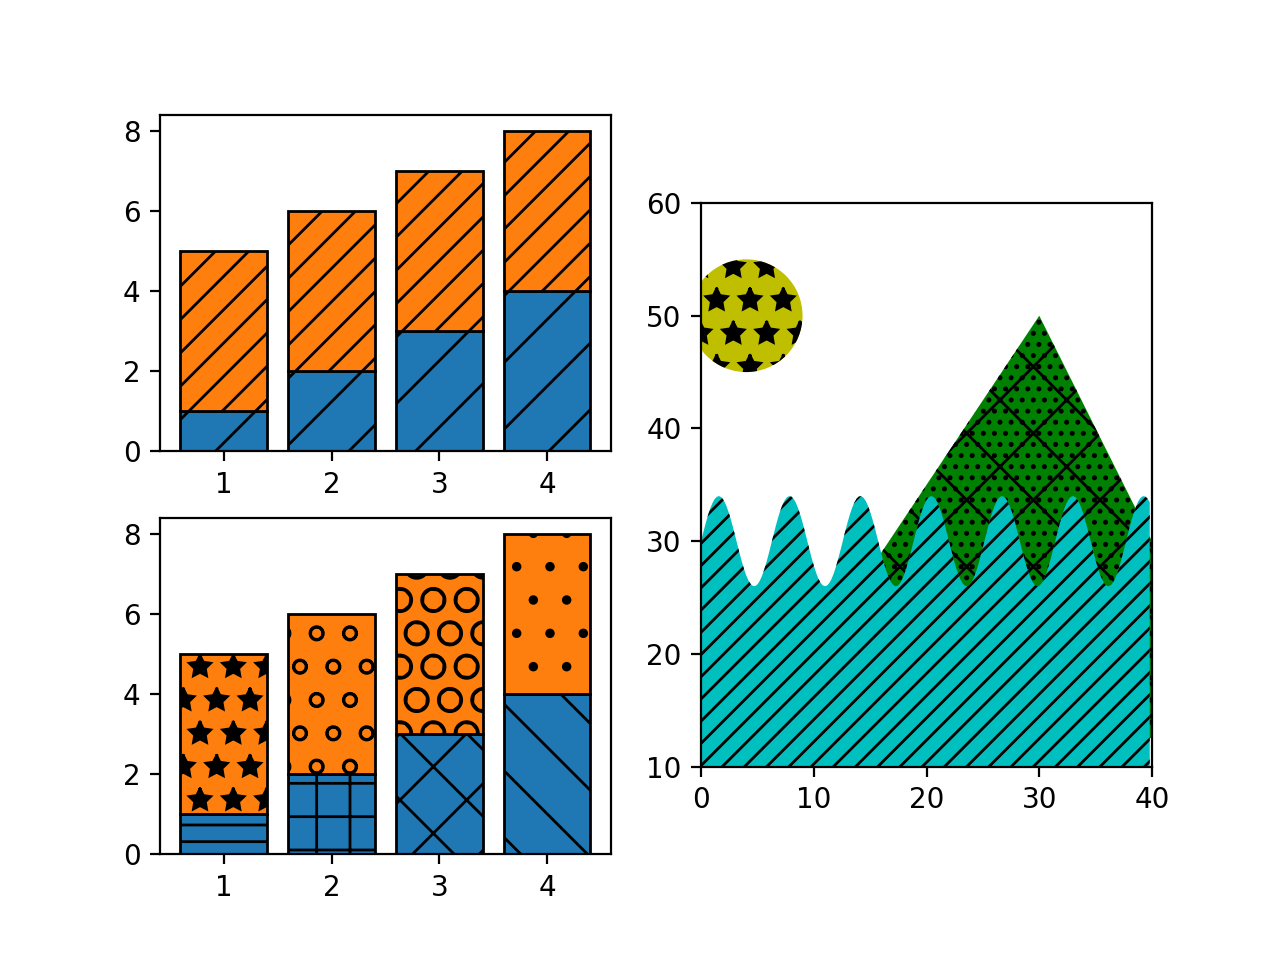
以下是来自:Hatch demo的示例
hatch底纹的颜色默认和edgecolor(ec)一致,不设置默认就是黑色
import numpy as np
import matplotlib.pyplot as plt
from matplotlib.patches import Ellipse, Polygon

x = np.arange(1, 5)
y1 = np.arange(1, 5)
y2 = np.ones(y1.shape) * 4

fig = plt.figure()
axs = fig.subplot_mosaic([['bar1', 'patches'], ['bar2', 'patches']])

axs['bar1'].bar(x, y1, edgecolor='black', hatch="/")
axs['bar1'].bar(x, y2, bottom=y1, edgecolor='black', hatch='//')

axs['bar2'].bar(x, y1, edgecolor='black', hatch=['--', '+', 'x', '\\'])
axs['bar2'].bar(x, y2, bottom=y1, edgecolor='black',
                hatch=['*', 'o', 'O', '.'])

x = np.arange(0, 40, 0.2)
axs['patches'].fill_between(x, np.sin(x) * 4 + 30, y2=0,
                            hatch='///', zorder=2, fc='c')
"""
1. add_patch的hatch设置
"""
axs['patches'].add_patch(Ellipse((4, 50), 10, 10, fill=True,
                                 hatch='*', facecolor='y'))
axs['patches'].add_patch(Polygon([(10, 20), (30, 50), (50, 10)],
                                 hatch='\\/...', facecolor='g'))
axs['patches'].set_xlim([0, 40])
axs['patches'].set_ylim([10, 60])
axs['patches'].set_aspect(1)
plt.show()
2.2 add_artist和add_collection(PatchCollection)中hatch设置
from matplotlib.collections import PatchCollection
import matplotlib.patches as mpatches
import matplotlib as mlp
import numpy as np

"""
2. add_artist中patches的hatch设置
"""
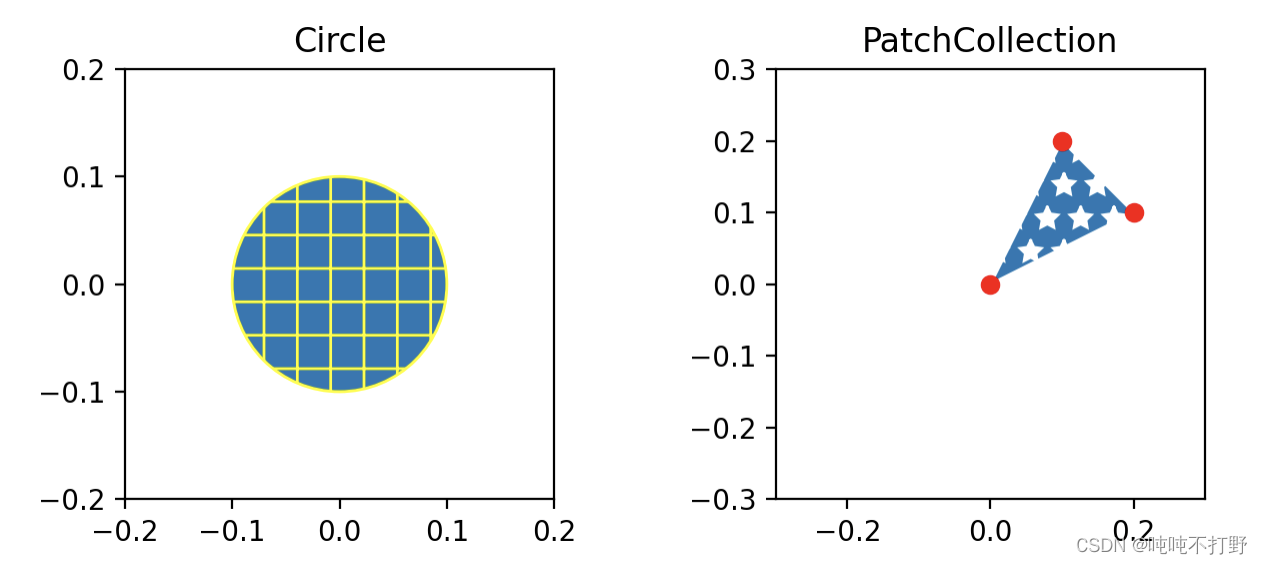
circle = mpatches.Circle((0, 0), 0.1, ec="yellow",hatch="+")


path = np.array([[0,0],[0.1,0.2],[0.2,0.1]])
patchWithPolygon = PatchCollection([mlp.patches.Polygon(path)], ec="white")
"""
3. add_collection的hatch设置
"""
patchWithPolygon.set(hatch="*")

fig, axs = plt.subplots(1, 2, figsize=(4, 2), layout="constrained")
axs.flat[0].add_artist(circle)
# axs.flat[0].set_axis_off()
axs.flat[0].set(title=type(circle).__name__,
           aspect=1, xlim=(-.2, .2), ylim=(-.2, .2))

axs.flat[1].add_collection(patchWithPolygon)
axs.flat[1].set(title=type(patchWithPolygon).__name__,
           aspect=1, xlim=(-.3, .3), ylim=(-.3, .3))

x = [float(i[0]) for i in path]
y = [float(i[1]) for i in path]
axs.flat[1].scatter(x,y,c='r')

plt.show()
参考:
- matplotlib.collections
- matplotlib.patches.Circle
2.3 底纹样式列表
常见的底纹详见:https://matplotlib.org/stable/gallery/shapes_and_collections/hatch_style_reference.html
