prometheus中label的生命周期
前言
Prometheus labels allow you to model your application deployment in the manner best suited to your organisation. As directly supporting every potential configurations would be impossible, we offer relabelling to give you the flexibility to configure things how you’d like.
How labels propagate can be a bit tricky to get your head around initially. The basic principle is that your service discovery provides you with metadata such as machine type, tags, region in _meta* labels, and which you then relabel into the labels you’d like for your targets to have with relabel_configs. You can also filter targets with the drop and keep actions.
Similarly when actually scraping the targets, metric_relabel_configs allow you to tweak the timeseries coming back from the scrape. Filtering can also be used as a temporary measure to deal with expensive metrics.
Life of a label
To help you understanding how this all fits together, I’ve put together flowcharts of the semantics in Prometheus. These cover from how targets are created, scraped and what manipulations are performed before timeseries are inserted into the database:
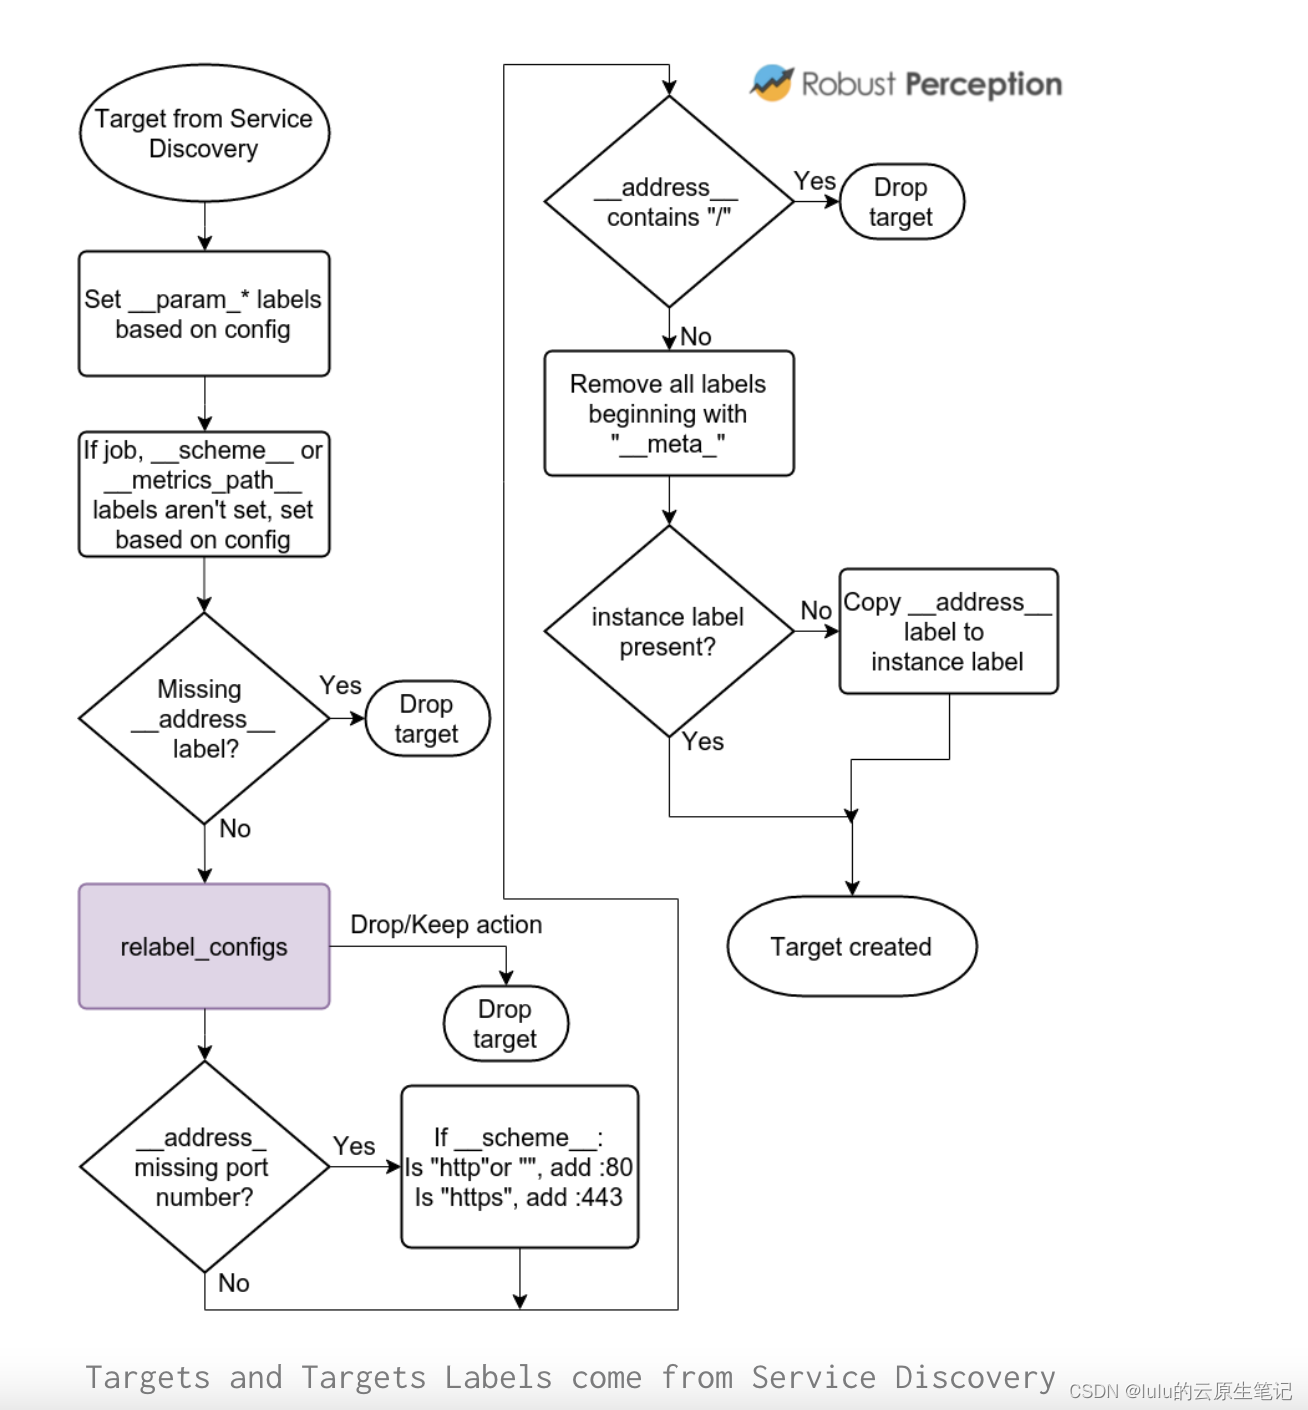
As this point Prometheus knows the targets that’ll be scraped, and these are what you see on the Status page. The core here is the relabelling in purple. Everything else is defaults and sanity checks to make your life easier.
When a target is actually scraped, this is what happens:
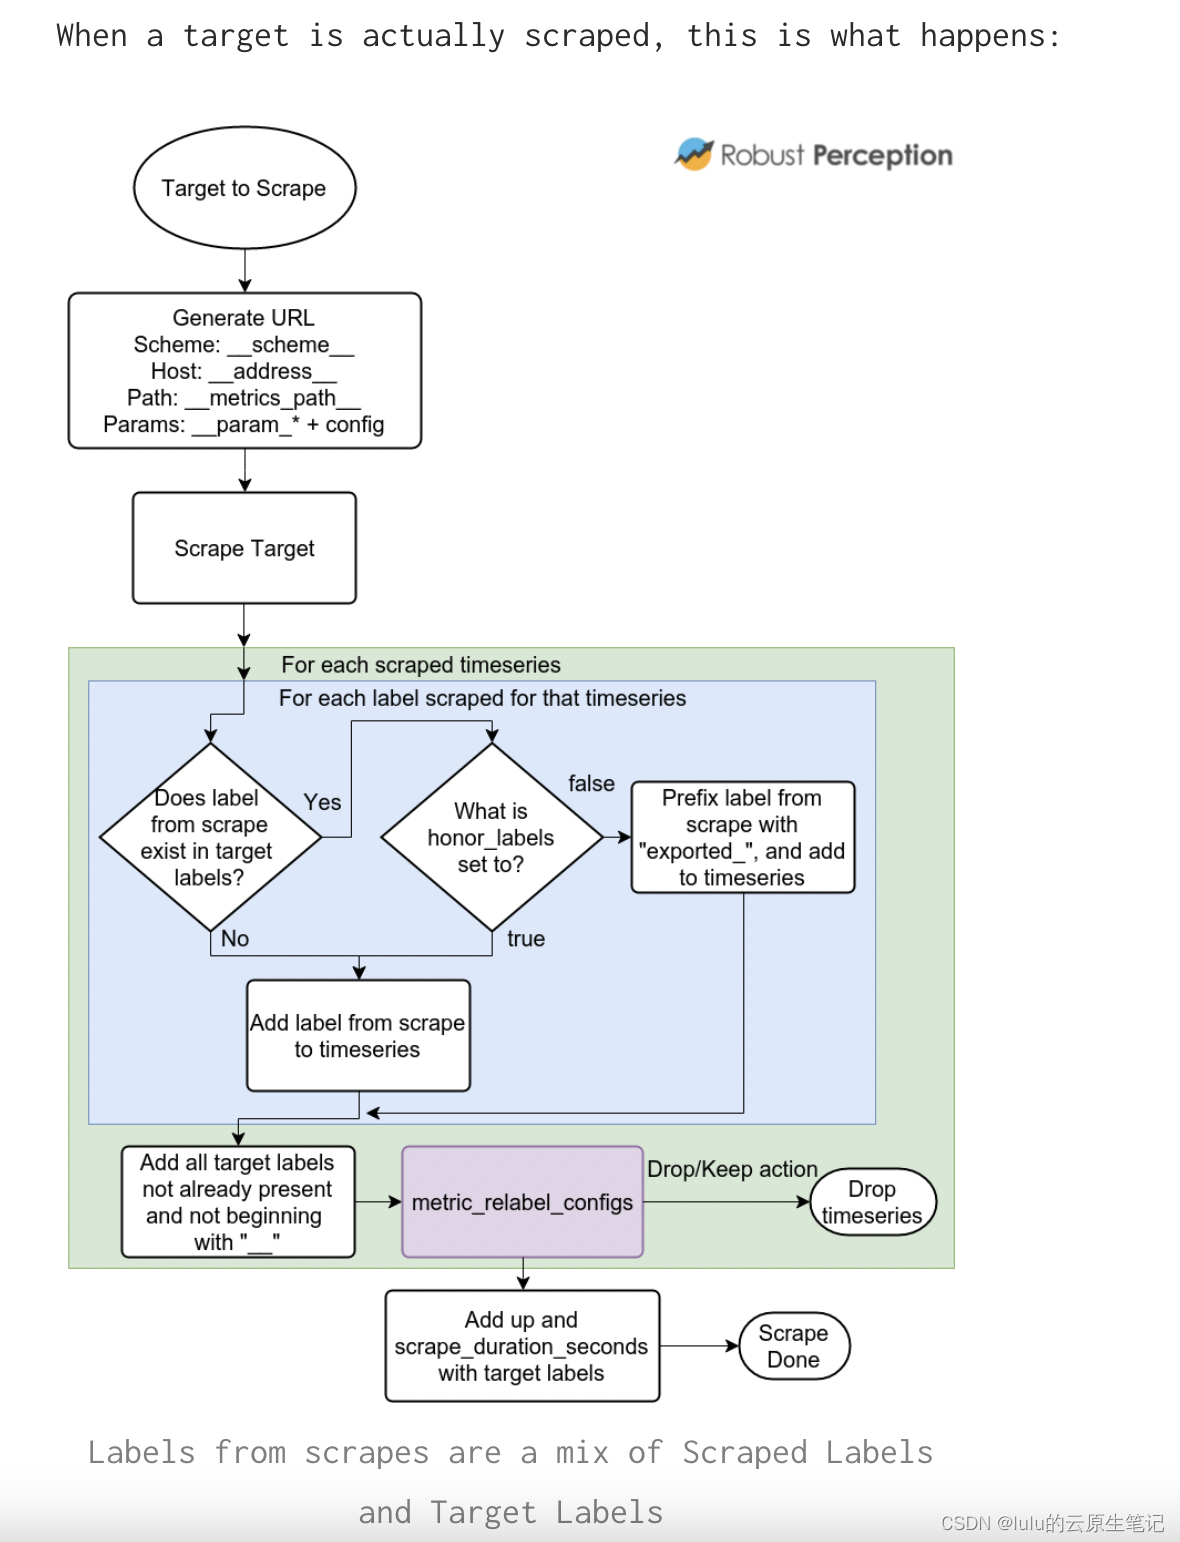
The _param* labels contain the first value of each URL parameter, allowing you to relabel the first value. At scrape time, these are combined back with the second and subsequent parameter values.
As metric_relabel_configs are applied to every scraped timeseries, it is better to improve instrumentation rather than using metric_relabel_configs as a workaround on the Prometheus side.
注意:
label的生命周期分为两大环节:
- scrap created(创建好后scrap target,可以进行relabl调整或者放弃scrap)
- actual scraped(抓取后到入库前,可以使用metrics relabel进行最后的调整)
