💥💥💞💞欢迎来到本博客❤️❤️💥💥
🏆博主优势:🌞🌞🌞博客内容尽量做到思维缜密,逻辑清晰,为了方便读者。
⛳️座右铭:行百里者,半于九十。
📋📋📋本文目录如下:🎁🎁🎁
目录
💥1 概述
📚2 运行结果
🎉3 参考文献
🌈4 Matlab代码实现
💥1 概述
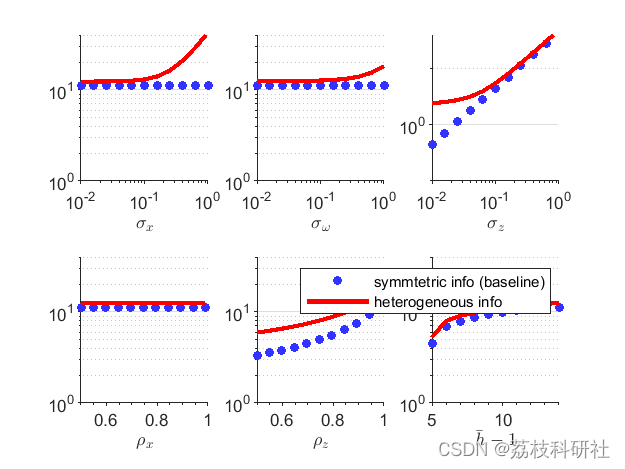
我们为DSGE模型提供预测,其中包含跨信息结构的鲁棒性信息不完整。我们的方法将不完全信息模型映射到具有时变期望楔子的全信息经济中,并提供条件来确保楔子可以通过某种信息结构合理化。使用我们的方法,我们量化了信息作为商业周期波动来源的潜在重要性,在其他无摩擦模型中。我们的方法揭示了企业特定需求冲击在支持总体信心波动方面的核心作用。只有当企业面临未观察到的当地需求冲击时,信心波动才能占美国商业周期的很大一部分。
We provide predictions for DSGE models with incomplete information that are robust across information structures. Our approach maps an incomplete-information model into a full-information economy with time-varying expectation wedges and provides conditions that ensure the wedges are rationalizable by some information structure. Using our approach, we quantify the potential importance of information as a source of business cycle fluctuations in an otherwise frictionless model. Our approach uncovers a central role for firm-specific demand shocks in supporting aggregate confidence fluctuations. Only if firms face unobserved local demand shocks can confidence fluctuations account for a significant portion of the US business cycle.
📚2 运行结果
warning off

% Results used in Section 4
cd([home_dir,'/Section4/final_figures/']);
make_fig1;    %Figure 1
make_fig2;    %Figure 2


% Result from Section 5 estimation + appendix
cd([home_dir,'/Section5_estimation'])
make_fig4 %Figure 4

% Results used in Section 5
cd([home_dir,'/Section5/final_figures/']);
make_tab1 %Table 1
make_tab2 %Table 2
make_fig3 %Figure 3

%Result from appendix
cd([home_dir,'/Section4/final_figures'])
make_fig5;

% Return back to start
cd(home_dir)

warning on
return
%% 这里仅展现第一张图片结果代码
%% Make the frontier figure
file = '../output_files/frontier';
load(file, 'cpy_grid', 'ary_grid');
[fmin,resid] = extract_min(file);
close all % close any figures saved by accident in filefigure(1); set(gcf, 'Position', [0,1000,400,300])
ncpy = length(cpy_grid);
nary = length(ary_grid);s=surf(repmat(cpy_grid',[1,nary]),repmat(ary_grid,[ncpy,1]),fmin);
zlim([.1,20]/1)
s.FaceColor = [.95 .95 .95];
s.EdgeColor = [.2 .2 .2];
s.LineWidth = 1;g = gca;
g.ZGrid = 'off';
g.YGrid = 'off';
g.XGrid = 'off';
g.ZScale = 'log';
g.View = [45 15];set(gca, ...
'Box' , 'off' , ...
'TickDir' , 'out' , ...
'TickLength' , [.02 .02] , ...
'XMinorTick' , 'on' , ...
'YMinorTick' , 'on' , ...
'ZGrid' , 'on' , ...
'XTick' , -1:.5:1 , ...
'YTick' , -1:.5:1 , ...
'ZTick' , [.1,1,10]/1 , ...
'LineWidth' , 1 );xs = xlabel('$\gamma_{\hat y \pi}$', 'interpreter', 'latex','fontsize',16);
ys = ylabel('$\rho_{\hat y}$', 'interpreter', 'latex','fontsize',16);
zlabel('$\sigma^\mathrm{max}_{\hat y}$', 'interpreter', 'latex','fontsize',16);%% Save figure 1 as a png file
saveas(gcf, '../../../results/fig1.png')disp(['Section III.C (~page 25) - global sig_ymax: ' num2str(max(max(fmin(10:end,:))))]);
disp(['Section III.C (~page 25) - baseline sig_ymax: ' num2str(fmin(13,end))]);
disp(' ')


🎉3 参考文献
部分理论来源于网络,如有侵权请联系删除。
[1]Ryan Chahrour, Robert Ulbricht (2022) Compute Capsule for: Robust Predictions for DSGE Models with Incomplete Information



![CodeForces..走路的男孩.[简单].[时间间隔]](https://img-blog.csdnimg.cn/bce3a017ce52454387bc53fa7f822a3f.png)


