前言
大家早好、午好、晚好吖 ❤ ~欢迎光临本文章

课程亮点
1、爬虫的基本流程
2、可视化分析展示
3、requests模块的使用
4、保存csv
开发环境:
-
python 3.8 运行代码
-
pycharm 2022.3.2 辅助敲代码 专业版
模块使用:
内置模块:
-
import pprint >>> 格式化输入模块
-
import csv >>> 保存csv文件
-
import re >>> re 正则表达式
-
import time >>> 时间模块
第三方模块:
- import requests >>> 数据请求模块
第三方模块安装:
win + R 输入cmd 输入安装命令 pip install 模块名
(如果你觉得安装速度比较慢, 你可以切换国内镜像源)
完整源码、教程 点击此处跳转文末名片获取 ,我都放在这里了。
数据来源分析思路:
-
确定爬取目标
-
去分析这些数据内容, 可以从哪里获取
数据是通过那个url地址 发送什么请求方式, 携带了那些请求头 然后得到数据
(通过开发者工具进行抓包分析)
*** 我们分析数据, 是分析服务器返回数据, 而不是元素面板
# elements是元素面板 前端代码渲染之后的内容
import requests  # 数据请求模块 第三方模块 pip install requests
import pprint  # 格式化输出模块
import csv  # csv保存数据
import time

f = open('招聘数据.csv', mode='a', encoding='utf-8', newline='')
csv_writer = csv.DictWriter(f, fieldnames=[
    '标题',
    '地区',
    '公司名字',
    '薪资',
    '学历',
    '经验',
    '公司标签',
    '详情页',
])

csv_writer.writeheader() # 写入表头
for page in range(1, 31):
    print(f'------------------------正在爬取第{page}页-------------------------')
    time.sleep(1)
    # 1. 发送请求
    url = 'https://****/jobs/positionAjax.json?needAddtionalResult=false'
    headers = {
        'cookie': '你自己的cookie',
        'referer': 'https://****/jobs/list_python?labelWords=&fromSearch=true&suginput=',
        'user-agent': 'Mozilla/5.0 (Windows NT 10.0; Win64; x64) AppleWebKit/537.36 (KHTML, like Gecko) Chrome/94.0.4606.81 Safari/537.36',
    }
    data = {
        'first': 'false',
        'pn': page,
        'kd': 'python',
        'sid': 'bf8ed05047294473875b2c8373df0357'
    }
    # response 自定义变量 可以自己定义  <Response [200]> 获取服务器给我们响应数据
    完整源码、解答+V:pytho8987获取,备注“777”
    response = requests.post(url=url, data=data, headers=headers)
    # print(response.text) # 获取响应体的文本数据 字符串数据类型
    # print(type(response.text))
    # print(response.json()) # 获取响应体的json字典数据 字典数据类型
    # print(type(response.json()))
    #  2. 获取数据
    # print(response.json())
    # pprint.pprint(response.json())
    #  3. 解析数据 json数据最好解析 非常好解析, 就根据字典键值对取值
    result = response.json()['content']['positionResult']['result']
    # 列表数据类型, 但是这个列表里面的元素, 是字典数据类型
    # pprint.pprint(result)
    # 循环遍历  从 result 列表里面 把元素一个一个提取出来
    for index in result:
        # pprint.pprint(index)
        # href = index['positionId']
        href = f'https://****/jobs/{index["positionId"]}.html'
        dit = {
            '标题': index['positionName'],
            '地区': index['city'],
            '公司名字': index['companyFullName'],
            '薪资': index['salary'],
            '学历': index['education'],
            '经验': index['workYear'],
            '公司标签': ','.join(index['companyLabelList']),
            '详情页': href,
        }
        # ''.join() 把列表转成字符串 '免费班车',
        csv_writer.writerow(dit)
        print(dit)
括展小知识
-
headers 请求头 用来伪装python代码, 防止被识别出是爬虫程序, 然后被反爬
-
cookie: 用户信息, 常用于检测是否有登陆账号
-
referer: 防盗链, 告诉服务器我们请求的url地址 是从哪里跳转过来的 (动态网页数据 数据包 要比较多)
-
user-agent: 浏览器的基本标识
-
pycharm里面 先全部选中 按住 ctrl +R 用正则表达式命令 批量替换数据
-
200 状态码标识请求成功
可视化分析

import numpy as np
import pandas as pd
from pyecharts.charts import *
from pyecharts import options as opts
import matplotlib.pyplot as plt
plt.rcParams['font.sans-serif'] = ['SimHei']
from pyecharts.globals import ThemeType
df = pd.read_csv('data.csv', encoding='UTF-8')
df.head()

df.info()#查看整体性描述
df.describe()


df[df['公司标签'].isnull()]#查看“福利”空值所属信息
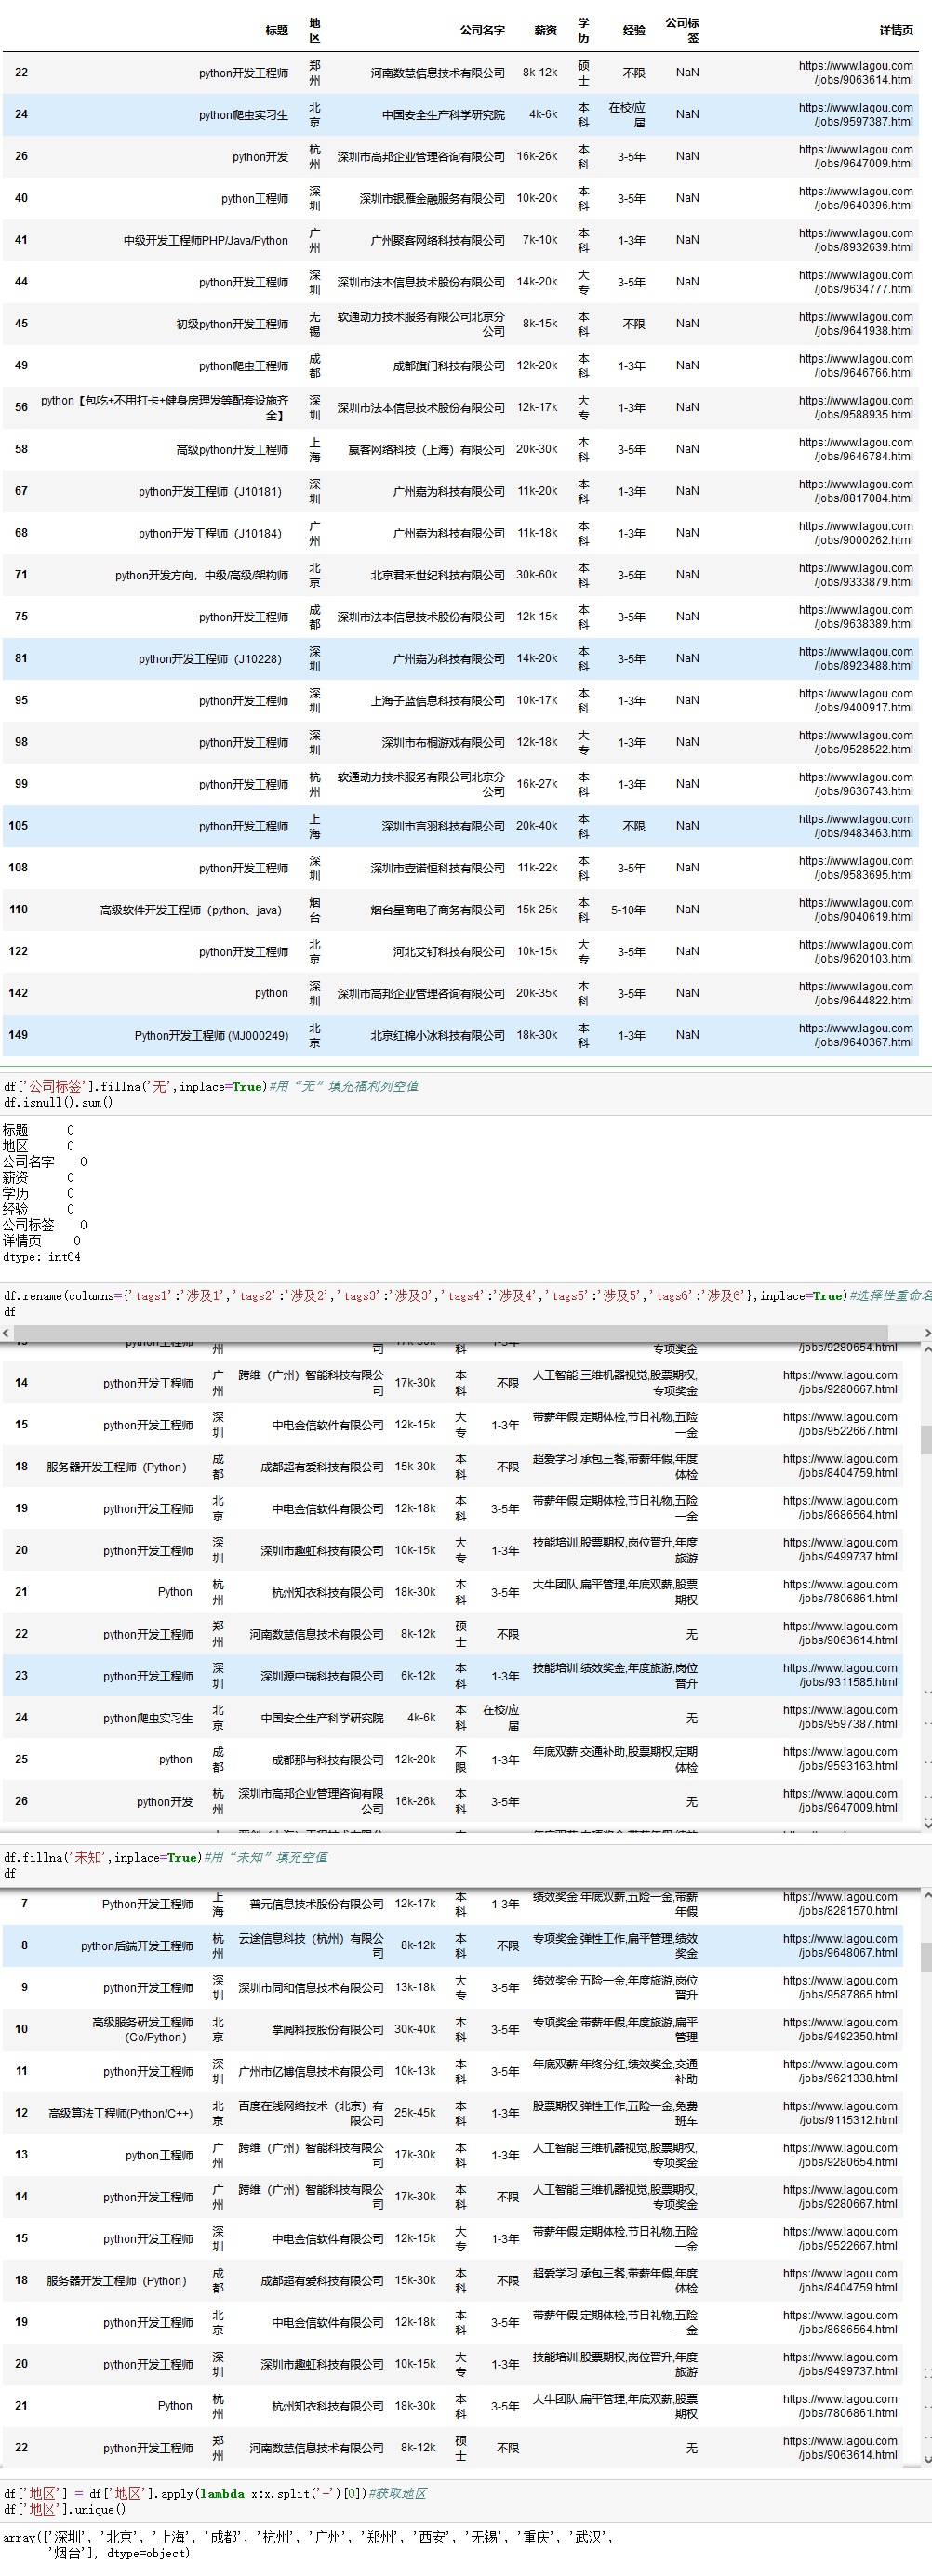
df['地区'] = df['地区'].apply(lambda x:x.split('-')[0])#获取地区
df['地区'].unique()
df['经验'].unique()
df['经验'].replace('在校/应届本科','经验不限本科', inplace=True)#重命名经验
df['经验'].replace('5天/周2个月本科','经验不限本科', inplace=True)
df['经验'].replace('经验不限学历不限','经验不限大专', inplace=True)
df['经验'].replace('5天/周6个月大专','经验不限大专', inplace=True)
df['经验'].replace('3天/周12个月本科','经验不限本科', inplace=True)
df['经验'].replace('3天/周3个月硕士','经验不限硕士', inplace=True)
df['经验'].replace('4天/周6个月硕士','经验不限硕士', inplace=True)
df['经验'].replace('3-5年学历不限','经验不限大专', inplace=True)
df['经验'].replace('5-10年大专','经验不限大专', inplace=True)
df['经验'].replace('3-5年大专','经验不限大专', inplace=True)
df['经验'].replace('5天/周6个月本科','经验不限本科', inplace=True)
df['经验'].replace('5天/周6个月本科','经验不限本科', inplace=True)
df['经验'].replace('                                                                                                                                                                                                                                                                    ','经验不限本科', inplace=True)
df['经验'].unique()
df['薪资'].unique()
df['m_max'] = df['薪资'].str.extract('(\d+)')#提取出最低薪资
df['m_min'] = df['薪资'].str.extract('(\d+)K')#提取出最高薪资
df['m_max'] = df['m_max'].apply('float64')#转换数据类型
df['m_min'] = df['m_min'].apply('float64')
df['平均薪资'] = (df['m_max']+df['m_min'])/2
df.head()

#每个地区的招聘数量
dq = df.groupby('地区').count()['标题']
dq_index = dq.index.tolist()
dq_value = dq.values.tolist()

bar1 = (Bar(init_opts=opts.InitOpts(width='800px', height='400px',theme=ThemeType.MACARONS))
       .add_xaxis(dq_index)
       .add_yaxis('', dq_value,category_gap="50%")
       .set_global_opts(title_opts=opts.TitleOpts(title="每个地区的招聘数量"),
                       xaxis_opts=opts.AxisOpts(axislabel_opts=opts.LabelOpts(rotate=-50)),
                        visualmap_opts=opts.VisualMapOpts(max_=80),#彩色块
                        datazoom_opts=[opts.DataZoomOpts()]#拉动条形轴
                        )
      )
bar1.render_notebook()

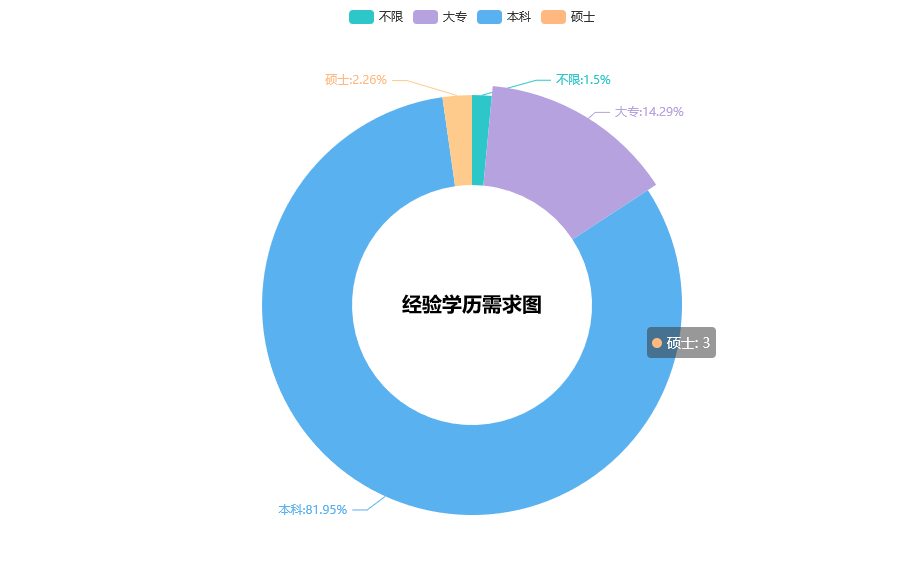
#经验学历需求图
pair_1 = [(i, int(j)) for i, j in zip(jingyan.index,jingyan.values)]
pie = (
    Pie(init_opts=opts.InitOpts(theme=ThemeType.MACARONS,width='1000px',height='600px'))

    .add('', pair_1, radius=['40%', '70%'])
    .set_series_opts(label_opts=opts.LabelOpts(formatter="{b}:{d}%"))
    .set_global_opts(
        title_opts=opts.TitleOpts(
            title="经验学历需求图",
            pos_left='center',
            pos_top='center',
            title_textstyle_opts=opts.TextStyleOpts(
                color='black',
                font_size=20,
                font_weight='bold'
            ),
        )
    )

)
pie.render_notebook()
gongsi = df.groupby('经验').count()['标题']
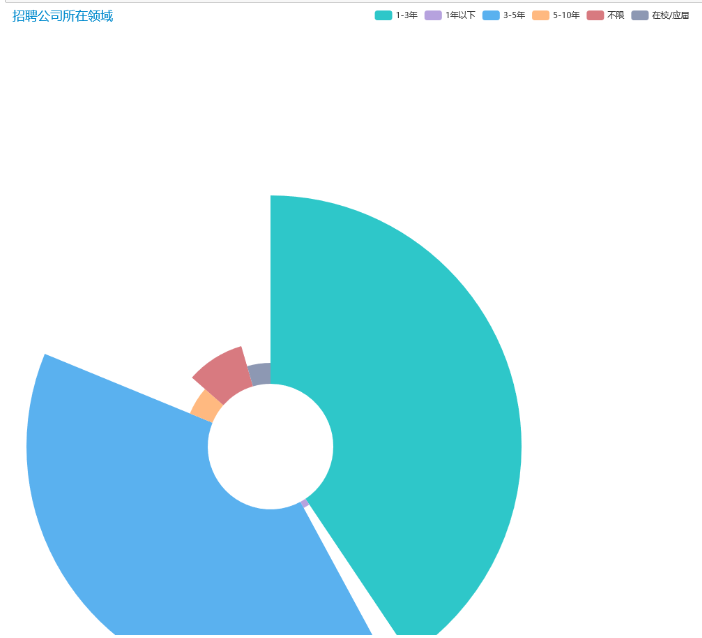
#招聘公司所在领域
pie1 = (
    Pie(init_opts=opts.InitOpts(theme=ThemeType.MACARONS,width='1500px',height='900px'))
    .add(
        "",
        [list(z) for z in zip(gongsi.index.tolist(), gongsi.values.tolist())],
        radius=["20%", "80%"],
        center=["25%", "70%"],
        rosetype="radius",
        label_opts=opts.LabelOpts(is_show=False),
    ).set_global_opts(title_opts=opts.TitleOpts(title="招聘公司所在领域"))
)
pie1.render_notebook()
尾语 💝
好了,今天的分享就差不多到这里了!
完整代码、更多资源、疑惑解答直接点击下方名片自取即可。
对下一篇大家想看什么,可在评论区留言哦!看到我会更新哒(ง •_•)ง
喜欢就关注一下博主,或点赞收藏评论一下我的文章叭!!!

