Additive Models
to avoid the curse of dimensionality and for better interpretability we assume
m
(
x
)
=
E
(
Y
∣
X
=
x
)
=
c
+
∑
j
=
1
d
g
j
(
x
j
)
m(\boldsymbol{x})=E(Y|\boldsymbol{X}=\boldsymbol{x})=c+\sum_{j=1}^dg_j(x_j)
m(x)=E(Y∣X=x)=c+j=1∑dgj(xj)
⟹
\Longrightarrow
⟹ the additive functions
g
j
g_j
gj can be estimated with the optimal one-dimensional rate
two possible methods for estimating an additive model:
- backfitting estimator
- marginal integration estimator
indentification conditions for both methods
E X j { g ( X j ) } = 0 , ∀ j = 1 , … , d ⟹ E ( Y ) = e \begin{aligned} E_{X_j}\{ g(X&_j) \}=0, \forall j=1,\dots,d\\ & \Longrightarrow E(Y)=e \end{aligned} EXj{g(Xj)}=0,∀j=1,…,d⟹E(Y)=e
formulation Hibert space framework:
- let H Y X \mathcal{H}_{Y\boldsymbol{X}} HYX be the Hilbert space of random variables which are functions of Y , X Y, \boldsymbol{X} Y,X
- let ⟨ U , V ⟩ = E ( U V ) \langle U,V\rangle=E(UV) ⟨U,V⟩=E(UV) the scalar product
- define H X \mathcal{H}_{\boldsymbol{X}} HX and H X , j = 1 , … , d \mathcal{H}_{X},j=1,\dots,d HX,j=1,…,d the corresponding subspaces
⟹
\Longrightarrow
⟹ we aim to find the element of
H
X
1
⊕
⋯
⊕
H
X
d
\mathcal{H}_{X_1}\oplus \cdots \oplus\mathcal{H}_{X_d}
HX1⊕⋯⊕HXd closest to
Y
∈
H
Y
X
Y\in\mathcal{H}_{Y\boldsymbol{X}}
Y∈HYX or
m
∈
H
X
m\in \mathcal{H}_{\boldsymbol{X}}
m∈HX
by the projection theorem, there exists a unique solution with
E
[
{
Y
−
m
(
X
)
}
∣
X
α
]
=
0
⟺
g
α
(
X
α
)
=
E
[
{
Y
−
∑
j
≠
α
g
j
(
X
j
)
}
∣
X
α
]
,
α
=
1
,
…
,
d
E[\{ Y-m(\boldsymbol{X}) \}|X_{\alpha}]=0\\ \iff g_{\alpha}(X_{\alpha})=E[\{ Y-\sum_{j\neq\alpha}g_j(X_j) \}|X_{\alpha}], \quad\alpha=1,\dots,d
E[{Y−m(X)}∣Xα]=0⟺gα(Xα)=E[{Y−j=α∑gj(Xj)}∣Xα],α=1,…,d
denote projection
P
α
(
∙
)
=
E
(
∙
∣
X
α
)
P_{\alpha}(\bullet)=E(\bullet|X_{\alpha})
Pα(∙)=E(∙∣Xα)
⟹
(
I
P
1
⋯
P
1
P
2
I
⋯
P
2
⋮
⋱
⋮
P
d
⋯
P
d
I
)
(
g
1
(
X
1
)
g
2
(
X
2
)
⋮
g
d
(
X
d
)
)
=
(
P
1
Y
P
2
Y
⋮
P
d
Y
)
\Longrightarrow\left(\begin{array}{cccc} I & P_{1} & \cdots & P_{1} \\ P_{2} & I & \cdots & P_{2} \\ \vdots & & \ddots & \vdots \\ P_{d} & \cdots & P_{d} & I \end{array}\right)\left(\begin{array}{c} g_{1}\left(X_{1}\right) \\ g_{2}\left(X_{2}\right) \\ \vdots \\ g_{d}\left(X_{d}\right) \end{array}\right)=\left(\begin{array}{c} P_{1} Y \\ P_{2} Y \\ \vdots \\ P_{d} Y \end{array}\right)
⟹
IP2⋮PdP1I⋯⋯⋯⋱PdP1P2⋮I
g1(X1)g2(X2)⋮gd(Xd)
=
P1YP2Y⋮PdY
denote by
S
α
the
(
n
×
n
)
smoother matrix
\bold{S}_{\alpha}\quad \text{the} \,(n\times n) \quad \text{smoother matrix}
Sαthe(n×n)smoother matrix
such that
S
α
Y
\bold{S}_{\alpha}\boldsymbol{Y}
SαY is an estimate of the vector
{
E
(
Y
1
∣
X
α
1
)
,
…
,
E
(
Y
n
∣
X
α
n
)
}
⊤
\{ E(Y_1|X_{\alpha1}),\dots,E(Y_n|X_{\alpha n}) \}^{\top}
{E(Y1∣Xα1),…,E(Yn∣Xαn)}⊤
⟹
(
I
S
1
⋯
S
1
S
2
I
⋯
S
2
⋮
⋱
⋮
S
d
⋯
S
d
I
)
⏟
n
d
×
n
d
(
g
1
g
2
⋮
g
d
)
=
(
S
1
Y
S
2
Y
⋮
S
d
Y
)
\Longrightarrow \underbrace{\left(\begin{array}{cccc} \mathbf{I} & \mathbf{S}_{1} & \cdots & \mathbf{S}_{1} \\ \mathbf{S}_{2} & \mathbf{I} & \cdots & \mathbf{S}_{2} \\ \vdots & & \ddots & \vdots \\ \mathbf{S}_{d} & \cdots & \mathbf{S}_{d} & \mathbf{I} \end{array}\right)}_{n d \times n d}\left(\begin{array}{c} \boldsymbol{g}_{1} \\ \boldsymbol{g}_{2} \\ \vdots \\ \boldsymbol{g}_{d} \end{array}\right)=\left(\begin{array}{c} \mathbf{S}_{1} \boldsymbol{Y} \\ \mathbf{S}_{2} \boldsymbol{Y} \\ \vdots \\ \mathbf{S}_{d} \boldsymbol{Y} \end{array}\right)
⟹nd×nd
IS2⋮SdS1I⋯⋯⋯⋱SdS1S2⋮I
g1g2⋮gd
=
S1YS2Y⋮SdY
note: infinite samples the matrix on the left side can be singular
Bacfitting algorithm
in practice, the following backfitting algorithm (a simplification of the Gauss-Seidel procedure) is used:
- initialize g ^ ( 0 ) ≡ 0 ∀ α , c ^ = Y ˉ \hat{\boldsymbol{g}}^{(0)}\equiv 0 \,\forall\alpha,\hat{c}=\bar{Y} g^(0)≡0∀α,c^=Yˉ
- repeat for
α
=
1
,
…
,
d
\alpha=1,\dots,d
α=1,…,d
r α = Y − c ^ − ∑ j = 1 α − 1 g ^ j ( ℓ + 1 ) − ∑ j = α + 1 d g ^ j ( ℓ ) g ^ α ( ℓ + 1 ) ( ∙ ) = S α ( r α ) \begin{aligned} \boldsymbol{r}_\alpha & =\boldsymbol{Y}-\widehat{c}-\sum_{j=1}^{\alpha-1} \widehat{\boldsymbol{g}}_j^{(\ell+1)}-\sum_{j=\alpha+1}^d \widehat{\boldsymbol{g}}_j^{(\ell)} \\ \widehat{\boldsymbol{g}}_\alpha^{(\ell+1)}(\bullet) & =\mathbf{S}_\alpha\left(\boldsymbol{r}_\alpha\right) \end{aligned} rαg α(ℓ+1)(∙)=Y−c −j=1∑α−1g j(ℓ+1)−j=α+1∑dg j(ℓ)=Sα(rα) - proceed until convergence is reached
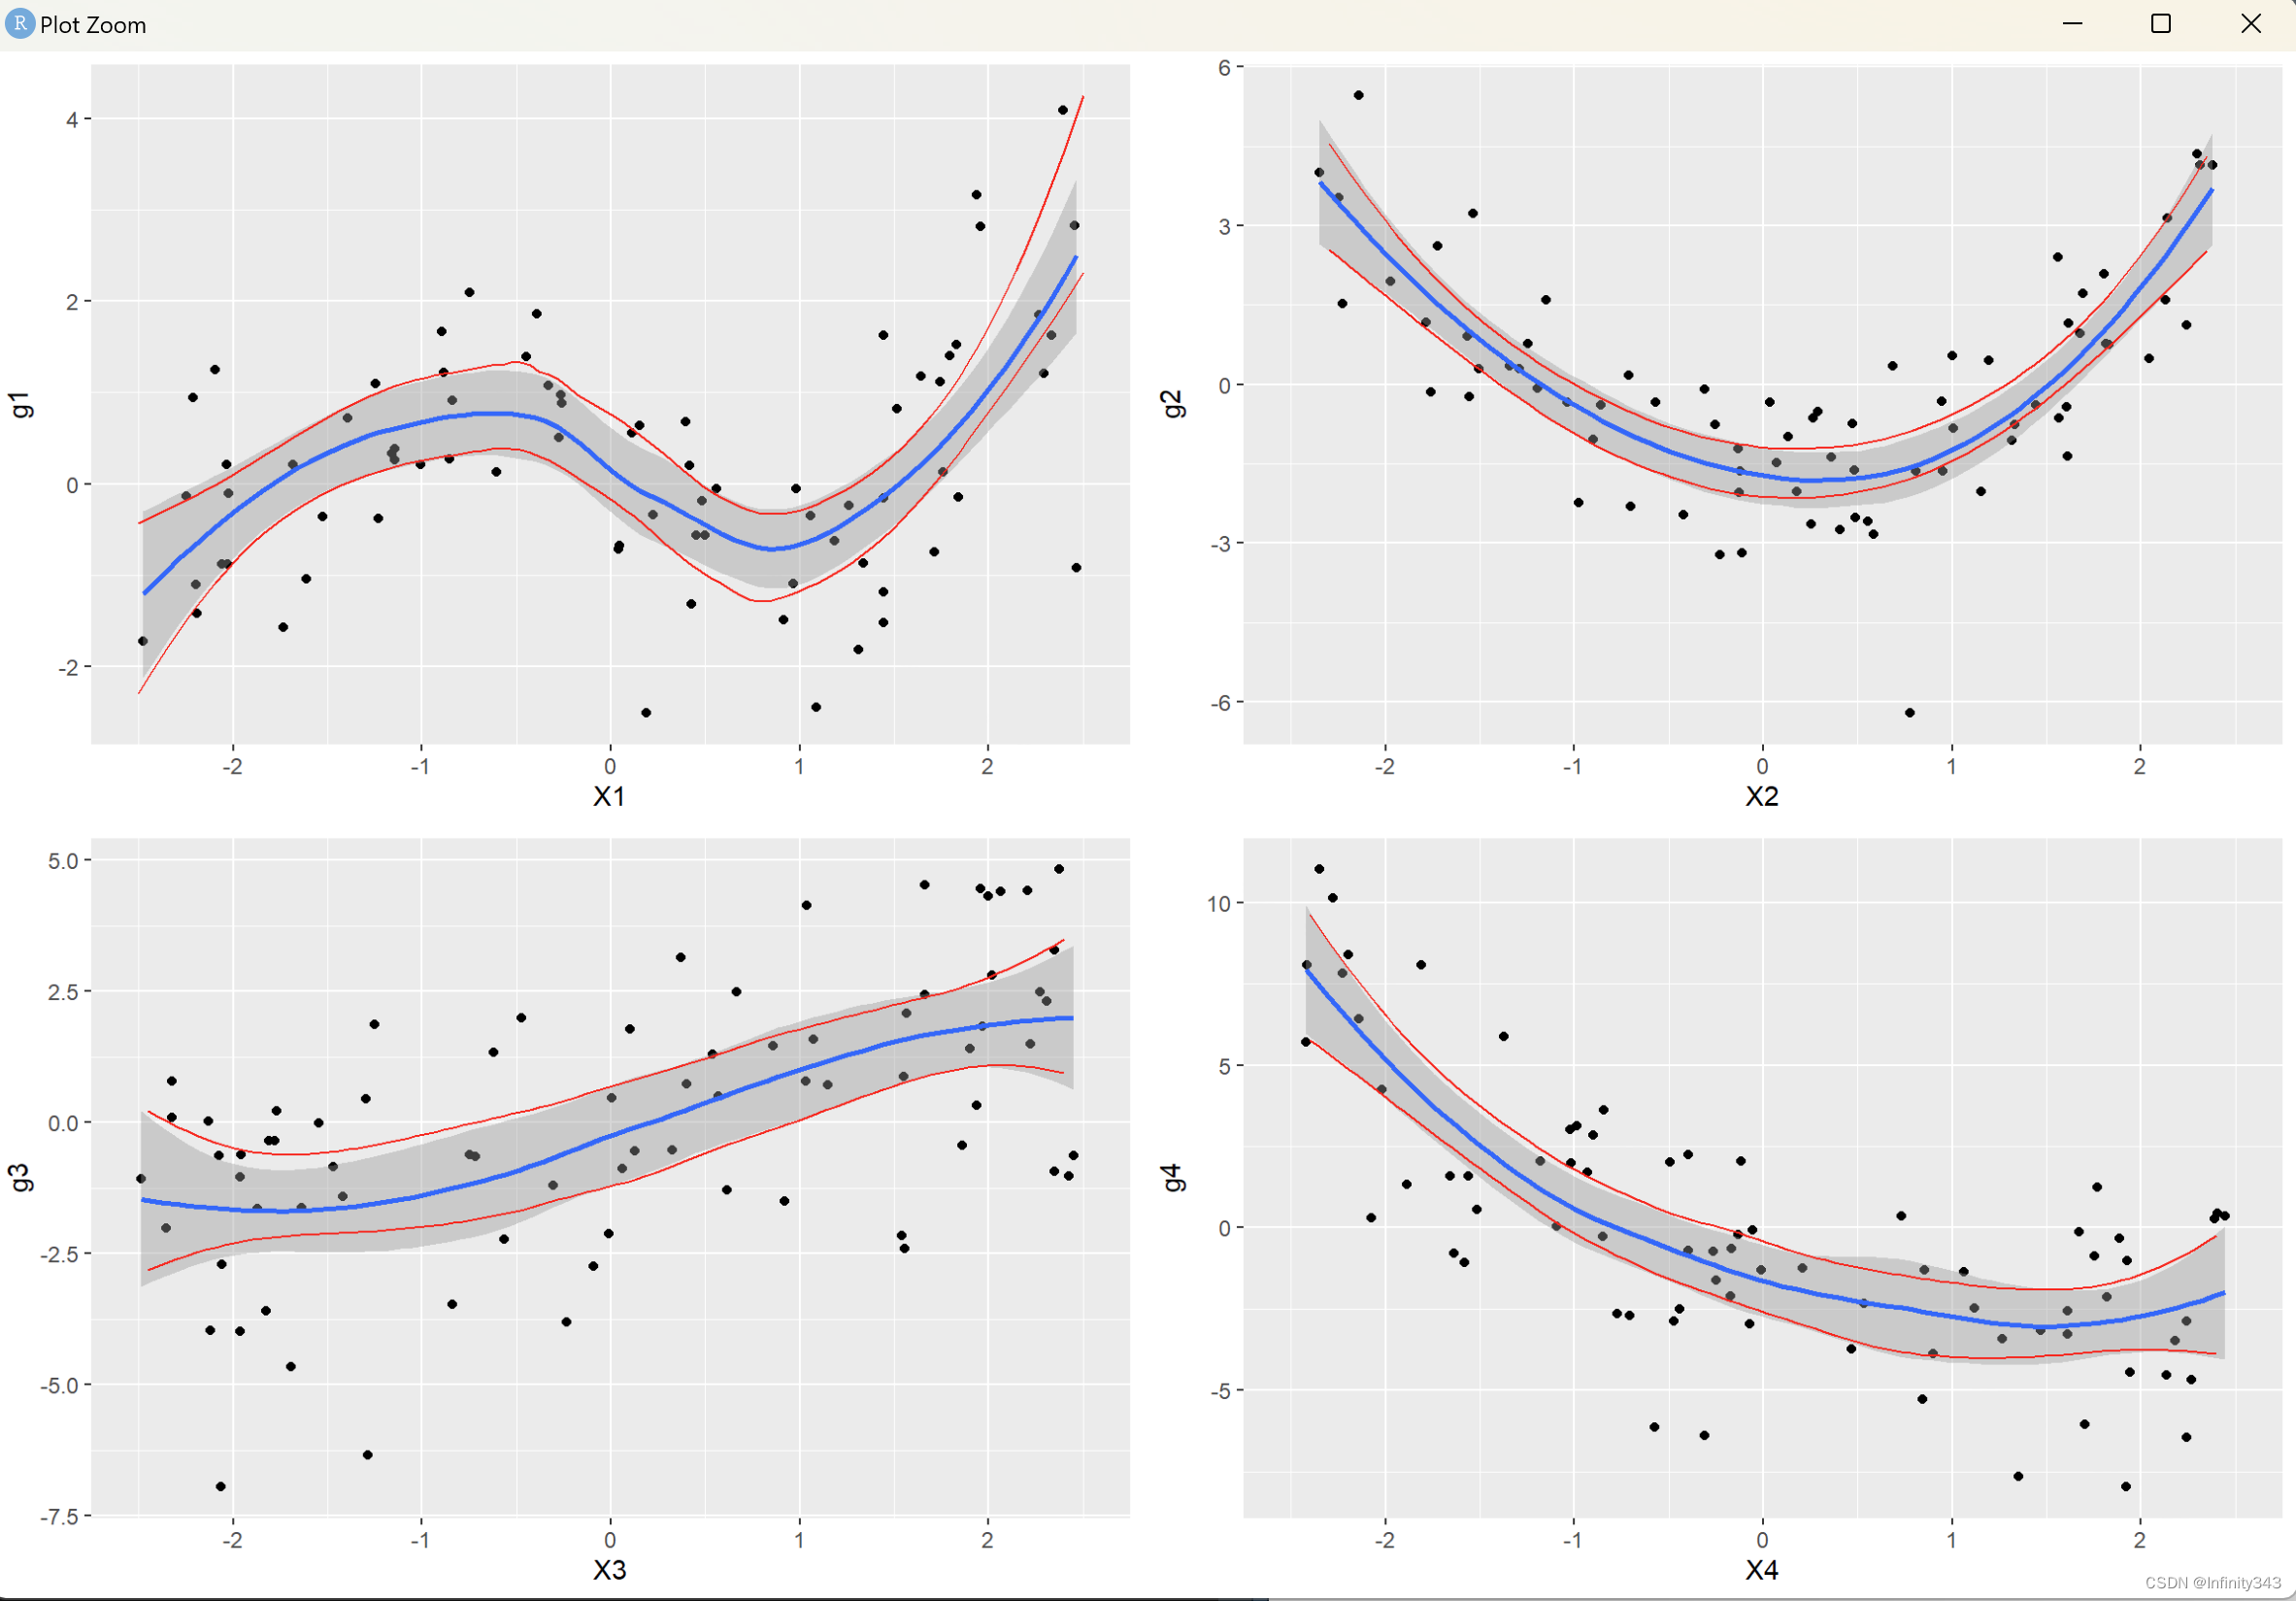
Example: smoother performance in additive models
simulated sample of
n
=
75
n = 75
n=75 regression observations with regressors
X
j
X_j
Xj i.i.d.
uniform on
[
−
2.5
,
2.5
]
[-2.5, 2.5]
[−2.5,2.5], generated from
Y
=
∑
j
=
1
4
g
j
(
X
j
)
+
ε
,
ε
∼
N
(
0
,
1
)
Y=\sum_{j=1}^4g_j(X_j)+\varepsilon, \quad \varepsilon\sim N(0,1)
Y=j=1∑4gj(Xj)+ε,ε∼N(0,1)
where
g
1
(
X
1
)
=
−
sin
(
2
X
1
)
g
2
(
X
2
)
=
X
2
2
−
E
(
X
2
2
)
g
3
(
X
3
)
=
X
3
g
4
(
X
4
)
=
exp
(
−
X
4
)
−
E
{
exp
(
−
X
4
)
}
\begin{array}{ll} g_1\left(X_1\right)=-\sin \left(2 X_1\right) & g_2\left(X_2\right)=X_2^2-E\left(X_2^2\right) \\ g_3\left(X_3\right)=X_3 & g_4\left(X_4\right)=\exp \left(-X_4\right)-E\left\{\exp \left(-X_4\right)\right\} \end{array}
g1(X1)=−sin(2X1)g3(X3)=X3g2(X2)=X22−E(X22)g4(X4)=exp(−X4)−E{exp(−X4)}
Plotting results in this example:

Code:
n = 75
X = matrix(NA, n, 4)
for (i in 1:4) {
  X[, i] = runif(n, min = -2.5, max = 2.5)
}

g1 = function(x) {
  return(-sin(2 * x))
}

g2 = function(x) {
  return(x ^ 2 - mean(x ^ 2))
}

g3 = function(x) {
  return(x)
}

g4 = function(x) {
  return(exp(-x) - mean(exp(-x)))
}
eps = rnorm(n)

###indicator function
I = function(x, index) {
  if (index == 1) {
    return(x)
  }
  if (index == 0) {
    return(0)
  }
}

x <- seq(-2.5, 2.5, l = 100)
Y = I(g1(X[, 1]), 1) + I(g2(X[, 2]), 0) + I(g3(X[, 3]), 0) + I(g4(X[, 4]), 0) + eps
fit_g1 <- loess(
  Y ~ x,
  family = 'symmetric',
  degree = 2,
  span = 0.7,
  data = data.frame(x = X[, 1], Y = Y),
  surface = "direct"
)
out_g1 <- predict(fit_g1,
                  newdata = data.frame(newx = x),
                  se = TRUE)
low_g1 <- out_g1$fit - qnorm(0.975) * out_g1$se.fit
high_g1 <- out_g1$fit + qnorm(0.975) * out_g1$se.fit
df.low_g1 <- data.frame(x = x, y = low_g1)
df.high_g1 <- data.frame(x = x, y = high_g1)
P1 = ggplot(data = data.frame(X1 = X[, 1], g1 = Y),
            aes(X1, g1)) +
  geom_point() +
  geom_smooth(method = "loess", show.legend = TRUE) +
  geom_line(data = df.low_g1, aes(x, y), color = "red") +
  geom_line(data = df.high_g1, aes(x, y), color = "red")

Y = I(g1(X[, 1]), 0) + I(g2(X[, 2]), 1) + I(g3(X[, 3]), 0) + I(g4(X[, 4]), 0) + eps
fit_g2 <- loess(
  Y ~ x,
  family = 'symmetric',
  degree = 2,
  span = 0.9,
  data = data.frame(
    x = X[, 2],
    Y = (Y - fit_g1$fitted),
    surface = "direct"
  )
)
out_g2 <- predict(fit_g2,
                  newdata = data.frame(newx = x),
                  se = TRUE)
low_g2 <- out_g2$fit - qnorm(0.975) * out_g2$se.fit
high_g2 <- out_g2$fit + qnorm(0.975) * out_g2$se.fit
df.low_g2 <- data.frame(x = x, y = low_g2)
df.high_g2 <- data.frame(x = x, y = high_g2)
P2 = ggplot(data = data.frame(X2 = X[, 2], g2 = (Y - fit_g1$fitted)),
            aes(X2, g2)) +
  geom_point() +
  geom_smooth(method = "loess", show.legend = TRUE) +
  geom_line(data = df.low_g2, aes(x, y), color = "red") +
  geom_line(data = df.high_g2, aes(x, y), color = "red")

Y = I(g1(X[, 1]), 0) + I(g2(X[, 2]), 0) + I(g3(X[, 3]), 1) + I(g4(X[, 4]), 0) + eps
fit_g3 <- loess(
  Y ~ x,
  family = 'symmetric',
  degree = 2,
  span = 0.9,
  data = data.frame(
    x = X[, 3],
    Y = (Y - fit_g1$fitted - fit_g2$fitted),
    surface = "direct"
  )
)
out_g3 <- predict(fit_g3,
                  newdata = data.frame(newx = x),
                  se = TRUE)
low_g3 <- out_g3$fit - qnorm(0.975) * out_g3$se.fit
high_g3 <- out_g3$fit + qnorm(0.975) * out_g3$se.fit
df.low_g3 <- data.frame(x = x, y = low_g3)
df.high_g3 <- data.frame(x = x, y = high_g3)
P3 = ggplot(data = data.frame(X3 = X[, 3], g3 = (Y - fit_g1$fitted - fit_g2$fitted)),
            aes(X3, g3)) +
  geom_point() +
  geom_smooth(method = "loess", show.legend = TRUE) +
  geom_line(data = df.low_g3, aes(x, y), color = "red") +
  geom_line(data = df.high_g3, aes(x, y), color = "red")

Y = I(g1(X[, 1]), 0) + I(g2(X[, 2]), 0) + I(g3(X[, 3]), 0) + I(g4(X[, 4]), 1) + eps
fit_g4 <- loess(
  Y ~ x,
  family = 'symmetric',
  degree = 2,
  span = 0.9,
  data = data.frame(
    x = X[, 4],
    Y = (Y - fit_g1$fitted - fit_g2$fitted - fit_g3$fitted),
    surface = "direct"
  )
)
out_g4 <- predict(fit_g4,
                  newdata = data.frame(newx = x),
                  se = TRUE)
low_g4 <- out_g4$fit - qnorm(0.975) * out_g4$se.fit
high_g4 <- out_g4$fit + qnorm(0.975) * out_g4$se.fit
df.low_g4 <- data.frame(x = x, y = low_g4)
df.high_g4 <- data.frame(x = x, y = high_g4)
P4 = ggplot(data = data.frame(
  X4 = X[, 4],
  g4 = (Y - fit_g1$fitted - fit_g2$fitted - fit_g3$fitted)
),
aes(X4, g4)) +
  geom_point() +
  geom_smooth(method = "loess", show.legend = TRUE) +
  geom_line(data = df.low_g4, aes(x, y), color = "red") +
  geom_line(data = df.high_g4, aes(x, y), color = "red")

cowplot::plot_grid(P1, P2, P3, P4, align = "vh")
result:
参考文献
https://academic.uprm.edu/wrolke/esma6836/smooth.html
Hastie, T. J. and Tibshirani, R. J. (1990). Generalized Additive Models, Vol. 43 of Monographs on Statistics and Applied Probability, Chapman and Hall, London.
Opsomer, J. and Ruppert, D. (1997). Fitting a bivariate additive model by local polynomial regression, Annals of Statistics 25: 186-211.
Mammen, E., Linton, O. and Nielsen, J. P. (1999). The existence and asymptotic properties of a backfitting projection algorithm under weak conditions, Annals of Statistics 27: 1443-1490.






![[SpringBoot]创建聚合项目](https://img-blog.csdnimg.cn/0d387290d69340128ef1df004aeb2f76.png)

