文章目录
- 1.IDE里的
- 1.1 显示模式(plt.ion()和plt.ioff())
- 1.2 backend说明
- 2 jupyter里的
- 3 通用的
- 3.1 cmap
- 3.2 subplot()相关
- 3.3 绘制动态图(Animation类)
- 3.4 matplotlib利用rcParams配置样式参数
- 4. 与opencv连用
- 可能遭遇的问题
- 1. IDE不显示图像窗口
1.IDE里的
1.1 显示模式(plt.ion()和plt.ioff())
参考:matplotlib.org-Interactive figures
很有用的一点:
无论使用的是什么交互模式,都可以使用pyplot.show(block=True)来让图变成responsive的
来自chatGPT的回答:
“Responsive” 通常翻译为 “响应式的” 或者 “自适应的”。在计算机编程中, “响应式” 或 “自适应” 通常指程序可以根据不同设备屏幕大小或用户界面的变化自动进行调整,并且能够通过对用户输入和交互方式做出合理的回应。例如,网页设计中经常用到响应式布局,以使得页面在不同尺寸的屏幕上都能够展示得很好。
可以借用plt.ion()和plt.ioff()来绘制一些动态效果,这两句英语很好的说明了这个显示模式:
If you wish to disable automatic redrawing of the plot:
plt.ioff()

If you wish to re-enable automatic redrawing of the plot:
plt.ion()
- 一般很难看到动态效果是因为处理速度太快,在不同的(
plt.figure()之间加一些plt.pause(0.5)这样的中断语句,就可以比较显著的看到变化了 - 另外,这个东西使用比较少,目前可以想到的场景,先显示一条线,处理之后又显示一条线,分时显示在同一个图上。
参考:
- matplotlib.pyplot.ion
- Python中使用plt.ion()和plt.ioff()画动态图
- 绘制五角星
1.2 backend说明
如果涉及到多种操作系统,比如macOS和Windows,可能要关注一下这个参数。
# 查看自己当前matplotlib的默认backend
import matplotlib as mpl
rc = mpl.rcParams
print(rc['backend'])
> MacOSX

# 如果想临时更换(代码只能改运行时),可以
import matplotlib
matplotlib.use("MacOSX")
关于mpl.rcParams,详见3.4 matplotlib利用rcParams配置样式参数
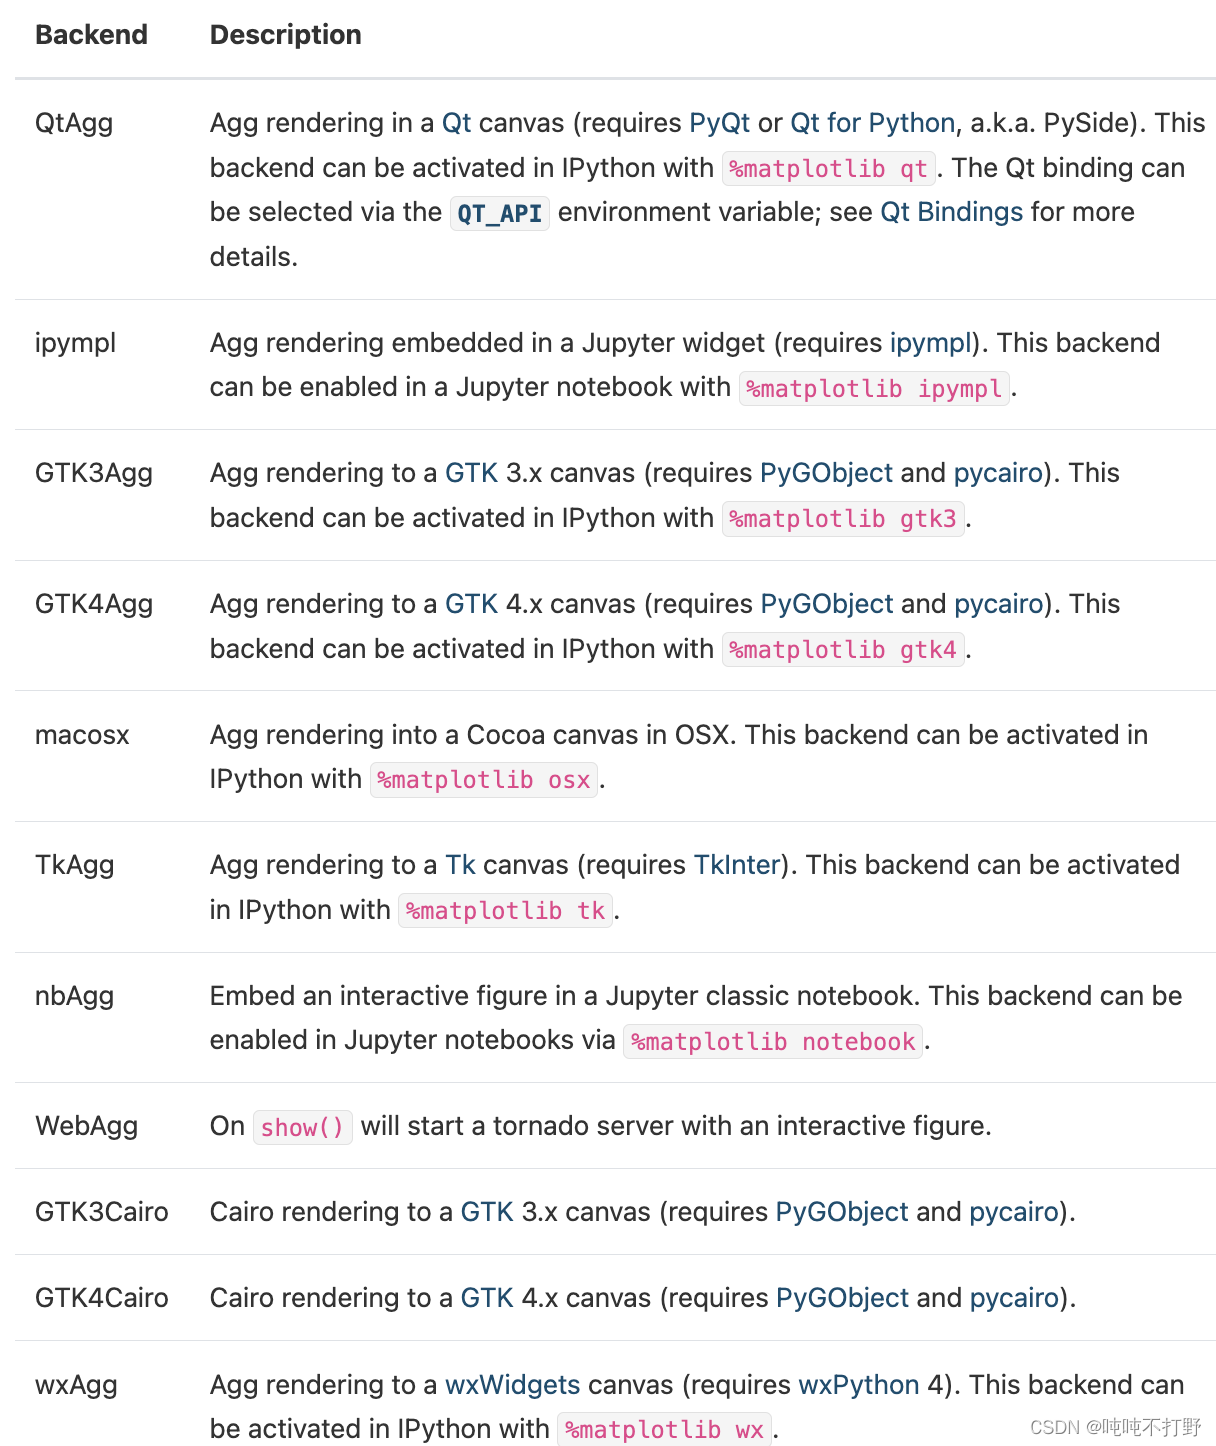
matplotlib已经支持的内建的backend有以下,详见The builtin backends
2 jupyter里的
3 通用的
3.1 cmap
其实基本用不到自定义cmap的功能,最多就是plt.show(XXX,'gray'),可能会想换个色谱。。目前没有找到很好的可以用程序就找到相应色谱的办法,还是看下面的参考链接吧:Choosing Colormaps in Matplotlib
3.2 subplot()相关
例如:
# Initialize the grid
grid = plt.GridSpec(2, 3, wspace=0.4, hspace=0.3)
# make subplots
plt.subplot(grid[0, 0])
plt.subplot(grid[0, 1:])
plt.subplot(grid[1, :2])
plt.subplot(grid[1, 2]);

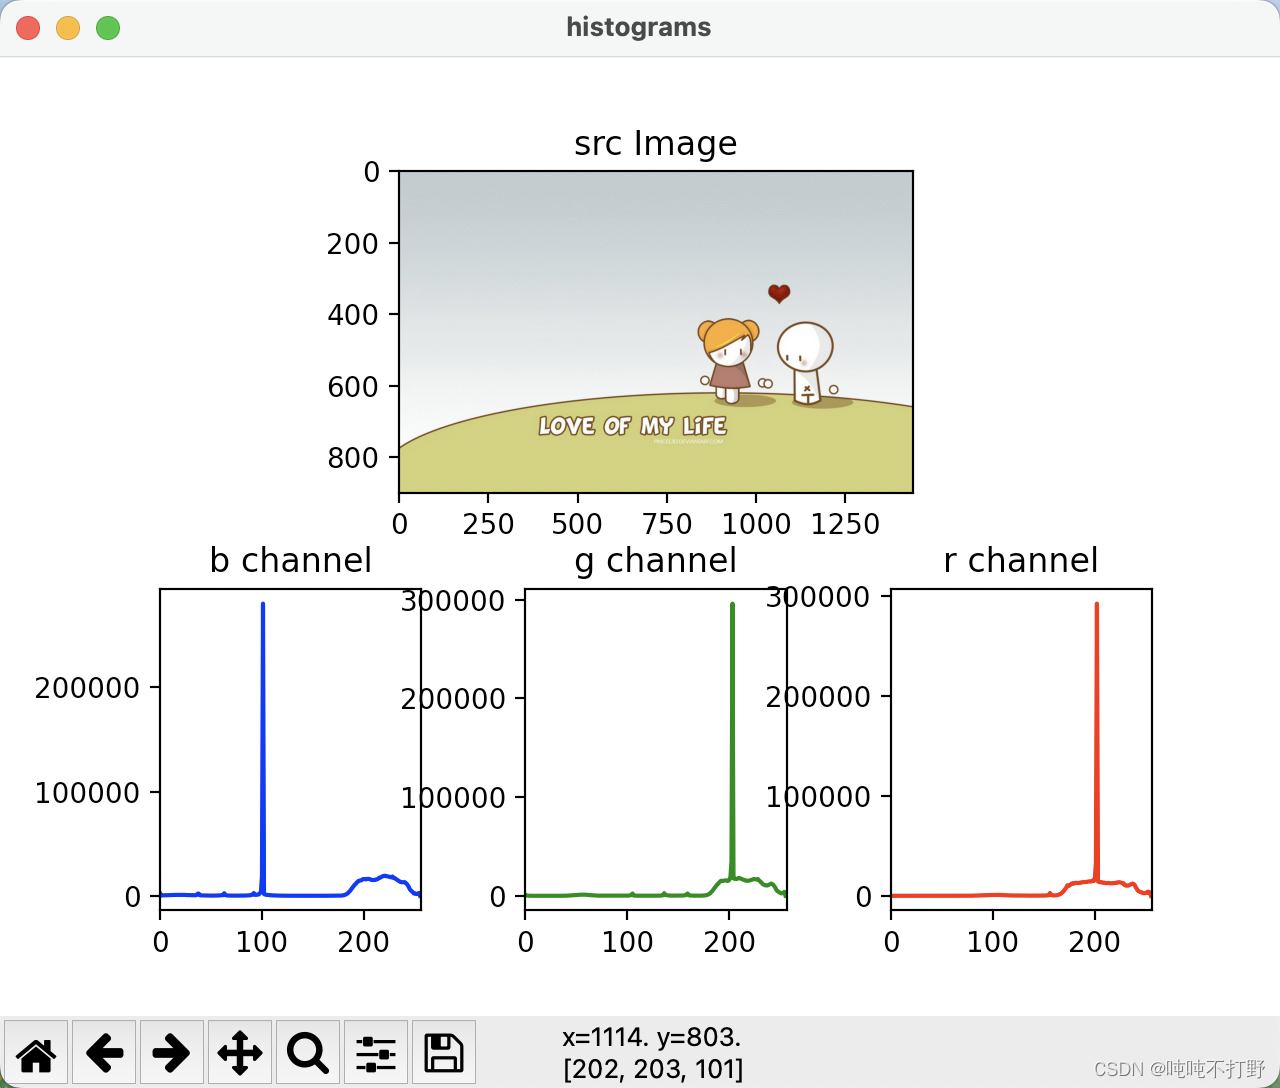
我实际使用的例子:
olors=("b","g","r") #opencv的默认三通道顺序

plt.figure("histograms")

grid = plt.GridSpec(2, 3, wspace=0.4, hspace=0.3)
plt.subplot(grid[0, 0:])
plt.title("src Image")
plt.imshow(srcImg[:, :, [2, 1, 0]])

for i,color in enumerate(colors):
    hist = cv2.calcHist([srcImg],[i],None,[256],[0,255])
    plt.subplot(grid[1, i])
    plt.title(color+" channel")
    plt.plot(hist,color)
    plt.xlim([0,256])
plt.show(block=True)
参考:
- https://www.machinelearningplus.com/plots/subplots-python-matplotlib/
- 使用 GridSpec 自定义子图位置
- Using Gridspec to make multi-column/row subplot layouts
3.3 绘制动态图(Animation类)
参考:
- 3.6. softmax回归的从零开始实现中
class Animator: - stackoverflow:How to animate a scatter plot
- matplotlib-Animated scatter saved as GIF
3.4 matplotlib利用rcParams配置样式参数
参考:Customizing Matplotlib with style sheets and rcParams
在程序中利用rcParams进行样式修改,只能是运行时生效。如果想永久生效的话,需要去修改matplotlibrc文件
import numpy as np
import matplotlib.pyplot as plt
import matplotlib as mpl
from cycler import cycler
mpl.rcParams['lines.linewidth'] = 2
mpl.rcParams['lines.linestyle'] = '--'
data = np.random.randn(50)
plt.plot(data)
关于mpl.rcParams支持的参数,可以
- 查看文档:class matplotlib.RcParams(*args, **kwargs)
- 程序里可以
import matplotlib
doc(matplotlib.RcParams)
- 程序里直接打印配置项和对应当前的默认值:
import matplotlib as mpl
rc = mpl.rcParams
for key,value in rc.items():
    print(key,value)
# 会有很多项
> .....
axes.prop_cycle cycler('color', ['#1f77b4', '#ff7f0e', '#2ca02c', '#d62728', '#9467bd', '#8c564b', '#e377c2', '#7f7f7f', '#bcbd22', '#17becf'])
axes.spines.bottom True
axes.spines.left True
axes.spines.right True
axes.spines.top True
....
- 直接去看
matplotlibrc文件,或者可以看看网页上默认的matplotlibrc,如果想查看本地的,可以使用以下代码获取改文件在系统里的位置
import matplotlib
matplotlib.matplotlib_fname()
> /Users/yourname/Documents/software/miniconda3/miniconda3/envs/py37/lib/python3.7/site-packages/matplotlib/mpl-data/matplotlibrc
4. 与opencv连用
可能遭遇的问题
1. IDE不显示图像窗口
现象描述
代码类似下面这样:
zipImg = cv2.imread(zipImgPath)
plt.ion()
plt.figure()
plt.imshow(zipImg[:, :, [2, 1, 0]])
但是运行后没有出现图像窗口。
可能的原因及解决方案,参考:Matplotlib plots not showing up in Mac OSX?
- backend问题,后端可以理解为渲染图像的引擎,对于macos电脑来说,可能是因为backend设置不对造成的,这部分介绍,详见上面1.1.2 backend说明
- 窗口其实显示了,只是一闪而过了,可以在
plt.imshow()代码的后面添加plt.pause(20)或者time.sleep(20)来暂停程序执行一段时间,这样就可以看见窗口了。


