1. Plotly安装
Plotly 是一个快速完善并崛起的交互式的、开源的绘图库库,Python 库则是它的一个重要分支。现已支持超过40种独特的图表类型,涵盖了广泛的统计、金融、地理、科学和三维用例。
Python 中可以使用 pip 或者 conda 安装 Plotly:
pip install plotly
conda install plotly
2. Plotly绘图教程
2.1 折线图与散点图
折线图不仅可以表示数量的多少,而且可以反映同一事物在不同时间里的发展变化的情况,易于显示数据变化趋势,可以直观地反映这种变化以及各组之间的差别。
import numpy as np
import plotly.graph_objects as go

x = np.arange(5)
y1 = np.random.rand(5) * 5
y2 = np.random.rand(5) * 5
y3 = np.random.rand(5) * 5

fig = go.Figure(
    data=[
        # name为图例名,textfont设置字体属性,mode为绘图模式,marker设置颜色否则后续导出图像会丢失颜色(不导出可不设置该参数也有默认颜色)
        go.Scatter(name='Lines', x=x, y=y1, textfont=dict(size=25), mode='lines', marker=dict(color='#0068C9')),
        go.Scatter(name='Markers', x=x, y=y2, textfont=dict(size=25), mode='markers'),
        go.Scatter(name='Lines&Markers', x=x, y=y3, textfont=dict(size=25), mode='lines+markers'),
    ]
)

# 设置图像格式
fig.update_layout(
    autosize=False, width=1200, height=650,  # 取消自动大小,手动设置宽高
    title='This is title',  # 标题
    xaxis=dict(title='X', nticks=5),  # 设置X轴属性
    yaxis=dict(title='Y', nticks=11, range=(0, 5)),  # 设置Y轴属性,nticks表示划分为多少段
    showlegend=True  # 显示图例
)

fig.show()

2.2 饼图
饼图用于强调各项数据占总体的占比,强调个体和整体的比较。
fig = go.Figure(
    # textinfo表示显示内容是百分比还是标签,hoverinfo表示鼠标悬停的显示内容,pull表示每一块往外拉的比例
    go.Pie(labels=['Train data', 'Valid data'], values=[7, 3],
           textinfo='percent', hoverinfo='label+percent',
           textfont=dict(size=15), pull=[0, 0.05],
           title='训练集划分', titlefont=dict(size=18),
           marker=dict(colors=['#0068C9', '#83C9FF']))
)

fig.update_layout(
    autosize=False, width=600, height=450
)

fig.show()

2.3 直方图
直方图虽然也和条形图一样通过矩形的长度表示数值,但他的宽度一般用于表示各组的组距,因此其高度与宽度均有意义,适合展示大量数据集的统计结果,直方图的表示的数据通常是连续排列,而柱状图则是分开排列。
x = np.random.rand(1000) * 30  # 生成1000个0-30之间的数

fig = go.Figure(
    data=[
        go.Histogram(name='X', x=x)
    ]
)

fig.update_layout(
    autosize=False, width=1350, height=600,
    xaxis=dict(title='Value'),
    yaxis=dict(title='Count'),
    showlegend=True,
)

fig.update_traces(opacity=0.6)  # 设置透明度

fig.show()

多个直方图覆盖:
x1 = np.random.rand(1000) * 30
x2 = np.random.rand(500) * 30

fig = go.Figure(
    data=[
        go.Histogram(name='X1', x=x1),
        go.Histogram(name='X2', x=x2)
    ]
)

fig.update_layout(
    barmode='overlay',  # 设置覆盖模式
    autosize=False, width=1350, height=600,
    xaxis=dict(title='Value'),
    yaxis=dict(title='Count'),
    showlegend=True,
)

fig.update_traces(opacity=0.6)  # 设置透明度

fig.show()

2.4 条形图
条形图用于比较各组数据的差异性,强调进行个体间的比较。
x = np.arange(10)
y = np.random.randint(30, size=10) + 1  # 生成10个1~30的整数

fig = go.Figure(
    data=[
        go.Bar(name='Bar1', x=x, y=y, textfont=dict(size=25))
    ]
)

fig.update_layout(
    autosize=False, width=800, height=500,
    title='Bar',
    xaxis=dict(title='X'),
    yaxis=dict(title='Y'),
    showlegend=True
)

fig.show()

2.5 热力图
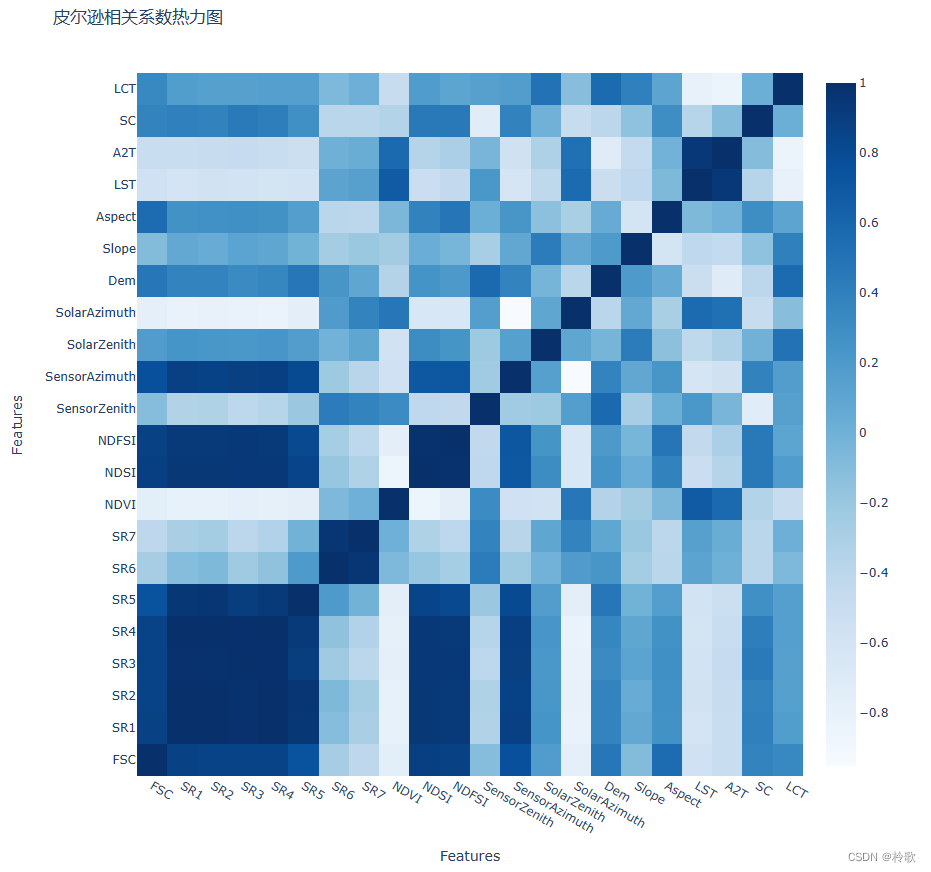
热力图是一种特殊的图表,它是一种通过对色块着色来显示数据的统计图表,在绘图时,需要指定每个颜色映射的规则(一般以颜色的强度或色调为标准);比如颜色越深的表示数值越大、程度越深或者颜色越浅的数值越大、程度越深。热力图适合用于查看总体的情况、观察特殊值或者显示多个变量之间的差异性、检测它们之间是否存在相关性等等。
df = pd.read_csv('../data/MODIS/test_data.csv', nrows=10)  # [10 rows x 22 columns]
print(df.head(1))
#    FSC       SR1       SR2       SR3  ...       LST       A2T   SC  LCT
# 0  1.0  0.587019  0.551739  0.565093  ...  0.129661  0.205581  1.0  0.8

pearson = df.corr()
print(pearson.values.shape)  # (22, 22)
features = df.columns.values  # 或者features = pearson.index.values
print(features)  # ['FSC' 'SR1' 'SR2' 'SR3' ...]

fig = go.Figure(
    data=[
        go.Heatmap(x=features, y=features, z=pearson.values, colorscale='blues')
    ]
)

fig.update_layout(
    autosize=False, width=900, height=900,
    title='皮尔逊相关系数热力图',
    # 以下注释的两行代码用于保存本地时调整字体的大小防止显示不全
    # xaxis=dict(title='Feature', titlefont=dict(size=10), tickfont=dict(size=8)),
    # yaxis=dict(title='Feature', titlefont=dict(size=10), tickfont=dict(size=8)),
    xaxis=dict(title='Features'),
    yaxis=dict(title='Features'),
    showlegend=True
)

fig.show()

3. Plotly导出图像到本地
首先我们需要安装两个依赖项:orca 和 psutil,orca 在 PyPi 存储库中不可用,因此需要使用 conda 安装:
conda install -c plotly plotly-orca psutil
或者直接安装 kaleido 模块:
pip install kaleido
安装完成后即可使用 Plotly 的 io 库导出图像(格式可以是 SVG、JPG、PNG等):
import plotly.io as pio

pio.write_image(fig, 'images/figure.svg')


