使用rWCVP映射多样性
- 加载库
- 工作流
- 1. 物种丰富度
- 2. 特有物种丰富度
- 3. 特定区域的物种热力图
加载库
library(rWCVP)
library(tidyverse)
library(sf)
library(gt)
工作流
1. 物种丰富度
我们可以使用 wcvp_summary 将所有物种的全球出现数据压缩为每个 WGSRPD 3 级区域的原始计数
这为我们提供了一个列表,信息在前五个槽中,数据在名为 S u m m a r y 的槽中。我们将使用这个 Summary的槽中。我们将使用这个 Summary的槽中。我们将使用这个Summary数据集。
global_summary = wcvp_summary()
glimpse(global_summary)
ℹ No area specified. Generating global summary.
ℹ No taxon specified. Generating summary of all species.
Matching ■■■■■■■■■■■■■■■■■■■■■■■■■         80% | ETA:  4s

List of 6
 $ Taxon                               : NULL
 $ Area                                : chr "the world"
 $ Grouping_variable                   : chr "area_code_l3"
 $ Total_number_of_species             : int 347525
 $ Number_of_regionally_endemic_species: int 347527
 $ Summary                             : tibble [368 × 6] (S3: tbl_df/tbl/data.frame)
  ..$ area_code_l3: chr [1:368] "ABT" "AFG" "AGE" "AGS" ...
  ..$ Native      : int [1:368] 1608 4510 5331 2082 5357 2990 3382 198 3506 2578 ...
  ..$ Endemic     : int [1:368] 0 862 241 252 852 30 60 19 178 75 ...
  ..$ Introduced  : int [1:368] 300 101 711 412 404 928 182 48 345 101 ...
  ..$ Extinct     : int [1:368] 0 1 1 2 7 2 2 0 30 0 ...
  ..$ Total       : int [1:368] 1908 4618 6045 2497 5769 3921 3602 246 3934 2680 ...
rWCVPdata 包括 WGSRPD 3 级区域的区域多边形 - 这将成为我们添加内容的基础。让我们将 global_summary 添加到空间数据,并绘制一张地图,其中用物种丰富度定义颜色。
area_polygons = rWCVPdata::wgsrpd3 %>%
  left_join(global_summary$Summary, by=c("LEVEL3_COD"="area_code_l3"))

ggplot(area_polygons)+
  geom_sf(aes(fill=Native))

嗯,它没有想象中的那么漂亮而且我们丢失了所有的岛屿 - 让我们做一些调整。
(p_native_richness <- ggplot(area_polygons) +
    geom_sf(aes(fill=Native), col="transparent") +
    stat_sf_coordinates(aes(col=Native))+
    theme_void() +
    scale_fill_viridis_c(name = "Native\nspecies")+
    scale_colour_viridis_c(name = "Native\nspecies")+
    coord_sf(expand=FALSE)
)

2. 特有物种丰富度
我们还可以结合其他指标——让我们看看每个3级地区特有物种的比例。我们也将使用稍微不同的调色板,只是为了好玩。
area_polygons = area_polygons %>%
  mutate(percent_endemic = Endemic/Native)

(p_prop_endemic = ggplot(area_polygons) +
    geom_sf(aes(fill=percent_endemic), col="transparent") +
    stat_sf_coordinates(aes(col=percent_endemic))+
    theme_void()+
    scale_fill_distiller(palette="Reds", direction=1, name="% of species\nthat are\nendemic")+
    scale_colour_distiller(palette="Reds", direction=1,
                           name="% of species\nthat are\nendemic")+
    coord_sf(expand=FALSE)

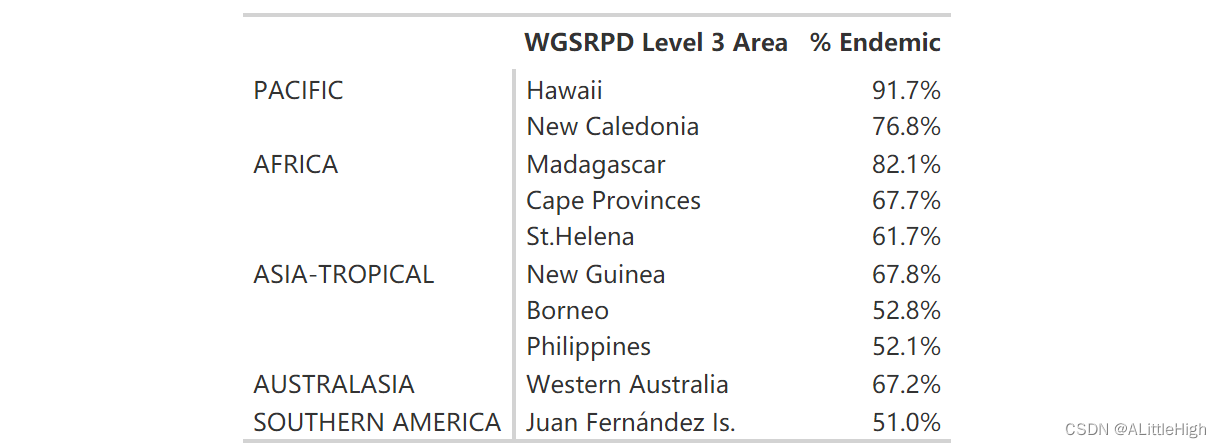
我们可以使用此信息生成前十名的表格
area_polygons %>%
  left_join(wgsrpd_mapping) %>%
  slice_max(percent_endemic,n=10) %>%
  st_drop_geometry() %>%
  select(LEVEL3_NAM, percent_endemic, LEVEL1_NAM) %>%
  group_by(LEVEL1_NAM) %>%
  gt() %>%
  cols_label(
    percent_endemic = "% Endemic",
    LEVEL3_NAM = "WGSRPD Level 3 Area"
  ) %>%
  tab_options(
    column_labels.font.weight = "bold",
    row_group.font.weight = "bold",
    row_group.as_column = TRUE,
    data_row.padding = px(1),
    table.font.size = 12,
    table_body.hlines.color = "transparent",
  ) %>%
  fmt_percent(
    columns = percent_endemic,
    decimals = 1
  )
3. 特定区域的物种热力图
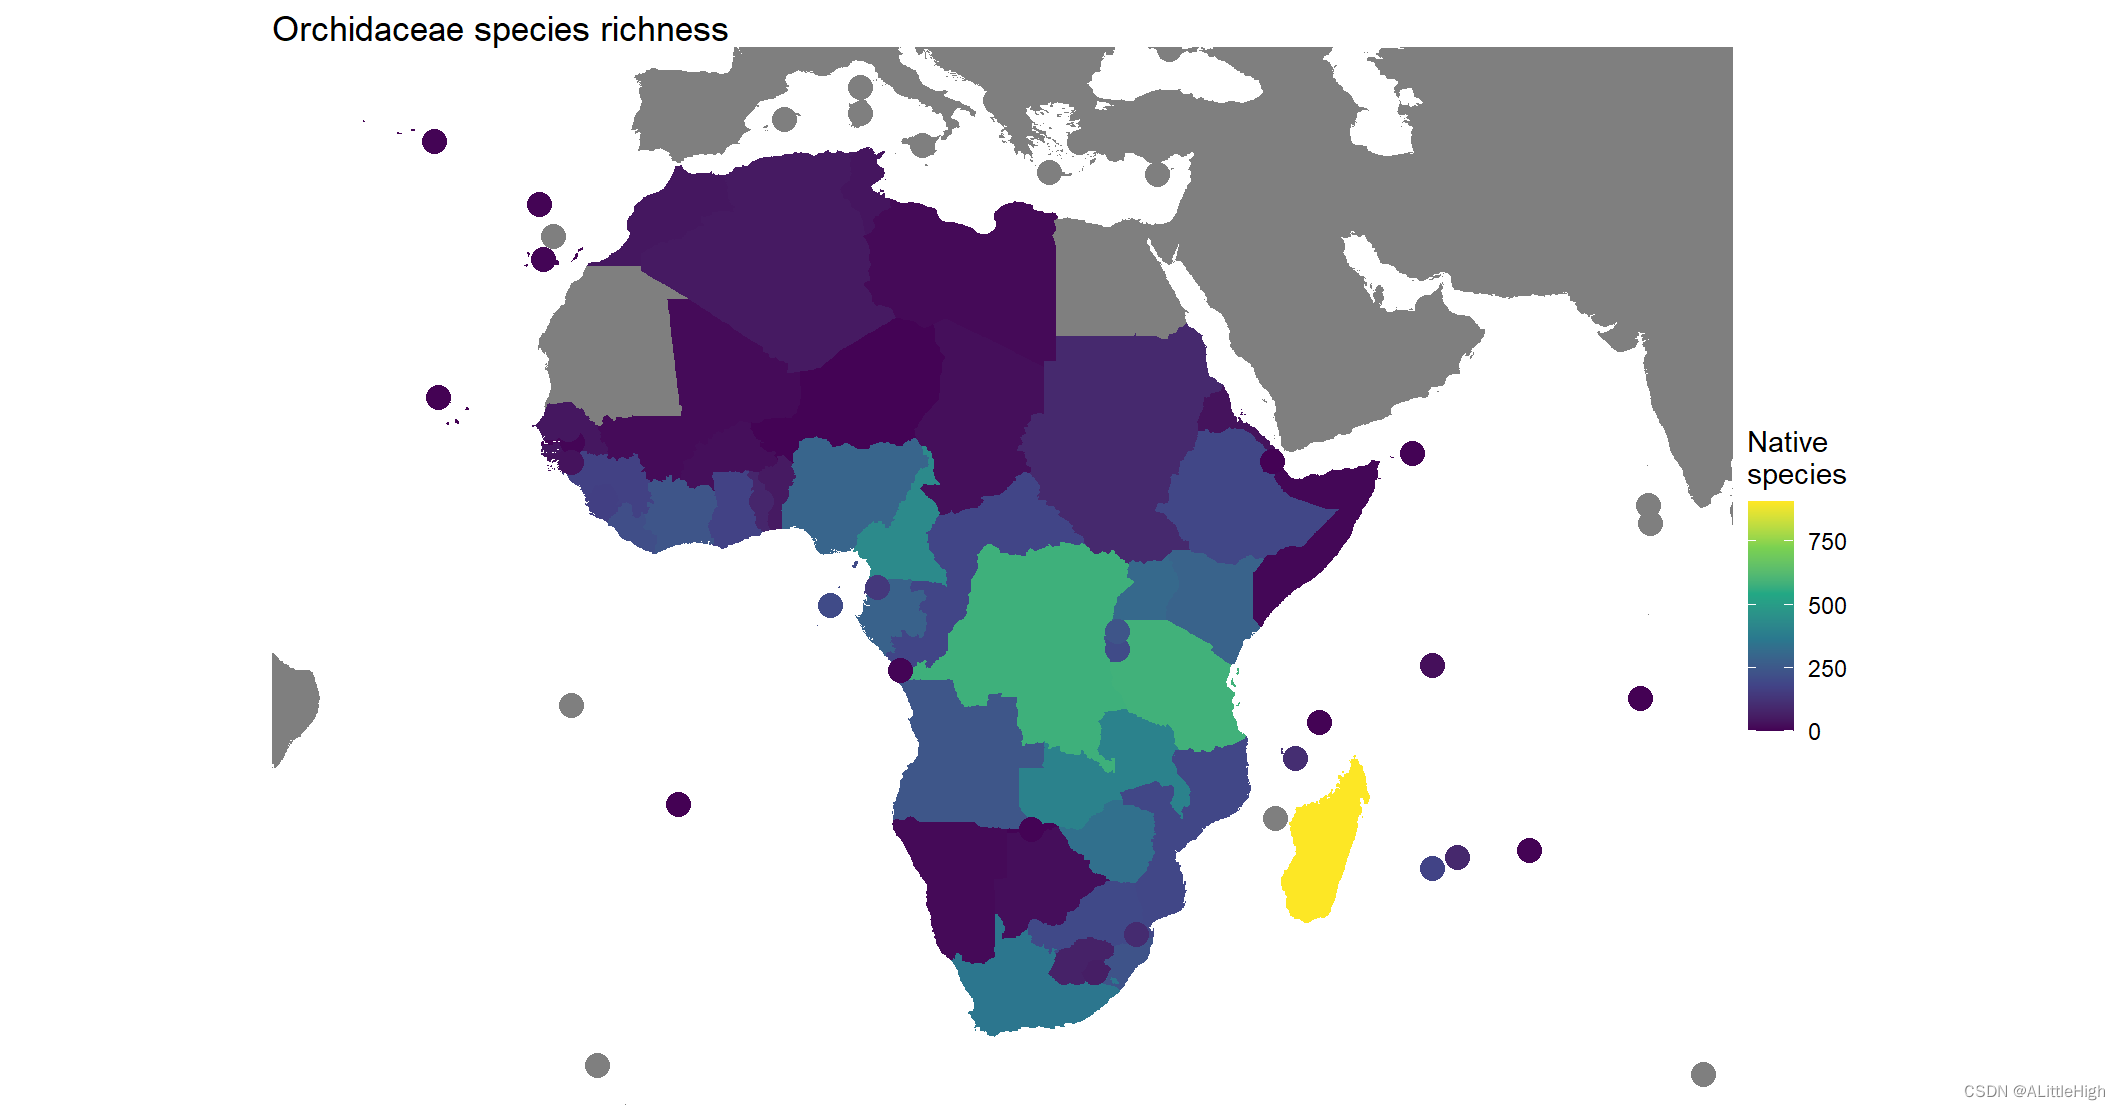
再举一个例子,展示我们如何将地图限制在特定的感兴趣区域。让我们看看非洲的兰花。
orchid_africa_summary = wcvp_summary("Orchidaceae", "family", get_wgsrpd3_codes("Africa"))
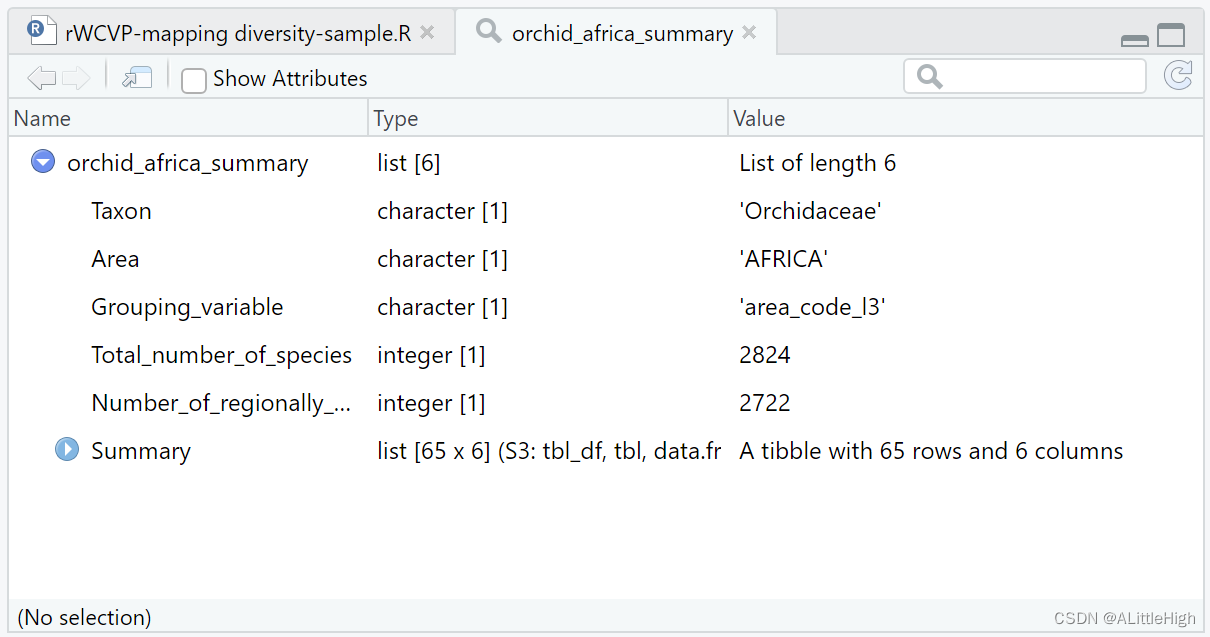
area_polygons = rWCVPdata::wgsrpd3 %>%
  left_join(orchid_africa_summary$Summary, by=c("LEVEL3_COD"="area_code_l3")) %>%
  left_join(wgsrpd_mapping)
我们可以只过滤非洲的多边形,但是从地图的角度来看,保留它们更有意义(尽管是灰色的)。因此,为了约束我们的地图,我们需要设置自定义限制。
bounding_box = st_bbox(area_polygons %>% filter(LEVEL1_NAM =="AFRICA"))

xmin = bounding_box["xmin"] - 2
xmax = bounding_box["xmax"] + 2
ymin = bounding_box["ymin"] - 2
ymax = bounding_box["ymax"] + 2

(p_orchids = ggplot(area_polygons) +
    geom_sf(aes(fill=Native), col="transparent") +
    stat_sf_coordinates(aes(col=Native), size=4)+
    coord_sf(xlim=c(xmin, xmax), ylim=c(ymin, ymax))+
    theme_void()+
    scale_fill_viridis_c(name = "Native\nspecies")+
    scale_colour_viridis_c(name = "Native\nspecies")+
    ggtitle("Orchidaceae species richness")
