文章目录
- 前言
- 一、概念
- 1.1 发展
- 1.2 时序数据
- 1.3 Metric
- 二、Prometheus
- 2.1 架构
- 2.2 配置
- 2.3 查询语言PromQL
- 2.4 Exporter
- 三、Grafana
- 3.1 数据源
- 3.2 权限
- 3.3 面板可视化
- 3.4 仪表盘
- 四、实战
- 4.1 监控 Windows/Linux
- 4.2 监控 JVM
- 4.3 监控 MySQL
- 4.4 监控 Springboot API
- 参考
前言
Prometheus 是用 GO 语言开发的一个开源的系统监控和告警工具包,最初是 2012 年 SoundCloud 发布的,后面被很多大公司组织所使用,于2016年加入了云原生云计算基金会(Cloud Native Computing Foundation,CNCF),并于2018年毕业,它现在是一个独立的开源项目,并独立于任何公司进行维护。
Prometheus是一个非常优秀的监控工具,准确的说,更是一套监控方案。Prometheus提供了监控数据收集,存储,处理可视化和告警的一套完整的监控解决方案。
-
官方网站:https://prometheus.io/
-
github 地址:https://github.com/prometheus/prometheus
Grafana 是一个开源的跨平台的度量分析、可视化工具,支持多种数据源,如Prometheus、Elasticsearch、InfluxDB等。它提供了丰富的可视化图表和面板,可以帮助用户更好地理解和分析监控数据。
- 文档地址:https://grafana.com/docs/grafana/latest/
- github 地址:https://github.com/grafana/grafana
Prometheus 自身携带一个web UI用来显示数据图表,但是有点简陋,而 Grafana 能够支持精美图表的制作并显示,而且自身支持Prometheus, 所以经典的监控方案就是 Prometheus + Grafana。
一、概念
1.1 发展
运维监控的发展历程可以追溯到计算机技术的早期阶段。随着计算机技术的不断发展,运维监控也在不断地演化和改进。
- 最初的运维监控主要是通过手动检查系统日志和性能指标来进行的,这种方法非常耗时且容易出错。
- 随着计算机技术的不断发展,出现了一些基于SNMP 协议的监控工具,例如Nagios、Zabbix等等。这些工具可以自动地收集系统日志和性能指标,并对其进行分析和处理,从而帮助用户更好地了解系统的运行状态。
- 近年来,随着云计算和容器技术的不断发展,运维监控也在不断地演化和改进。例如 Prometheus就是一种基于云原生技术的开源监控系统,它可以帮助用户更好地管理和监控云原生应用程序。
总之,随着计算机技术的不断发展,运维监控也在不断地演化和改进,从最初的手动检查到基于SNMP协议的监控工具,再到现在的自动化运维监控工具,运维监控为用户提供更好的服务和支持。
1.2 时序数据
时序数据,即时间序列数据(Time Series Data),按时间维度顺序记录且索引的数据。像物联网、车联网、工业互联网等领域各种类型的设备都会产生海量的时序数据,这些数据将占世界数据总量的90%以上。在监控平台,时序数据常常指的是系统的性能指标、日志信息等等带有时间戳的序列数据。
时序数据和传统关系数据的对比,时序数据侧重CRUD中的CR,没有U
1.3 Metric
metric(度量,指标)一个很重要的概念,在运维监控出现的非常高频,是指监控系统中的指标,例如CPU使用率、内存使用率、网络流量等等,在Prometheus 其本质是指存在于数据库的一条记录。
在Prometheus client 中可分为4种类型
- Counter:一种累积度量,它表示一个单调递增的计数器,其值只能在重新启动时增加或重置为零。例如,可以使用计数器来表示所服务的请求、已完成的任务或错误的数量。
- Gauge:一个可以任意起伏的单个数值。 测量器通常用于测量值,比如温度或当前内存使用量,但也用于可能上下波动的“计数”,比如并发请求的数量。
- Histogram:直方图,表示一段时间内的数据采样统计结果,通过分桶(bucket)的方式来统计样本的分布。比如统计接口的耗时,多少的请求落在 10ms - 20ms,多少的请求落在 20ms - 30ms 等。
- Summary:和Histogram类似,根据样本统计出百分位。例如统计链路耗时,TP99 是多少,TP95 是多少等。
二、Prometheus
2.1 架构

-
Prometheus Server:利用服务发现机制获取需要监控的 target,通过Pull方式从target处拉取指标数据,根据定义的rule,可以提前对指标数据再次进行计算,触发报警的发送到 alertmanager组件,用于收集和存储时间序列数据。
-
PushGateway:各个目标主机可上报数据到 PushGateway,然后Prometheus server统一从pushgateway拉取数据。
-
Exporters:采集已有的第三方服务监控指标并暴露metrics。Prometheus支持多种exporter,通过exporter可以采集metrics数据,然后发送到Prometheus server 端。
-
Alertmanager:组件根据报警的告警方式发送相应的通知。从Prometheus server端接收到alerts 后,会进行去重,分组,并路由到相应的接收方,发出报警,常见的接收方式有:电子邮件,微信,钉钉,slack等。
-
Grafana:数据可视化组件,监控仪表盘,通过PromQL从Prometheus Server查询数据,进行展示
-
Prometheus web UI:简单的Web控制台,默认端口9090
2.2 配置
Prometheus 可以通过 --config.file 命令选项来加载配置文件。
当启用–web.enable-lifecycle,可通过URL /-/reload 发送 POST 请求实现不需要重启Prometheus 加载配置文件
配置文档:https://prometheus.io/docs/prometheus/latest/configuration/configuration/,下面是4个常用的配置大类
-
global
配置全局的信息,如监控数据的间隔,业务的超时时间,告警规则执行周期等
- scrape_interval 拉取 targets 的默认时间间隔,默认1m
- scrape_timeout 拉取超时时间,默认10s
- evaluation_interval 执行rules间隔时间,默认1m
-
rule_files
包含两种规则文件:记录规则和告警规则。
-
记录规则
记录规则允许预先计算经常需要的或计算成本昂贵的表达式,并将其结果保存为一组新的时间序列。查询预先计算的结果通常会比每次需要时执行原始表达式快得多。这对于仪表板特别有用,它们需要在每次刷新时重复查询相同的表达式。
文档:https://prometheus.io/docs/prometheus/latest/configuration/recording_rules/
-
告警规则
根据PromQL来定义警报条件,并向外部服务发送关于触发警报的通知。
文档:https://prometheus.io/docs/prometheus/latest/configuration/alerting_rules/
-
-
alerting
配置管理 Alertmanager
-
scrape_configs
配置拉取数据节点job,文档:https://prometheus.io/docs/prometheus/latest/configuration/configuration/#scrape_config
- job_name job名字
- scrape_interval 抓取频率,默认globa.scrape_interval
- scrape_timeout 抓取超时,默认globa.scrape_timeout
- metrics_path 抓取路径, 默认/metric
- static_configs 抓取目标URL地址
2.3 查询语言PromQL
Prometheus 提供了一种名为PromQL(Prometheus Query Language)的函数式查询语言,允许用户实时选择和聚合时间序列数据.文档地址:https://prometheus.io/docs/prometheus/latest/querying/basics/
-
过滤查询
通过{} 对结果进行过滤,内部标签值可使用=表示相等,!= 表示不相等,=~表示正则匹配,!~表示正则不匹配
http_requests_total{method="GET"} http_requests_total{environment=~"staging|testing|development",method!="GET"} http_requests_total{status!~"4.."} -
范围时间查询
可通过[时间值]进行选择,例如
http_requests_total [5m] -
偏移时间查询
通过offset 可以允许更改查询中单个即时向量和范围向量的时间偏移量。例如过去5分钟http请求总数
http_requests_total offset 5m -
定点时间查询
@ 允许更改查询中 单个即时向量和范围向量的计算时间。提供给@修改符的时间是一个unix时间戳,用浮点数表示
例如:返回在2021-01-04T07:40:00+00:00时的值
http_requests_total @ 1609746000 -
聚合查询
Prometheus 提供sum,max,min,avg,count,bottomk,topk等聚合命令查询数据
sum(http_requests_total) sum by (application, group) (http_requests_total) topk(5, http_requests_total) -
函数查询
Prometheus 提供函数参与计算查询数据,文档:https://prometheus.io/docs/prometheus/latest/querying/functions/
rate(http_requests_total[5m])[30m:1m]
2.4 Exporter
Prometheus通过 Exporter 来获取数据,可以根据文档中的链接按需下载安装:https://prometheus.io/docs/instrumenting/exporters/
三、Grafana
3.1 数据源

3.2 权限
grafana 提供一套权限系统,能够让用户根据不同的角色拥有不同的权限,如面板的查看,编辑等等
权限分为三种:admin, viewer, editer
可通过邀请用户,并向用户发送链接的操作来添加用户,并且可以通过组来通知查看面板的权限控制
3.3 面板可视化
相关文档:https://grafana.com/docs/grafana/latest/panels-visualizations/
-
面板查询表达式

-
面板种类
最常见的就是Graph,更多的种类可以去官网下载导入,注意下版本

-
面板参数
y轴的参数如果是百分比可以通过如下控制

3.4 仪表盘
上述多个面板整合在一起就是仪表盘了
-
导入
除了可以自定义面板外,还可以使用其他人制作好的面板 https://grafana.com/grafana/dashboards/,通过菜单中的Import导入
-
查看
-
查看仪表盘可通过url添加参数&kiosk 隐藏侧边栏和顶部菜单
-
匿名访问
修改配置文件conf/defaults.ini
[auth.anonymous] # 设置为true即可匿名访问,不用登陆就可以直接访问url enabled = true -
嵌套允许
修改配置文件conf/defaults.ini
# 设置为true即可嵌套
allow_embedding = true
-
-
变量
通过变量可以实现下拉列表选择想要显示的部分:文档:https://grafana.com/docs/grafana/latest/dashboards/variables/
四、实战
4.1 监控 Windows/Linux
windows: 下载Exporter https://github.com/prometheus-community/windows_exporter/releases
linux: 下载 https://github.com/prometheus/node_exporter/releases
下面以windows 为例
windows_exporter.exe --collectors.enabled "[defaults],process,container"
windows_exporter.exe --config.file config.yml

监控项
| 监控指标 | 表达式 |
|---|---|
| CPU 使用率 | 100 - (avg by (instance,region) (irate(windows_cpu_time_total{mode=“idle”}[2m])) * 100) |
| 内存 使用率 | 100-(windows_os_physical_memory_free_bytes/windows_cs_physical_memory_bytes)*100 |
| 磁盘总使用率 | (sum(windows_logical_disk_size_bytes{volume!~“Harddisk."}) by (instance) - sum(windows_logical_disk_free_bytes{volume!~"Harddisk.”}) by (instance)) / sum(windows_logical_disk_size_bytes{volume!~"Harddisk."}) by (instance) *100 |
| 各个磁盘使用率 | 100- 100 * (windows_logical_disk_free_bytes/windows_logical_disk_size_bytes) |
| 带宽 | (sum(irate(windows_net_bytes_total[1m])) > 1)* 8 |
| 系统线程 | windows_system_threads |
| 系统进程 | windows_os_processes |
4.2 监控 JVM
下载Exporter:https://github.com/prometheus/jmx_exporter/releases
java -javaagent:jmx_prometheus_javaagent-0.18.0.jar=12345:config.yml -jar vhr-web-0.0.1-SNAPSHOT.jar
rules:
- pattern: ".*"

| 监控指标 | 表达式 |
|---|---|
| jvm 堆内存使用 | jvm_memory_bytes_used{area=“heap”} |
| Eden 区使用 | jvm_memory_pool_bytes_used{pool=“PS Eden Space”} |
| Old 区使用 | jvm_memory_pool_bytes_used{pool=“PS Old Gen”} |
| 元空间 使用 | jvm_memory_pool_bytes_used{pool=“Metaspace”} |
| gc时间 | increase(jvm_gc_collection_seconds_sum[$__interval]) |
| gc增长次数 | increase(jvm_gc_collection_seconds_count[$__interval]) |
4.3 监控 MySQL
https://github.com/prometheus/mysqld_exporter/releases
mysqld_exporter.exe --config.my-cnf config.cnf --web.listen-address=localhost:9104
[client]
user=root
password=

| 监控指标 | 表达式 |
|---|---|
| 连接数 | sum(max_over_time(mysql_global_status_threads_connected[$__interval])) |
| 慢查询数 | sum(rate(mysql_global_status_slow_queries[$__interval])) |
| 平均运行线程数 | sum(avg_over_time(mysql_global_status_threads_running[$__interval])) |
| 当前QPS | rate(mysql_global_status_queries[$__interval]) |
4.4 监控 Springboot API
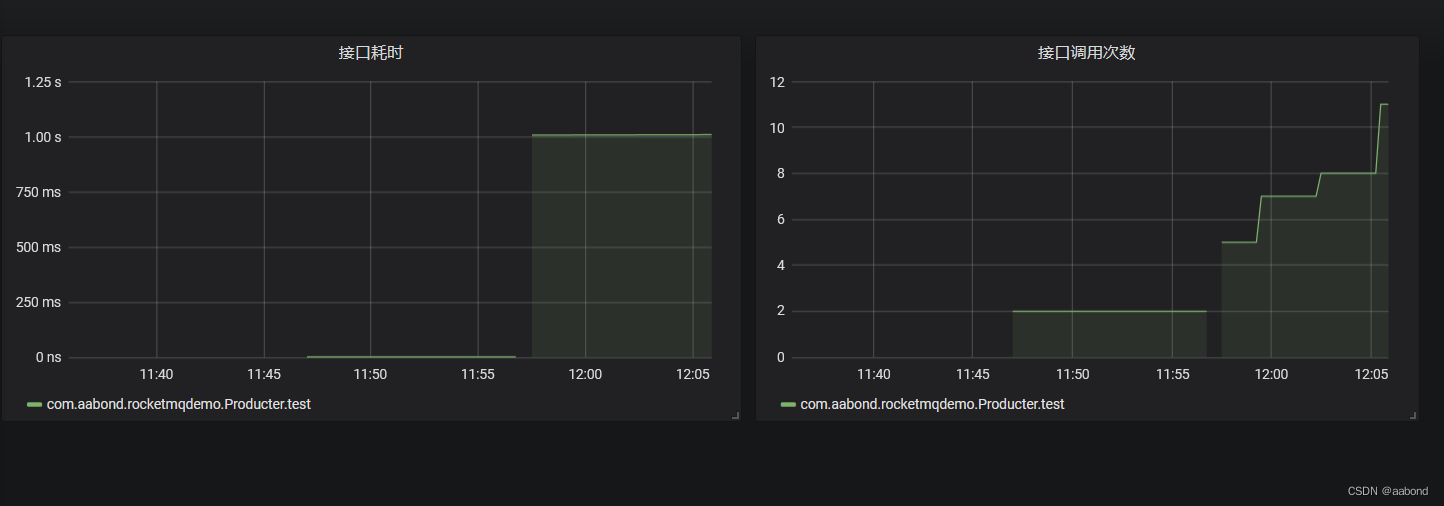
有时候在 Springboot 项目中需要统计 API 接口的调用次数和调用时间,可以使用actuator+micrometer ,已经内置两个注解实现两者功能,因为要使用到aop,所以还需导入aop包
文档:https://docs.spring.io/spring-boot/docs/current/reference/html/actuator.html#actuator.enabling
<dependency>
    <groupId>io.micrometer</groupId>
    <artifactId>micrometer-registry-prometheus</artifactId>
</dependency>

<dependency>
    <groupId>org.springframework.boot</groupId>
    <artifactId>spring-boot-starter-actuator</artifactId>
</dependency>

<dependency>
    <groupId>org.springframework.boot</groupId>
    <artifactId>spring-boot-starter-aop</artifactId>
</dependency>
management:
  metrics:
    tags:
      application: ${spring.application.name}
    web:
      server:
        max-uri-tags: 200
  endpoints:
    web:
      exposure:
        include: prometheus

spring:
  application:
    name: prometheus-test-api
@Bean
public TimedAspect timedAspect(MeterRegistry registry) {
	return new TimedAspect(registry);
}
@GetMapping("/test")
@Timed(value = "test_method",description = "测试接口耗时")
@Counted(value = "test_method", description = "测试接口次数")
public String test() {
    //try {
    //    Thread.sleep(1000);
    //} catch (InterruptedException e) {
    //    throw new RuntimeException(e);
    //}
    return "ok";
}
参考
- Prometheus+Grafana 搭建全方位的监控告警系统


