1 基础概念
Figure: 可以理解为 canvas(画布),在画布上可以展示一个或多个Axes
Axes:中文翻译为轴,但与数学中的概念不同,Axes可以理解为子画布,它属于Figure。也可以理解为它就是一个图形或绘制图形的区域,每个Axes有自己的轴、标题、图例等
2 一个Figure,一个Axes
# sphinx_gallery_thumbnail_number = 10
import numpy as np
import matplotlib.pyplot as plt
from matplotlib.ticker import FuncFormatter

data = {'Barton LLC': 109438.50,
        'Frami, Hills and Schmidt': 103569.59,
        'Fritsch, Russel and Anderson': 112214.71,
        'Jerde-Hilpert': 112591.43,
        'Keeling LLC': 100934.30,
        'Koepp Ltd': 103660.54,
        'Kulas Inc': 137351.96,
        'Trantow-Barrows': 123381.38,
        'White-Trantow': 135841.99,
        'Will LLC': 104437.60}
group_data = list(data.values())
group_names = list(data.keys())
group_mean = np.mean(group_data)

# 查看风格 风格控制这颜色,线宽,背景等
# print(plt.style.available)
plt.style.use('ggplot')

# 自动调整视图布局
# rc:resource configuration
plt.rcParams.update({'figure.autolayout': True})

# fig即Figure, ax即Axes
fig, ax = plt.subplots(figsize=(8, 8))
# 水平柱状图
ax.barh(group_names, group_data)
# x 轴标签旋转 45度
labels = ax.get_xticklabels()
plt.setp(labels, rotation=45, horizontalalignment='right')

# 在 group_mean 位置添加竖线,ls:线性,color:颜色
ax.axvline(group_mean, ls='--', color='r')

# 添加提示词
for group in [0, 5, 8]:
    ax.text(145000, group, "New Company", fontsize=10,
            verticalalignment="center")

# x轴标签格式
def currency(x, pos):
    """x:值
       pos:位置
    """
    if x >= 1e6:
        s = '${:1.1f}M'.format(x*1e-6)
    else:
        s = '${:1.0f}K'.format(x*1e-3)
    return s
formatter = FuncFormatter(currency)

# xlim:x轴范围  xlabel:x轴名称,ylabel:y轴名称,title:标题
ax.set(xlim=[-10000, 140000], xlabel='Total Revenue', ylabel='Company',
       title='Company Revenue')
ax.xaxis.set_major_formatter(formatter)
ax.set_xticks([0, 25e3, 50e3, 75e3, 100e3, 125e3])

3 一个Figure,多个Axes
import matplotlib as mpl
mpl.rcParams['font.sans-serif'] = ['SimHei'] # 显示中文
plt.rcParams['axes.unicode_minus']=False # 显示负号

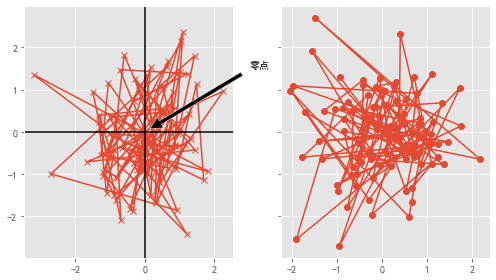
data1, data2, data3, data4 = np.random.randn(4, 100)
# nrows:行数, ncols:列数, sharey:是否共用y轴
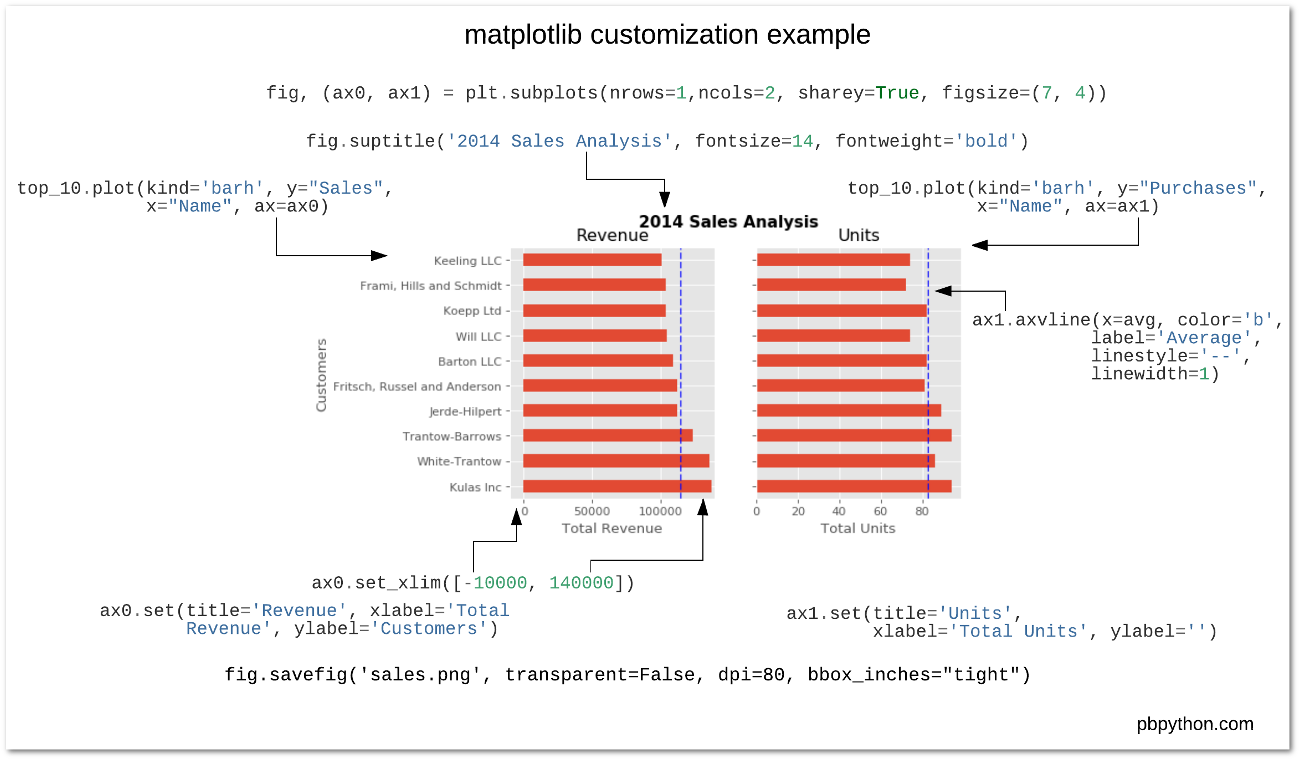
fig, (ax1, ax2) = plt.subplots(nrows=1, ncols=2, sharey=True, figsize=(7, 4))
# 画第1个图
ax1.plot(data1, data2, marker="x")
# 添加标注
ax1.annotate('零点', xy=(0, 0), xytext=(3, 1.5),
             arrowprops=dict(facecolor='black', shrink=0.05),
             )
# 添加竖线、横线
ax1.axvline(0, color="black")
ax1.axhline(0, color="black")

# 画第2个图
ax2.plot(data3, data4, marker="o")
# 另一种编程风格
import matplotlib.pyplot as plt
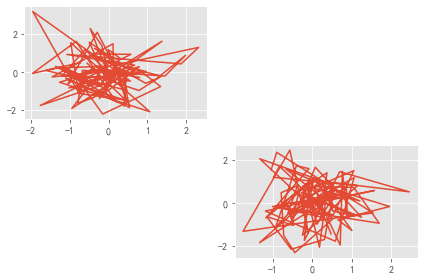
data1, data2, data3, data4 = np.random.randn(4, 100)
# 行数,列数 当 行数*列数<10 时,可以直接指定第i个Axes
plt.subplot(221)
plt.plot(data1, data2)
plt.grid(True)

plt.subplot(224)
plt.plot(data3, data4)
plt.grid(True)

plt.show()
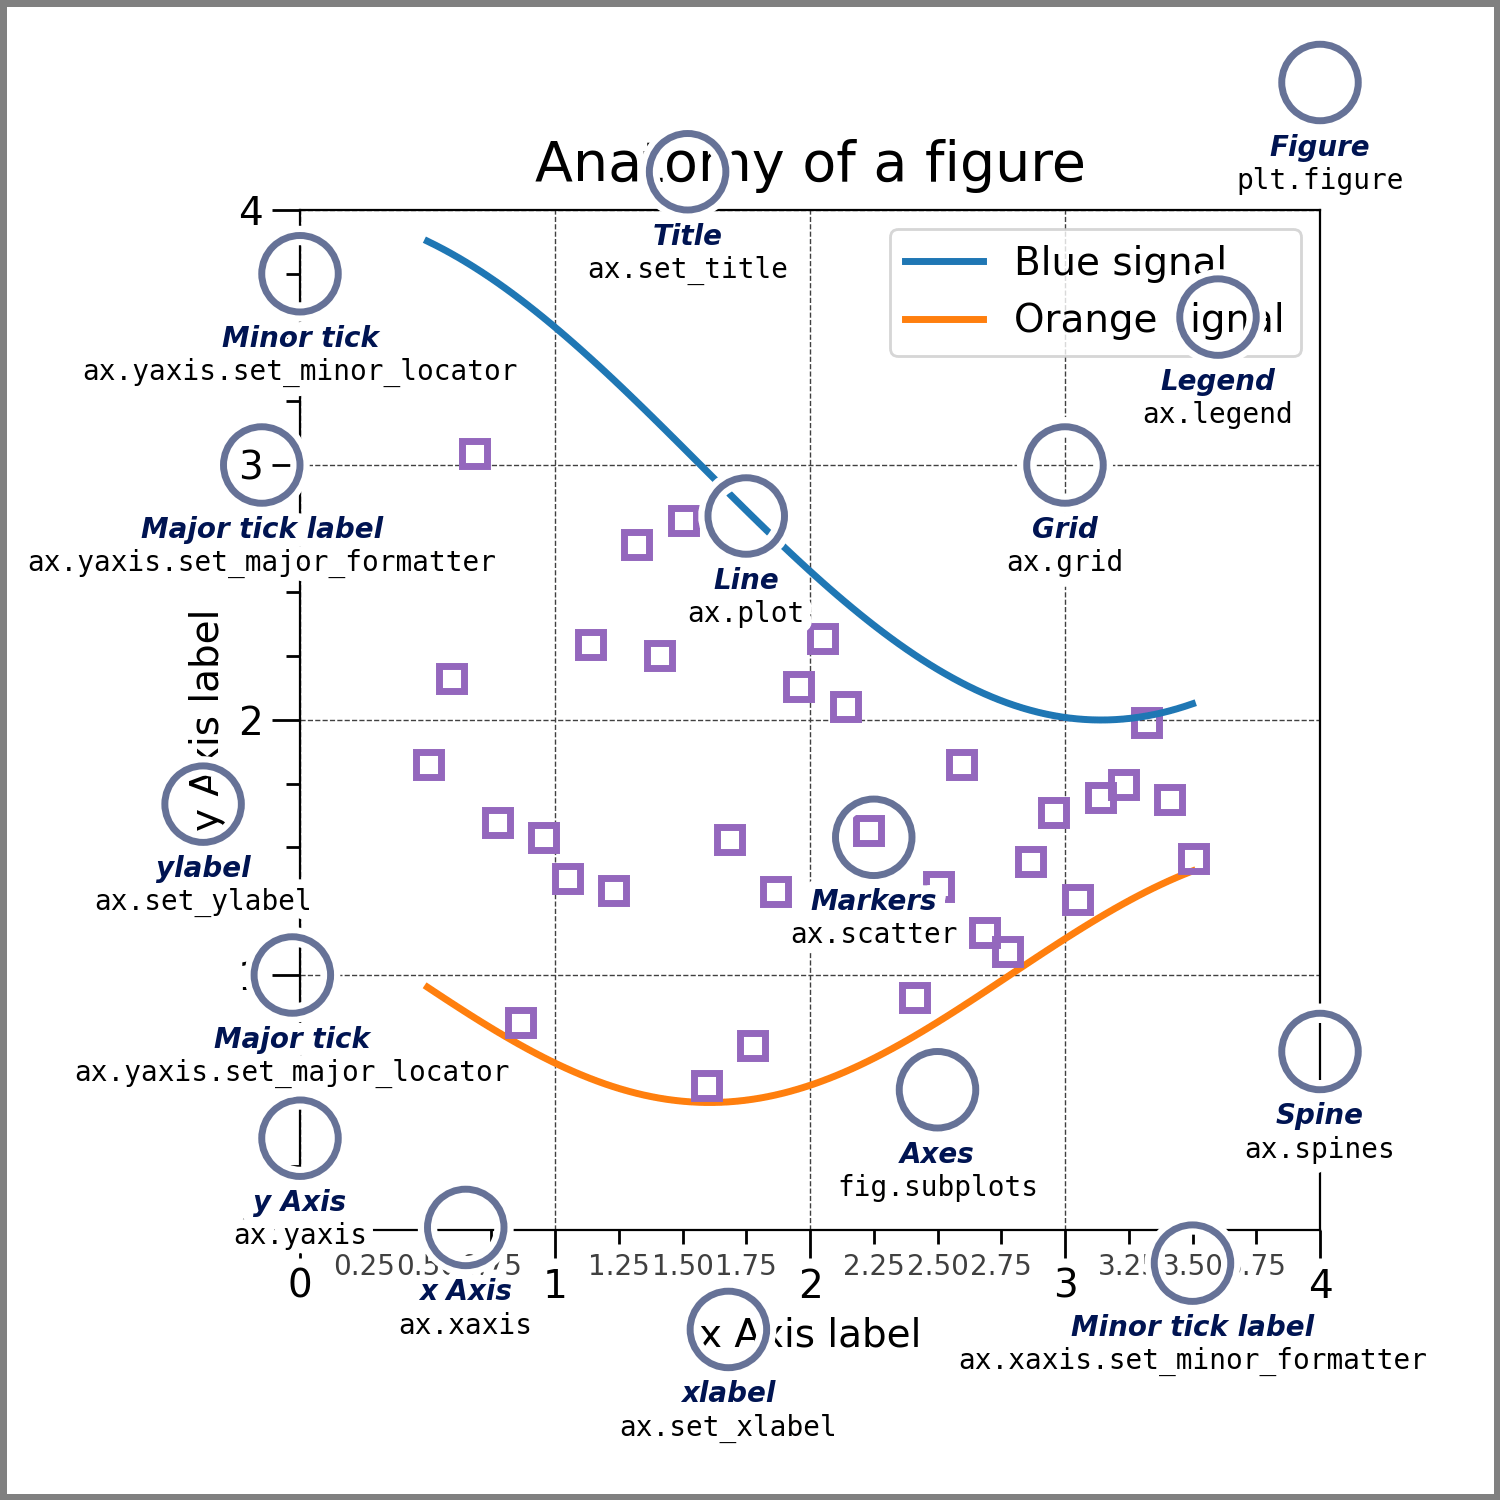
关于一些概念的图解:
参考
Effectively Using Matplotlib
Usage Guide
