目录
Node & Software & Docker Images Lists
Prometheus introduction
Download Kubernetes Prometheus Manifest Files
Install Prometheus Monitoring Kubernetes
Create a Namespace
Create a Cluster Role And Binding It
Create a Config Map
Create a Prometheus Deployment
Connecting To Prometheus Dashboard
Method 1:Using Kubectl port forwarding
Method 2:Exposing Prometheus as a Service By NodePort
Method 3: Exposing Prometheus Using Ingress
Install Kube State Metrics
Install
Install Up Alertmanager
Install
Install Up Grafana
Install
Create Kubernetes Dashboards on Grafana
Install Up Node Exporter
Install
Querying Node-exporter Metrics in Prometheus
Visualizing Prometheus Node Exporter Metrics as Grafana Dashboards
参考文档
Node & Software & Docker Images Lists
| HOSTNAME | IP | NODE TYPE | CONFIG |
| master1 | 192.168.1.100 | master | 2vCPU4G |
| node1 | 192.168.1.110 | worker | 2vCPu2G |
| node2 | 192.168.1.120 | worker | 2vCPu2G |
| Image Type | Name/Version |
| k8s | registry.aliyuncs.com/google_containers/coredns:v1.9.3 registry.aliyuncs.com/google_containers/etcd:3.5.6-0 registry.aliyuncs.com/google_containers/kube-apiserver:v1.26.0 registry.aliyuncs.com/google_containers/kube-controller-manager:v1.26.0 registry.aliyuncs.com/google_containers/kube-proxy:v1.26.0 registry.aliyuncs.com/google_containers/kube-scheduler:v1.26.0 registry.aliyuncs.com/google_containers/pause:3.9 |
| calico | docker.io/calico/apiserver:v3.24.5 docker.io/calico/cni:v3.24.5 docker.io/calico/kube-controllers:v3.24.5 docker.io/calico/node:v3.24.5 docker.io/calico/pod2daemon-flexvol:v3.24.5 docker.io/calico/typha:v3.24.5 quay.io/tigera/operator:v1.28.5 |
| dashboard | docker.io/kubernetesui/dashboard:v2.7.1 |
| prometheus | docker.io/bitnami/kube-state-metrics:2.8.2 docker.io/grafana/grafana:latest docker.io/kubernetesui/metrics-scraper:v1.0.8 docker.io/prom/alertmanager:latest docker.io/prom/node-exporter:latest docker.io/prom/prometheus:latest |
| Service | HostPort:Container Port | NodePort |
| prometheus-service | 8080:9090 | 30000 |
| node-exporter | 9100:9100 | none |
| grafana-service | 3000:3000 | 32000 |
| alertmanager-service | 9030:9030 | 31000 |
| kube-state-metrics | 8080:http-metrics,8081:telemetry(headless) | none |
Prometheus introduction
Prometheus is a high-scalable open-source monitoring framework. It provides out-of-the-box monitoring capabilities for the Kubernetes container orchestration platform. Also, In the observability space, it is gaining huge popularity as it helps with metrics and alerts.
There are a few key points I would like to list for your reference.
- Metric Collection: Prometheus uses the pull model to retrieve metrics over HTTP. There is an option to push metrics to Prometheus using Pushgateway for use cases where Prometheus cannot Scrape the metrics. One such example is collecting custom metrics from short-lived kubernetes jobs & Cronjobs.
- Metric Endpoint: The systems that you want to monitor using Prometheus should expose the metrics on an
/metricsendpoint. Prometheus uses this endpoint to pull the metrics in regular intervals. - PromQL: PromQL is a very flexible query language that can be used to query the metrics in the Prometheus dashboard. Also, the PromQL query will be used by Prometheus UI and Grafana to visualize metrics.
- Prometheus Exporters: Exporters are libraries that convert existing metrics from third-party apps to Prometheus metrics format. There are many official and community Prometheus exporters.Like the Prometheus node exporter,which exposes all Linux system-level metrics in Prometheus format.
- TSDB (time-series database): Prometheus uses TSDB for storing all the data efficiently. By default, all the data gets stored locally. However, to avoid a single point of failure, there are options to integrate remote storage for Prometheus TSDB.
To know more about prometheus architecture,you can refer prometheus架构 :: AWS Workshop
Download Kubernetes Prometheus Manifest Files
In this guide,i want to expore all detail about install Prometheus Monitoring on Kubernetes Cluster.Of course you can install by prometheus-operator which use helm tools and get easily install.
Setup First, you need to download the Kubernetes Prometheus Manifest file. I put all files in git-repository, which includes Prometheus-server, Alertmanager, Grafana, Node Exporter files.
git clone https://github.com/ck784101777/kubernetes-prometheus-configs.gittree kubernetes-prometheus-configs-main
kubernetes-prometheus-configs-main
├── kubernetes-alert-manager
│ ├── alertManagerConfigMap.yaml
│ ├── alertTemplateConfigMap.yaml
│ ├── deployment.yaml
│ └── service.yaml
├── kubernetes-grafana
│ ├── deployment.yaml
│ ├── grafana-datasources-config
│ └── service.yaml
├── kubernetes-node-exporter
│ ├── daemonset-.yaml
│ └── service.yaml
├── kubernetes-prometheus
│ ├── clusterRole.yaml
│ ├── config-map.yaml
│ ├── prometheus-deployment.yaml
│ ├── prometheus-ingress.yaml
│ └── prometheus-service.yaml
├── kubernetes-state-metrics
│ ├── cluster-role-binding.yaml
│ ├── cluster-role.yaml
│ ├── deployment.yaml
│ ├── service-account.yaml
│ └── service.yaml
└── README.md
Install Prometheus Monitoring Kubernetes
Before starting, make sure you have a kubernetes cluster. Or if you don't have a kubernetes cluster up, follow this guide to get it:Install Kubernetes 1.26 on Centos 7.9
Create a Namespace
First, we will create a Kubernetes namespace for all our monitoring components. If you don’t create a dedicated namespace, all the Prometheus kubernetes deployment objects get deployed on the default namespace.
Execute the following command to create a new namespace named monitoring.
kubectl create namespace monitoringCreate a Cluster Role And Binding It
We created a cluster role called prometheus and gave it permissions to get, list and monitor resources about nodes,services,endpoints,pods, ingresses,and deployments.You want monitor more resources you can customize it.
And we set role-prometheus to bind to the monitoring namespaces,which means that the role has the permission to access all the secrets in that namespace.
apiVersion: rbac.authorization.k8s.io/v1
kind: ClusterRole
metadata:
  name: prometheus
rules:
- apiGroups: [""]
  resources:
  - nodes
  - nodes/proxy
  - services
  - endpoints
  - pods
  - deployment
  verbs: ["get", "list", "watch"]
- apiGroups:
  - extensions
  resources:
  - ingresses
  verbs: ["get", "list", "watch"]
- nonResourceURLs: ["/metrics"]
  verbs: ["get"]
---
apiVersion: rbac.authorization.k8s.io/v1
kind: ClusterRoleBinding
metadata:
  name: prometheus
roleRef:
  apiGroup: rbac.authorization.k8s.io
  kind: ClusterRole
  name: prometheus
subjects:
- kind: ServiceAccount
  name: default
  namespace: monitoring
kubectl apply -f clusterRole.yamlCreate a Config Map
We need two files to setup Prometheus configuration, one is prometheus.yaml file and the other is prometheus.rules file.
prometheus.yaml: This is the main Prometheus configuration which include all the scrape configs, such as service discovery details, storage locations, data retention configs, etc)prometheus.rules: This file contains all the Prometheus alerting rules
The prometheus.yaml contains all the configurations to discover pods and services running in the Kubernetes cluster dynamically. We have the following scrape jobs in our Prometheus scrape configuration.
kubernetes-apiservers: It gets all the metrics from the API servers.kubernetes-nodes: It collects all the kubernetes node metrics.kubernetes-pods: All the pod metrics.kubernetes-cadvisor: Collects all cAdvisor metrics.kubernetes-service-endpoints: All the Service endpoints.
These two files are stored in the container with the path /etc/prometheus. After the deployment is created, you can run `kubectl exec -it -n monitoring <podName> ls /etc/prometheus` to show it.
apiVersion: v1
kind: ConfigMap
metadata:
  name: prometheus-server-conf
  labels:
    name: prometheus-server-conf
  namespace: monitoring
data:
  prometheus.rules: |-
    groups:
    - name: devopscube demo alert
      rules:
      - alert: High Pod Memory
        expr: sum(container_memory_usage_bytes) > 1
        for: 1m
        labels:
          severity: slack
        annotations:
          summary: High Memory Usage
  prometheus.yml: |-
    global:
      scrape_interval: 5s
      evaluation_interval: 5s
    rule_files:
      - /etc/prometheus/prometheus.rules
    alerting:
      alertmanagers:
      - scheme: http
        static_configs:
        - targets:
          - "alertmanager.monitoring.svc:9093"
    scrape_configs:
      - job_name: 'node-exporter'
        kubernetes_sd_configs:
          - role: endpoints
        relabel_configs:
        - source_labels: [__meta_kubernetes_endpoints_name]
          regex: 'node-exporter'
          action: keep
      - job_name: 'kubernetes-apiservers'
        kubernetes_sd_configs:
        - role: endpoints
        scheme: https
        tls_config:
          ca_file: /var/run/secrets/kubernetes.io/serviceaccount/ca.crt
        bearer_token_file: /var/run/secrets/kubernetes.io/serviceaccount/token
        relabel_configs:
        - source_labels: [__meta_kubernetes_namespace, __meta_kubernetes_service_name, __meta_kubernetes_endpoint_port_name]
          action: keep
          regex: default;kubernetes;https
      - job_name: 'kubernetes-nodes'
        scheme: https
        tls_config:
          ca_file: /var/run/secrets/kubernetes.io/serviceaccount/ca.crt
        bearer_token_file: /var/run/secrets/kubernetes.io/serviceaccount/token
        kubernetes_sd_configs:
        - role: node
        relabel_configs:
        - action: labelmap
          regex: __meta_kubernetes_node_label_(.+)
        - target_label: __address__
          replacement: kubernetes.default.svc:443
        - source_labels: [__meta_kubernetes_node_name]
          regex: (.+)
          target_label: __metrics_path__
          replacement: /api/v1/nodes/${1}/proxy/metrics
      - job_name: 'kubernetes-pods'
        kubernetes_sd_configs:
        - role: pod
        relabel_configs:
        - source_labels: [__meta_kubernetes_pod_annotation_prometheus_io_scrape]
          action: keep
          regex: true
        - source_labels: [__meta_kubernetes_pod_annotation_prometheus_io_path]
          action: replace
          target_label: __metrics_path__
          regex: (.+)
        - source_labels: [__address__, __meta_kubernetes_pod_annotation_prometheus_io_port]
          action: replace
          regex: ([^:]+)(?::\d+)?;(\d+)
          replacement: $1:$2
          target_label: __address__
        - action: labelmap
          regex: __meta_kubernetes_pod_label_(.+)
        - source_labels: [__meta_kubernetes_namespace]
          action: replace
          target_label: kubernetes_namespace
        - source_labels: [__meta_kubernetes_pod_name]
          action: replace
          target_label: kubernetes_pod_name
      - job_name: 'kube-state-metrics'
        static_configs:
          - targets: ['kube-state-metrics.kube-system.svc.cluster.local:8080']
      - job_name: 'kubernetes-cadvisor'
        scheme: https
        tls_config:
          ca_file: /var/run/secrets/kubernetes.io/serviceaccount/ca.crt
        bearer_token_file: /var/run/secrets/kubernetes.io/serviceaccount/token
        kubernetes_sd_configs:
        - role: node
        relabel_configs:
        - action: labelmap
          regex: __meta_kubernetes_node_label_(.+)
        - target_label: __address__
          replacement: kubernetes.default.svc:443
        - source_labels: [__meta_kubernetes_node_name]
          regex: (.+)
          target_label: __metrics_path__
          replacement: /api/v1/nodes/${1}/proxy/metrics/cadvisor
      - job_name: 'kubernetes-service-endpoints'
        kubernetes_sd_configs:
        - role: endpoints
        relabel_configs:
        - source_labels: [__meta_kubernetes_service_annotation_prometheus_io_scrape]
          action: keep
          regex: true
        - source_labels: [__meta_kubernetes_service_annotation_prometheus_io_scheme]
          action: replace
          target_label: __scheme__
          regex: (https?)
        - source_labels: [__meta_kubernetes_service_annotation_prometheus_io_path]
          action: replace
          target_label: __metrics_path__
          regex: (.+)
        - source_labels: [__address__, __meta_kubernetes_service_annotation_prometheus_io_port]
          action: replace
          target_label: __address__
          regex: ([^:]+)(?::\d+)?;(\d+)
          replacement: $1:$2
        - action: labelmap
          regex: __meta_kubernetes_service_label_(.+)
        - source_labels: [__meta_kubernetes_namespace]
          action: replace
          target_label: kubernetes_namespace
        - source_labels: [__meta_kubernetes_service_name]
          action: replace
          target_label: kubernetes_name
kubectl create -f config-map.yamlCreate a Prometheus Deployment
Create a file named prometheus-deployment.yaml and copy the following contents onto the file. In this configuration, we are mounting the Prometheus config map as a file inside /etc/prometheus as explained in the previous section.
apiVersion: apps/v1
kind: Deployment
metadata:
  name: prometheus-deployment
  namespace: monitoring
  labels:
    app: prometheus-server
spec:
  replicas: 1
  selector:
    matchLabels:
      app: prometheus-server
  template:
    metadata:
      labels:
        app: prometheus-server
    spec:
      containers:
        - name: prometheus
          image: prom/prometheus
          args:
            - "--storage.tsdb.retention.time=12h"
            - "--config.file=/etc/prometheus/prometheus.yml"
            - "--storage.tsdb.path=/prometheus/"
          ports:
            - containerPort: 9090
          resources:
            requests:
              cpu: 500m
              memory: 500M
            limits:
              cpu: 1
              memory: 1Gi
          volumeMounts:
            - name: prometheus-config-volume
              mountPath: /etc/prometheus/
            - name: prometheus-storage-volume
              mountPath: /prometheus/
      volumes:
        - name: prometheus-config-volume
          configMap:
            defaultMode: 420
            name: prometheus-server-conf

        - name: prometheus-storage-volume
          emptyDir: {}
kubectl apply -f prometheus-deployment.yaml -> kubectl get pod -n monitoring
NAME READY STATUS RESTARTS AGE
alertmanager-6d77489f7b-mf4wl 1/1 Running 1 (42m ago) 24h
grafana-68b7b49968-2629q 1/1 Running 1 (42m ago) 24h
node-exporter-gkfnl 1/1 Running 1 (42m ago) 23h
prometheus-deployment-67cf879cc4-gbns8 1/1 Running 1 (42m ago) 25h
-> kubectl exec -it prometheus-deployment-67cf879cc4-gbns8 -n monitoring ls /etc/prometheus
prometheus.rules prometheus.ymlConnecting To Prometheus Dashboard
You can view the deployed Prometheus dashboard in three different ways.
- Using Kubectl port forwarding
- Exposing the Prometheus deployment as a service with NodePort or a Load Balancer.
- Using Ingress.
Method 1:Using Kubectl port forwarding
Using prot forwarding means put port 8080 on the real machine to port 9090 on the container.Then you can enter http://localhost:8080 on your browser, you will get the Prometheus home page.
kubectl get pods --namespace=monitoring
NAME                                     READY   STATUS    RESTARTS        AGE
prometheus-deployment-67cf879cc4-gbns8   1/1     Running   2 (5m20s ago)   29h
kubectl port-forward prometheus-deployment-67cf879cc4-gbns8 8080:9090 -n monitoringMethod 2:Exposing Prometheus as a Service By NodePort
To access the Prometheus dashboard over a IP or a DNS name, you need to expose it as a Kubernetes service.Create a file named prometheus-service.yaml and copy the following contents. We will expose Prometheus on all kubernetes node IP’s on port 30000.
Once created, you can access the Prometheus dashboard using any of the Kubernetes node’s IP on port 30000. If you are on the cloud, make sure you have the right firewall rules to access port 30000 from your workstation.
apiVersion: v1
kind: Service
metadata:
  name: prometheus-service
  namespace: monitoring
  annotations:
      prometheus.io/scrape: 'true'
      prometheus.io/port:   '9090'

spec:
  selector:
    app: prometheus-server
  type: NodePort
  ports:
    - port: 8080
      targetPort: 9090
      nodePort: 30000
kubectl create -f prometheus-service.yaml --namespace=monitoring Then you can enter http://nodeIp:8080 on your browser(for me is http://192.168.1.100:8080), you will get the Prometheus home page.
Method 3: Exposing Prometheus Using Ingress
If you have an existing ingress controller setup, you can create an ingress object to route the Prometheus DNS to the Prometheus backend service.
Also, you can add SSL for Prometheus in the ingress layer. And,you can use the command `openssl` to create tls.crt and tls.key and replace it.
Then you can enter https://prometheus.example.com on your browser, you will get the Prometheus home page.
apiVersion: networking.k8s.io/v1
kind: Ingress
metadata:
  name: prometheus-ui
  namespace: monitoring
  annotations:
    kubernetes.io/ingress.class: nginx
spec:
  rules:
  # Use the host you used in your kubernetes Ingress Configurations
  - host: prometheus.example.com
    http:
      paths:
      - backend:
          service:
            name: prometheus-service
            port:
              number: 8080
        path: /
        pathType: Prefix
  tls:
  - hosts:
    - prometheus.apps.shaker242.lab
    secretName: prometheus-secret
---
apiVersion: v1
kind: Secret
metadata:
  name: prometheus-secret
  namespace: monitoring
data:
# USe base64 in the certs
  tls.crt: LS0tLS1CRUdJTiBDRVJUSUZJQ0FURS0tLS0tCk1JSUZpVENDQkhHZ0F3SUJBZ0lCQVRBTkJna3Foa2lHOXcwQkFRc0ZBRENCd0RFak1DRUdBMVVFQXhNYWFXNTAKWlhKdFpXUnBZWFJsTG5Ob1lXdGxjakkwTWk1c1lXSXhDekFKQmdOVkJBWVRBbFZUTVJFd0R3WURWUVFJRXdoVwphWEpuYVc1cFlURVFNQTRHQTFVRUJ4TUhRbkpwYzNSdmR6RXNNQ29HQTFVRUNoTWpVMGhCUzBWU01qUXlJRXhoCllpQkRaWEowYVdacFkyRjBaU0JCZFhSb2IzSnBkSGt4T1RBM0JnTlZCQXNUTUZOSVFVdEZVakkwTWlCTVlXSWcKU1c1MFpYSnRaV1JwWVhSbElFTmxjblJwWm1sallYUmxJRUYxZEdodmNtbDBlVEFlRncweE9URXdNVGN4TmpFMgpNekZhRncweU1URXdNVFl4TmpFMk16RmFNSUdBTVIwd0d3WURWUVFERkJRcUxtRndjSE11YzJoaGEyVnlNalF5CkxteGhZakVMTUFrR0ExVUVCaE1DVlZNeEVUQVBCZ05WQkFnVENGWnBjbWRwYm1saE1SQXdEZ1lEVlFRSEV3ZEMKY21semRHOTNNUll3RkFZRFZRUUtFdzFUU0VGTFJWSXlORElnVEdGaU1SVXdFd1lEVlFRTEV3eE1ZV0lnVjJWaQpjMmwwWlhNd2dnRWlNQTBHQ1NxR1NJYjNEUUVCQVFVQUE0SUJEd0F3Z2dFS0FvSUJBUURsRm16QVd0U09JcXZNCkpCV3Vuc0VIUmxraXozUmpSK0p1NTV0K0hCUG95YnZwVkJJeXMxZ3prby9INlkxa2Zxa1JCUzZZYVFHM2lYRFcKaDgzNlNWc3pNVUNVS3BtNXlZQXJRNzB4YlpPTXRJcjc1VEcrejFaRGJaeFUzbnh6RXdHdDN3U3c5OVJ0bjhWbgo5dEpTVXI0MHBHUytNemMzcnZOUFZRMjJoYTlhQTdGL2NVcGxtZUpkUnZEVnJ3Q012UklEcndXVEZjZkU3bUtxCjFSUkRxVDhETnlydlJmeUlubytmSkUxTmRuVEVMY0dTYVZlajhZVVFONHY0WFRnLzJncmxIN1pFT1VXNy9oYm8KUXh6NVllejVSam1wOWVPVUpvdVdmWk5FNEJBbGRZeVYxd2NPRXhRTmswck5BOU45ZXBjNWtUVVZQR3pOTWRucgovVXQxOWMweEFnTUJBQUdqZ2dIS01JSUJ4akFKQmdOVkhSTUVBakFBTUJFR0NXQ0dTQUdHK0VJQkFRUUVBd0lHClFEQUxCZ05WSFE4RUJBTUNCYUF3TXdZSllJWklBWWI0UWdFTkJDWVdKRTl3Wlc1VFUwd2dSMlZ1WlhKaGRHVmsKSUZObGNuWmxjaUJEWlhKMGFXWnBZMkYwWlRBZEJnTlZIUTRFRmdRVWRhYy94MTR6dXl3RVZPSi9vTjdQeU82bApDZ2N3Z2RzR0ExVWRJd1NCMHpDQjBJQVVzZFM1WWxuWEpWTk5mRVpkTEQvL2RyNE5mV3FoZ2JTa2diRXdnYTR4CkdUQVhCZ05WQkFNVEVHTmhMbk5vWVd0bGNqSTBNaTVzWVdJeEN6QUpCZ05WQkFZVEFsVlRNUkV3RHdZRFZRUUkKRXdoV2FYSm5hVzVwWVRFUU1BNEdBMVVFQnhNSFFuSnBjM1J2ZHpFc01Db0dBMVVFQ2hNalUwaEJTMFZTTWpReQpJRXhoWWlCRFpYSjBhV1pwWTJGMFpTQkJkWFJvYjNKcGRIa3hNVEF2QmdOVkJBc1RLRk5JUVV0RlVqSTBNaUJNCllXSWdVbTl2ZENCRFpYSjBhV1pwWTJGMFpTQkJkWFJvYjNKcGRIbUNBUUV3SFFZRFZSMGxCQll3RkFZSUt3WUIKQlFVSEF3RUdDQ3NHQVFVRkNBSUNNRWdHQTFVZEVRUkJNRCtDRFhOb1lXdGxjakkwTWk1c1lXS0NFbUZ3Y0hNdQpjMmhoYTJWeU1qUXlMbXhoWW9JVUtpNWhjSEJ6TG5Ob1lXdGxjakkwTWk1c1lXS0hCTUNvQ3hBd0RRWUpLb1pJCmh2Y05BUUVMQlFBRGdnRUJBRzA3ZHFNdFZYdVQrckduQlN4SkVTNjNSa2pHaWd0c3ZtNTk4NSsrbjZjRW5kSDIKb2hjaGdmRUo5V0UxYUFWSDR4QlJSdVRIUFVJOFcvd3N1OFBxQ1o4NHpRQ2U2elAyeThEcmEwbjFzK2lIeHFwRAorS3BwZS91NkNLVTFEL0VWRU9MakpZd3pRYlFLSUlPL2Y1Q0JVbUpGWjBuZ1VIUEtvUDNyTXordTlBOWFvRkVrCnF3dDBadHFHcWpjMkh3Q09UOTlOVmFsZ29ISXljOElxQXJXdjNSWklraUlyaW9kSUdDMS94MVQ2dHhKcEUyRisKQzZ0Tzk0U0FVSUJwc2VORjNFbGNLNUsyTW44YVAzR3NnNFRHeElPN2Q1eUIvb3YwNGhOV2Q1S2QwWGorL1BvQgpLOU43cFQ1SVU2citLekNoeGlSdmRvZlAzV0VYN1ZkNEtLWG94K0U9Ci0tLS0tRU5EIENFUlRJRklDQVRFLS0tLS0K
  tls.key: LS0tLS1CRUdJTiBQUklWQVRFIEtFWS0tLS0tCk1JSUV2d0lCQURBTkJna3Foa2lHOXcwQkFRRUZBQVNDQktrd2dnU2xBZ0VBQW9JQkFRRGxGbXpBV3RTT0lxdk0KSkJXdW5zRUhSbGtpejNSalIrSnU1NXQrSEJQb3lidnBWQkl5czFnemtvL0g2WTFrZnFrUkJTNllhUUczaVhEVwpoODM2U1Zzek1VQ1VLcG01eVlBclE3MHhiWk9NdElyNzVURyt6MVpEYlp4VTNueHpFd0d0M3dTdzk5UnRuOFZuCjl0SlNVcjQwcEdTK016YzNydk5QVlEyMmhhOWFBN0YvY1VwbG1lSmRSdkRWcndDTXZSSURyd1dURmNmRTdtS3EKMVJSRHFUOEROeXJ2UmZ5SW5vK2ZKRTFOZG5URUxjR1NhVmVqOFlVUU40djRYVGcvMmdybEg3WkVPVVc3L2hibwpReHo1WWV6NVJqbXA5ZU9VSm91V2ZaTkU0QkFsZFl5VjF3Y09FeFFOazByTkE5TjllcGM1a1RVVlBHek5NZG5yCi9VdDE5YzB4QWdNQkFBRUNnZ0VCQU5zOHRjRDBiQnpHZzRFdk8yek0wMUJoKzZYN3daZk4wSjV3bW5kNjZYYkwKc1VEZ1N6WW9PbzNJZ2o5QWZTY2lyQ3YwdUozMVNFWmNpeGRVQ2tTdjlVNnRvTzdyUWdqeUZPM1N1dm5Wc3ZKaQpTZXc5Y0hqNk5jVDczak8rWkgxQVFFZ2tlWG5mQTNZU0JEcTFsSnhpUVZOaHpHUFY0Yzh4Wi9xUkhEbUVBTWR6CmwyaTB6dHJtcWRqSng4aTQxOXpGL1pVektoa2JtcVZVb3JjZ1lNdEt5QVloSENMYms2RFZtQ1FhbDlndEUrNjUKTmFTOEwxUW9yVWNVS0FoSTNKT2Q2TTRwbWRPaExITjZpZ0VwWFdVWGxBZjRITUZicHd5M1oxejNqZzVqTE9ragp6SWNDSVRaai9CYVZvSVc4QzJUb0pieUJKWkN6UDVjUVJTdkJOOGV4aUFFQ2dZRUEvV0Nxb2xVUWtOQkQrSnlPCklXOUJIRVlPS3oxRFZxNWxHRFhoNFMyTStpOU1pck5nUlcvL0NFRGhRUVVMZmtBTDgxMERPQmxsMXRRRUpGK3cKb1V6dWt6U1lkK1hTSnhicTM5YTF1ZGJldTNZU1ljeC8wTEEweGFQOW1sN1l1NXUraUZ4NGhwcnYyL2UrVklZQQpzTWV4WkZSODA3Q3M5YXN5MkdFT1l2aEdKb0VDZ1lFQTUzVm1weFlQbDFOYTVTMElJbEpuYm40dTl0RHpwYm5TCnpsMjBVQ3Q0d0N4STR6YjY1S1o4V1VaYlFzVTVaZ0VqTmxJWURXUisrd3kwVXh2SmNxUG5nS0xuOEdoSzhvOVEKeVJuR2dSYXAxWmNuUEdsbGdCeHQzM0s5TDNWMmJzMXBPcGJKMGlpOVdySWM4MU1wUVFpQjZ1RDRSZ216M0ZWSQpnUk5Ec2ZHS0xyRUNnWUVBbWY5ZXRqc3RUbGJHZVJ2dDVyUlB4bmR0dFNvTysyZ1RXWnVtSmM0aG1RMldYOWFWCjlKNFZTMWJqa1RrWHV5d0NGMis0dlNmeWxaZFd6U1M3bmMyOFV3dnNmekxYZjVxV05tV3hIYnBTdFcwVnp3c1QKeENyVWFDczd2ODlWdXZEMTVMc1BKZ0NWT0FSalVjd0FMM0d2aDJNeVd4ZE9pQ0g5VFRYd0lJYjFYQUVDZ1lBMwp4ZUptZ0xwaERJVHFsRjlSWmVubWhpRnErQTY5OEhrTG9TakI2TGZBRnV1NVZKWkFZcDIwSlcvNE51NE4xbGhWCnpwSmRKOG94Vkc1ZldHTENiUnhyc3RXUTZKQ213a0lGTTJEUjJsUXlVNm53dExUd21la2YzdFlYaVlad1RLNysKbnpjaW5RNkR2RWVkbW54bVgxWnU4cWJndVpYTmtmOVdtdjNFOHg4SkFRS0JnUUNNeDFWNHJIcUpwVXJMdkRVVQo4RzhXVGNrT2VFM2o2anhlcHMwcnExdEd1cE9XWW5saFlNYyt5VkMzMDZUc2dXUmJ5R1Y4YWNaRkF4WS9Ub2N5CmxpcXlUS1NGNUloYXhZQVpRTzVkOU1oTmN0bTRReDNaOUtTekZ5ZG01QlZVL0grMFFmUnRwM29TeFVneXRZNXkKV3ZDTFZ5bmNGZlZpL0VkaTdaZHM2aW82QVE9PQotLS0tLUVORCBQUklWQVRFIEtFWS0tLS0tCg==
kubectl apply -f prometheus-ingress.yaml
In this guide,i recommend you use method 2 to access dashborad home page.It's easy to setup.
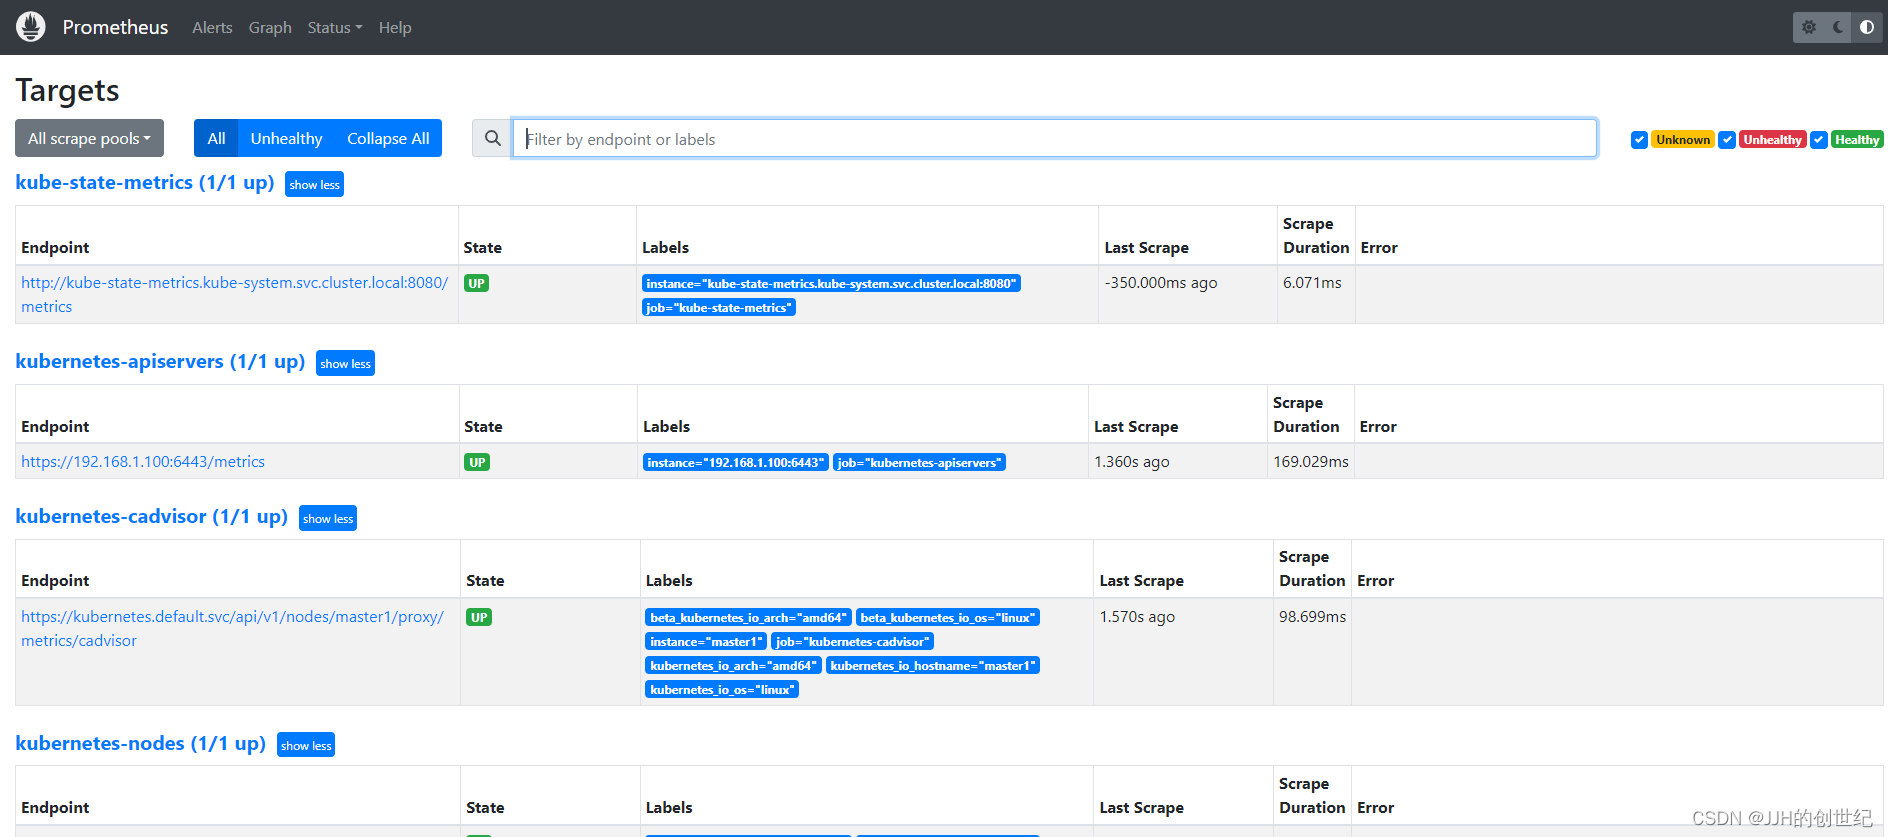
Now if you browse to status --> Targets, you will see all the Kubernetes endpoints connected to Prometheus automatically using service discovery as shown below.And you can see the heathy status of Endpoints.
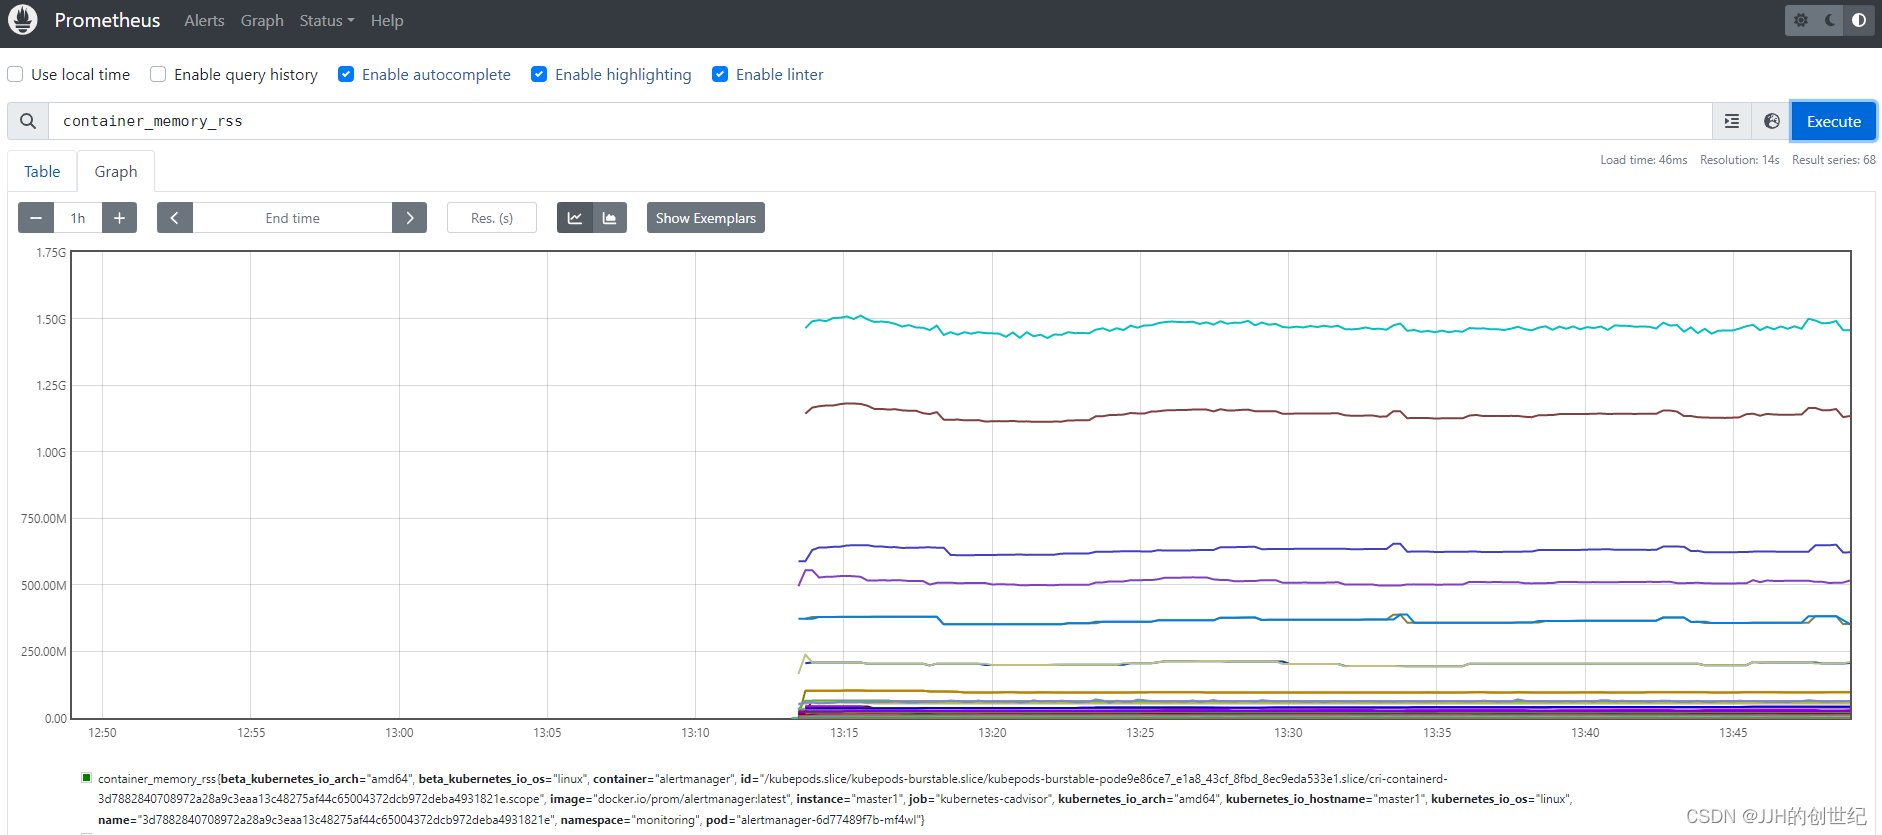
Or you browse to Graph and enter `container_memory_rss` you'll see the memory used infos of your Nodes.
Install Kube State Metrics
Kube state metrics is a service that talks to the Kubernetes API server to get all the details about all the API objects like deployments, pods, daemonsets, Statefulsets, etc.Kube state metrics service exposes all the metrics on /metrics URI. Prometheus can scrape all the metrics exposed by Kube state metrics.
Following are some of the important metrics you can get from Kube state metrics.
- Node status, Node capacity (CPU and memory)
- Replica-set status (desired,available,unavailable,updated,etc)
- Pod status (waiting, running, ready, etc)
- Ingress metrics
- PV, PVC metrics
- Daemonset & Statefulset metrics.
- Resource requests and limits.
- Job & Cronjob metrics
- more metrics
Install
You will have to deploy the following Kubernetes objects for Kube state metrics to work.
- A Service Account
- Cluster Role – For kube state metrics to access all the Kubernetes API objects.
- Cluster Role Binding – Binds the service account with the cluster role.
- Kube State Metrics Deployment
- Service – To expose the metrics
All the above Kube state metrics objects will be deployed in the kube-system namespace
Let’s deploy the components. It's esay to deploy,you don't need change any files just run `kubectl apply`.
tree kubernetes-state-metrics/
kubernetes-state-metrics/
├── cluster-role-binding.yaml
├── cluster-role.yaml
├── deployment.yaml
├── service-account.yaml
└── service.yaml
kubectl apply -f kubernetes-state-metrics/kubectl get deployments kube-state-metrics -n kube-system
NAME READY UP-TO-DATE AVAILABLE AGE
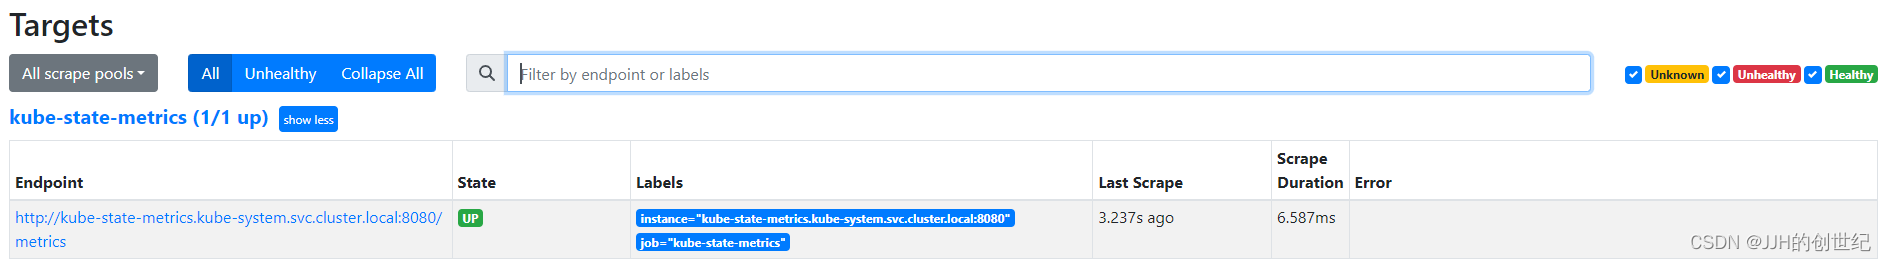
kube-state-metrics 1/1 1 1 29hKube state metrics can be added as part of the Prometheus. You need to add a job configuration to your Prometheus config for Prometheus to scrape all the Kube state metrics. If you have followed my prometheus guide, you don't have to add this scrape config. It is already setted in Promethues config file(as bellow).
  - job_name: 'kube-state-metrics'
        static_configs:
          - targets: ['kube-state-metrics.kube-system.svc.cluster.local:8080']
You can see the target status “up” after deploying kube state metrics.
Or you can do this do check all metrics.
kubectl run curl --image=radial/busyboxplus:curl -i --tty --rm
-> curl http://kube-state-metrics.kube-system.svc.cluster.local:8080/metrics
Install Up Alertmanager
AlertManager is an open-source alerting system that works with the Prometheus Monitoring system. And it handles all the alerting mechanisms for Prometheus metrics. There are many integrations available to receive alerts from the Alertmanager (Slack, email, API endpoints, etc)
Install
Alert Manager setup has the following key configurations.
- A config map for AlertManager configuration
- A config Map for AlertManager alert templates
- Alert Manager Kubernetes Deployment
- Alert Manager service to access the web UI.
tree kubernetes-alert-manager/
kubernetes-alert-manager/
├── alertManagerConfigMap.yaml
├── alertTemplateConfigMap.yaml
├── deployment.yaml
└── service.yaml
Prometheus should have the correct alert manager service endpoint in `kubernetes-prometheus-configs-main/kubernetes-prometheus/config-map.yaml `as shown below to send the alert to Alert Manager.
alerting:
   alertmanagers:
      - scheme: http
        static_configs:
        - targets:
- "alertmanager.monitoring.svc:9093" All the alerting rules have to be setted on Prometheus config based on your needs. It should be created as part of the Prometheus config map with a file named prometheus.rules and added to the config.yaml in the following way.
rule_files:
      - /etc/prometheus/prometheus.rules
For receiving emails for alerts, you need to have a valid SMTP host in the alert manager file `alertManagerConfigMap.yaml`. You can customize the email template as per your needs in the Alert Template config map. We have given the generic template in this guide.
receivers:
    - name: alert-emailer
      email_configs:
      - to: demo@devopscube.com
        send_resolved: false
        from: from-email@email.com
        smarthost: smtp.eample.com:25
        require_tls: false
    - name: slack_demo
      slack_configs:
      - api_url: https://hooks.slack.com/services/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sz4Qk
        channel: '#devopscube-demo'
We expose the alertmanager deployment as a service with NodePort,and the port is 31000.
apiVersion: v1
kind: Service
metadata:
  name: alertmanager
  namespace: monitoring
  annotations:
      prometheus.io/scrape: 'true'
      prometheus.io/port:   '9093'
spec:
  selector:
    app: alertmanager
  type: NodePort
  ports:
    - port: 9093
      targetPort: 9093
      nodePort: 31000
Let’s get started with the setup.Just like the method to install Kube state metrics,we use `kubectl apply` to setup all files.
kubectl apply -f kubernetes-alert-manager/kubectl get deployments -n monitoring alertmanager
NAME READY UP-TO-DATE AVAILABLE AGE
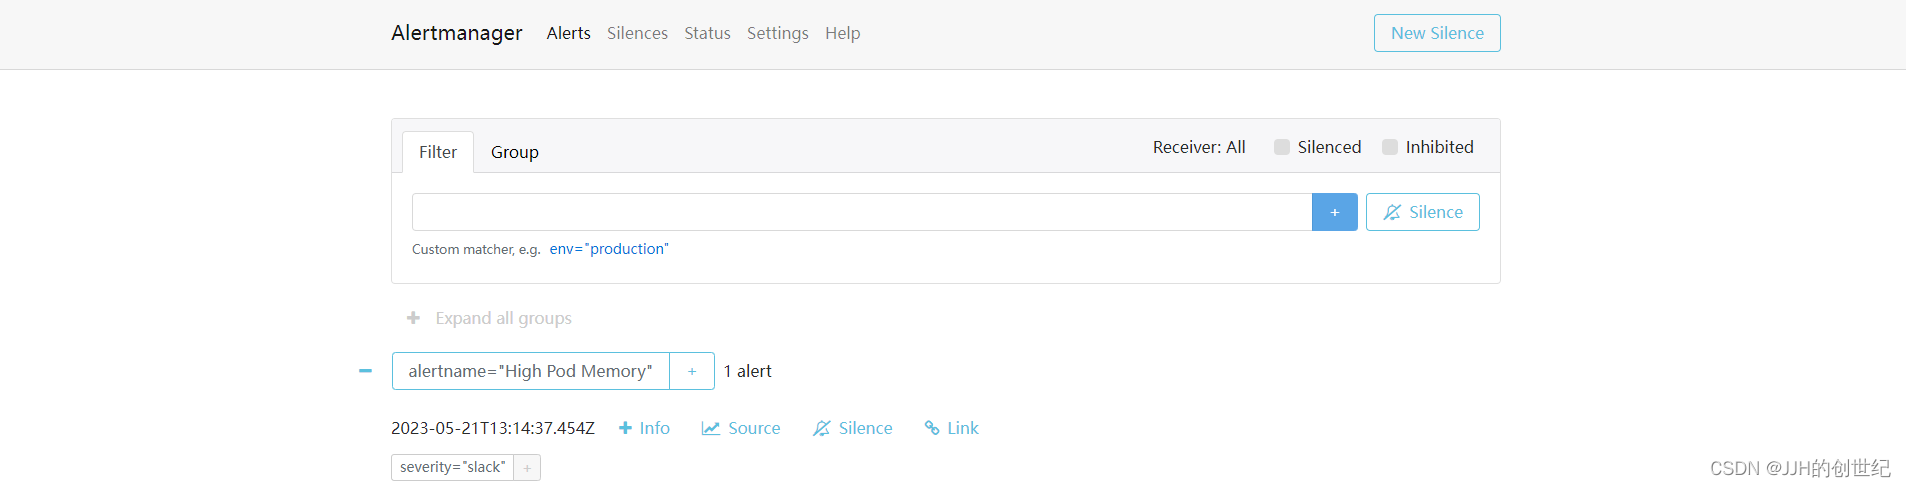
alertmanager 1/1 1 1 30hClick button Alter to show alter message,my failure was because I didn't set the correct email or slack info in config.yaml.
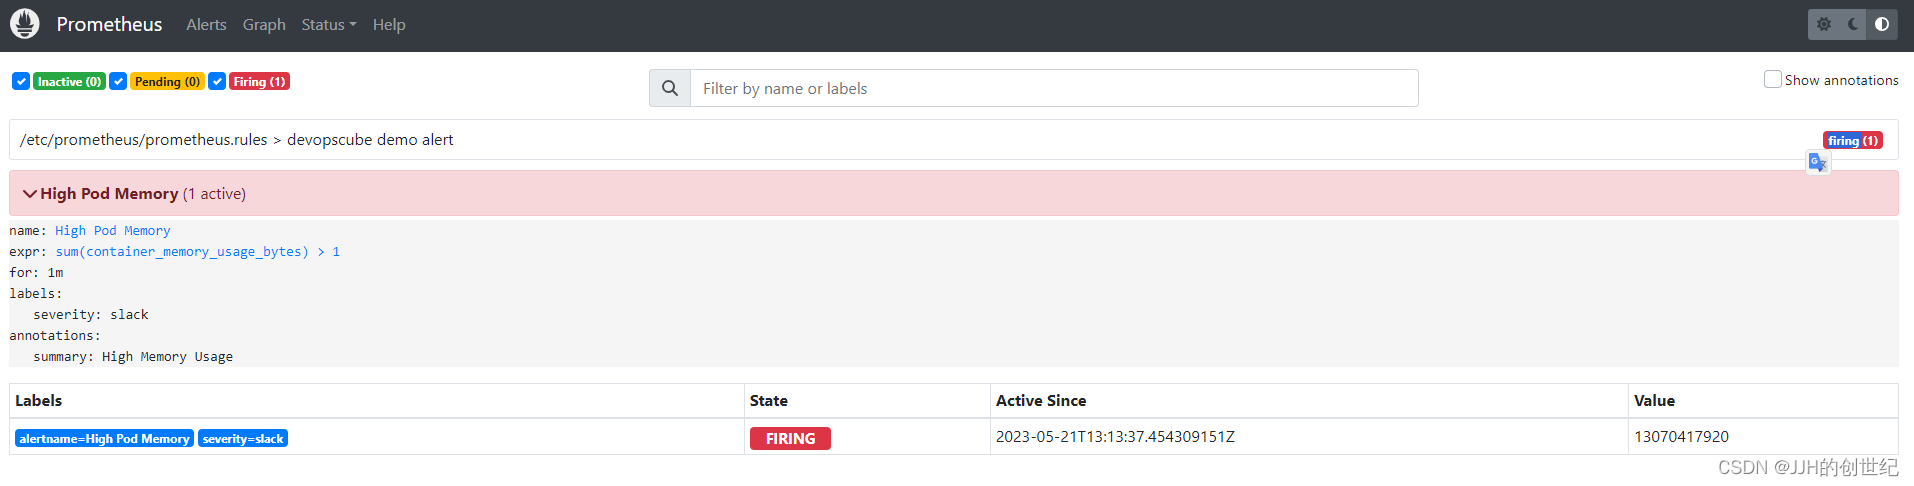
Then you can enter http://nodeIP:31000(mine is http://192.168.1.100:31000) on your browser, you will get the alertManager home page.We just set one alert rule for memory,if you want add more,you can customize the prometheus.rules.
Install Up Grafana
Grafana is an open-source lightweight dashboard tool. It can be integrated with data sources like Prometheus.Using Grafana you can create dashboards from Prometheus metrics to monitor the kubernetes cluster.
The best part is, you don’t have to write all the PromQL queries for the dashboards. There are many community dashboard templates available for Kubernetes. You can import it and modify it as per your needs.
Install
- A datasourcecs from prometheus
- A Grafana server Deployment
- Alert Grafana service to access the web UI.
tree kubernetes-grafana/
kubernetes-grafana/
├── deployment.yaml
├── grafana-datasources-config
└── service.yaml
The following data source configuration is for Prometheus. We could create it by .yaml file or grafana web page.
apiVersion: v1
kind: ConfigMap
metadata:
  name: grafana-datasources
  namespace: monitoring
data:
  prometheus.yaml: |-
    {
        "apiVersion": 1,
        "datasources": [
            {
               "access":"proxy",
                "editable": true,
                "name": "prometheus",
                "orgId": 1,
                "type": "prometheus",
                "url": "http://prometheus-service.monitoring.svc:8080",
                "version": 1
            }
        ]
    }
With deployment.yaml file ,the configuration of volumes,this Grafana deployment does not use a persistent volume. If you restart the pod all changes will be gone.You can persist it by NFS, Local volumes,etc.
  volumes:
        - name: grafana-storage
          emptyDir: {}
        - name: grafana-datasources
          configMap:
              defaultMode: 420
              name: grafana-datasources
We expose the grafana deployment as a service with NodePort,and the port is 32000.
apiVersion: v1
kind: Service
metadata:
  name: grafana
  namespace: monitoring
  annotations:
      prometheus.io/scrape: 'true'
      prometheus.io/port:   '3000'
spec:
  selector:
    app: grafana
  type: NodePort
  ports:
    - port: 3000
      targetPort: 3000
      nodePort: 32000
kubectl apply -f kubernetes-grafana/kubectl get deployments -n monitoring grafana
NAME READY UP-TO-DATE AVAILABLE AGE
grafana 1/1 1 1 40hCreate Kubernetes Dashboards on Grafana
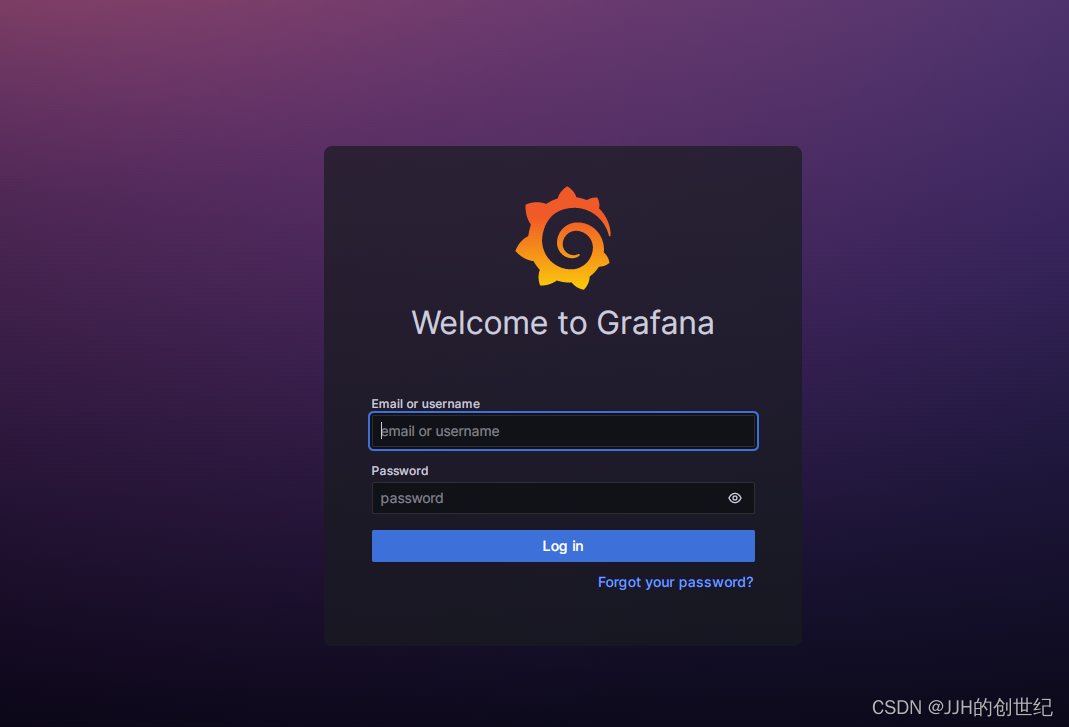
Enter 'http://NodeIP:32000'(for me is http://192.168.1.100:32000) on browser to login.
Use the following default username and password to log in. Once you log in with default credentials, it will prompt you to change the default password.
admin
admin
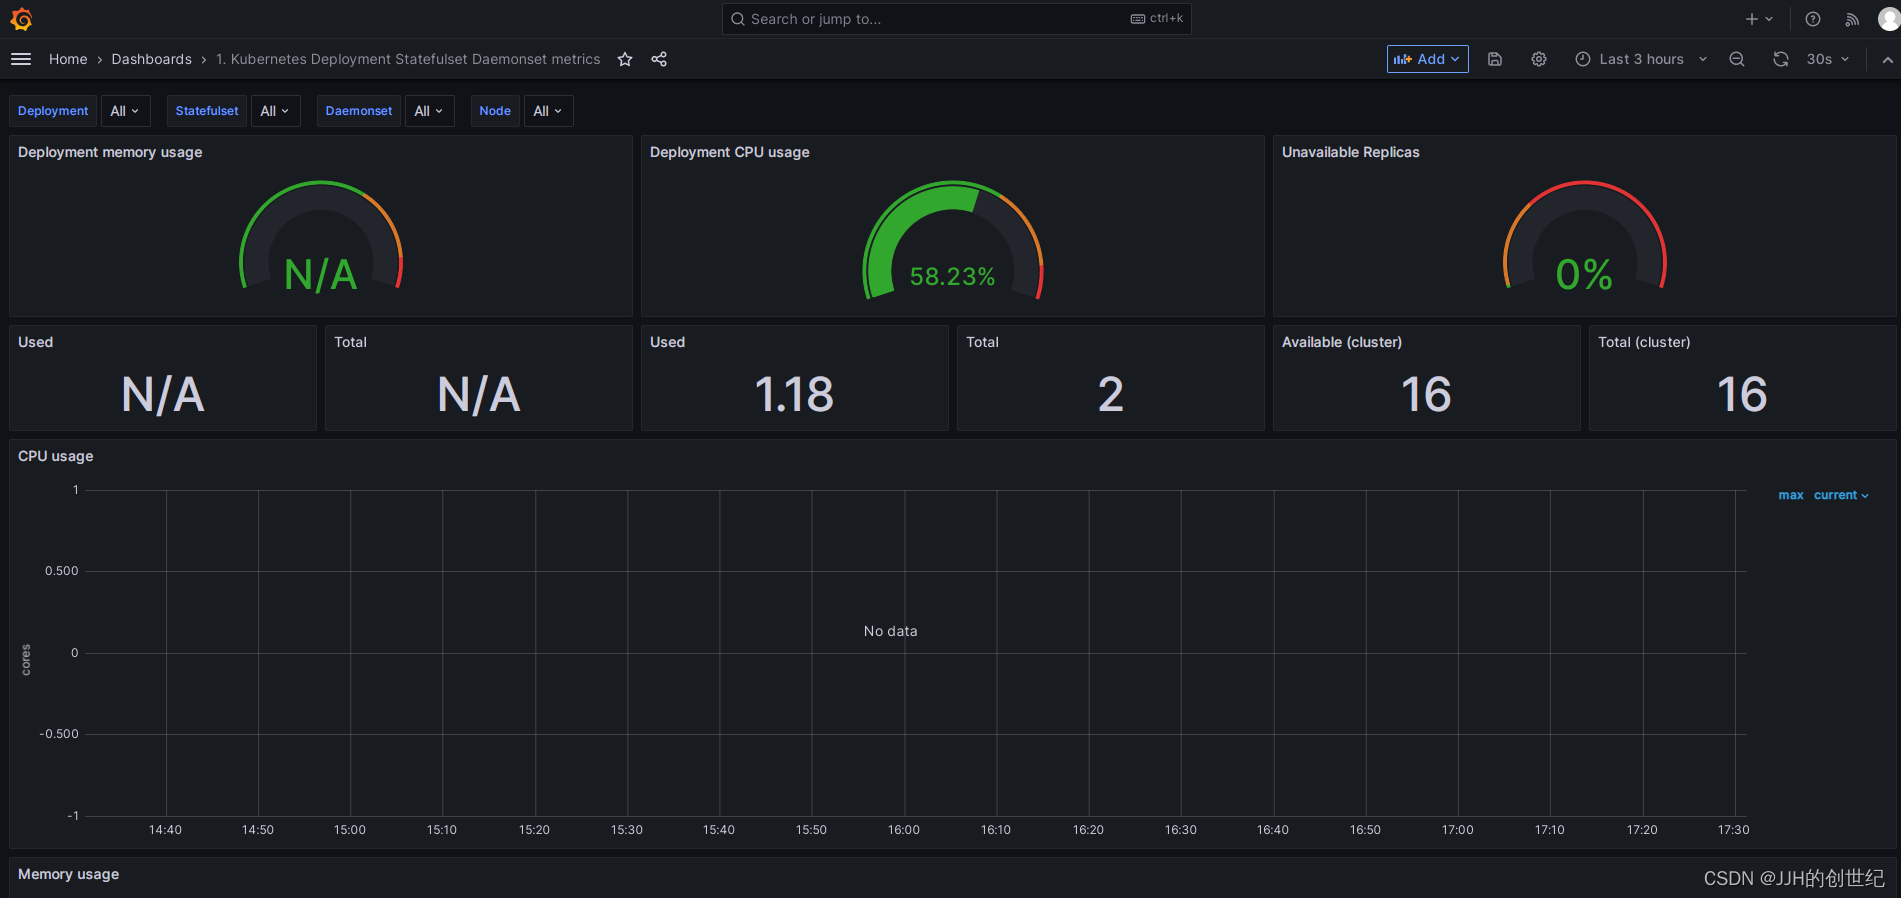
Creating a Kubernetes dashboard from the Grafana template is pretty easy. There are many prebuilt Grafana templates available for Kubernetes. You can easily have prebuilt dashboards for ingress controllers, volumes, API servers, Prometheus metrics, and much more.
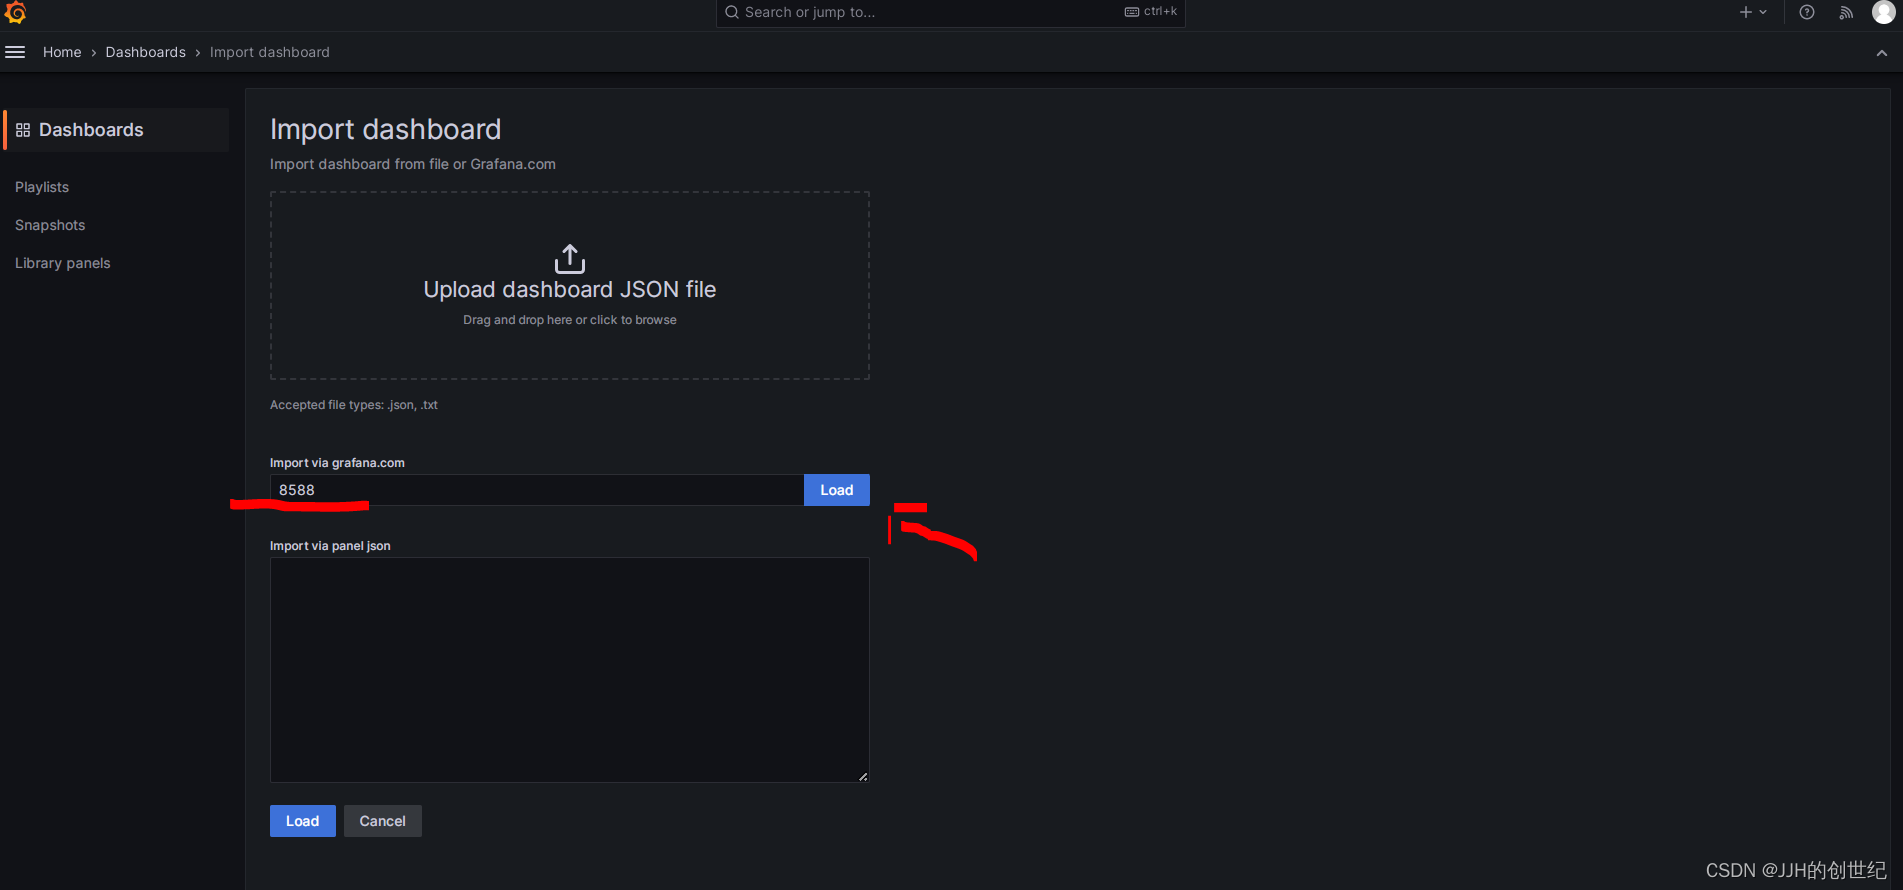
You can get the template ID from Dashboards | Grafana Labs.This is page has ample of standards template of dashboard.
After logining in,following below photos to import a standard template of dashboard.Here we try to import the template with ID is '8588'.


Install Up Node Exporter
Node exporter is an official Prometheus exporter for capturing all the Linux system-related metrics.It collects all the hardware and Operating System level metrics that are exposed by the kernel. By default, most of the Kubernetes clusters expose the metric server metrics (Cluster level metrics from the summary API) and Cadvisor (Container level metrics). It does not provide detailed node-level metrics.
To get all the kubernetes node-level system metrics, you need to have a node-exporter running in all the kubernetes nodes. It collects all the Linux system metrics and exposes them via /metrics endpoint on port 9100.
Similarly, you need to install Kube state metrics to get all the metrics related to kubernetes objects.
Here is what we are going to do.
- Deploy node exporter on all the Kubernetes nodes as a
daemonset. Daemonset makes sure one instance of node-exporter is running in all the nodes. It exposes all the node metrics on port9100on the/metricsendpoint - Create a service that listens on port
9100and points to all the daemonset node exporter pods. We would be monitoring the service endpoints (Node exporter pods) from Prometheus using the endpoint job config. More explanation on this in the Prometheus config part.
Lest get started with the setup.
Install
Just Two files:
- A daemonset:Deploy node exporter on all the Kubernetes nodes as a
daemonset. A daemonset make sure one instance of node-exporter is running in all the nodes and exposes all the node metrics on port9100. - A service:Create a service that listens on port
9100.And this service will points to all the daemonset node exporter pods as endpoints.
kubernetes-node-exporter/
├── daemonset.yaml
└── service.yaml
kubectl apply -f kubernetes-node-exporter/kubectl get endpoints node-exporter -n monitoring
NAME ENDPOINTS AGE
node-exporter 10.244.137.120:9100,10.244.136.155:9100,10.244.131.22:9100, 40hThe scrape config for node-exporter is part of the Prometheus config map. Once you deploy the node-exporter, you should see node-exporter targets and metrics in Prometheus.

Querying Node-exporter Metrics in Prometheus
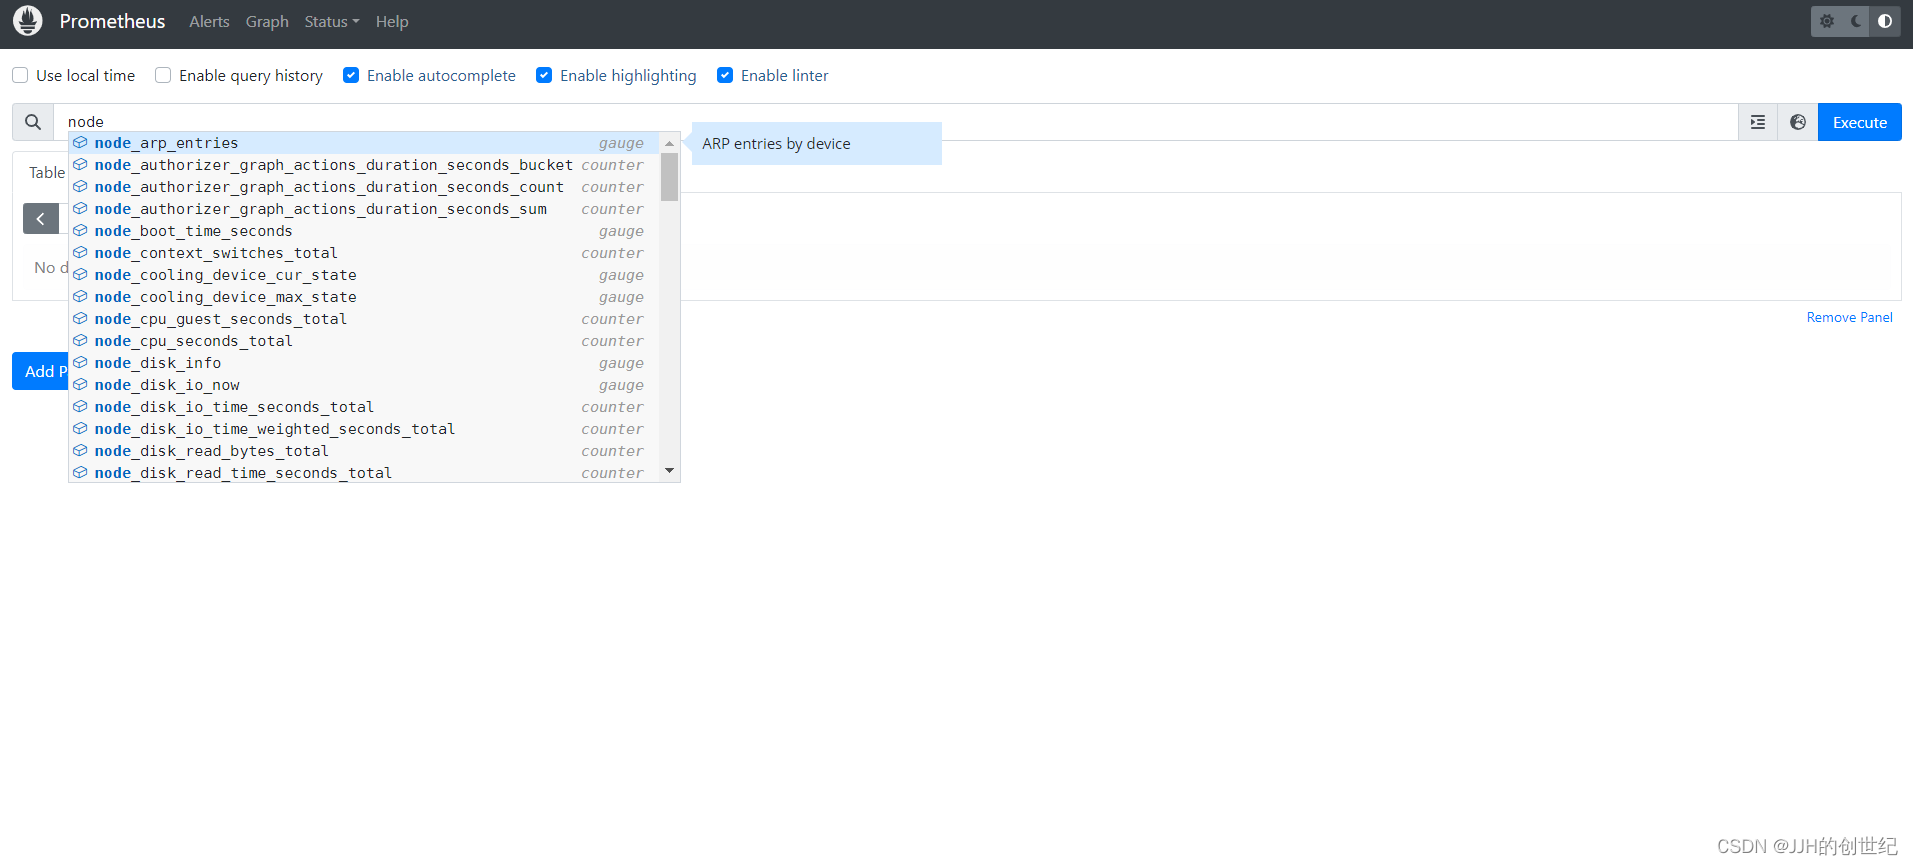
Once you verify the node-exporter target state in Prometheus, you can query the Prometheus dashboard’s available node-exporter metrics.
All the metrics from node-exporter is prefixed with node_,You can query the metrics with different PromQL expressions.
Visualizing Prometheus Node Exporter Metrics as Grafana Dashboards
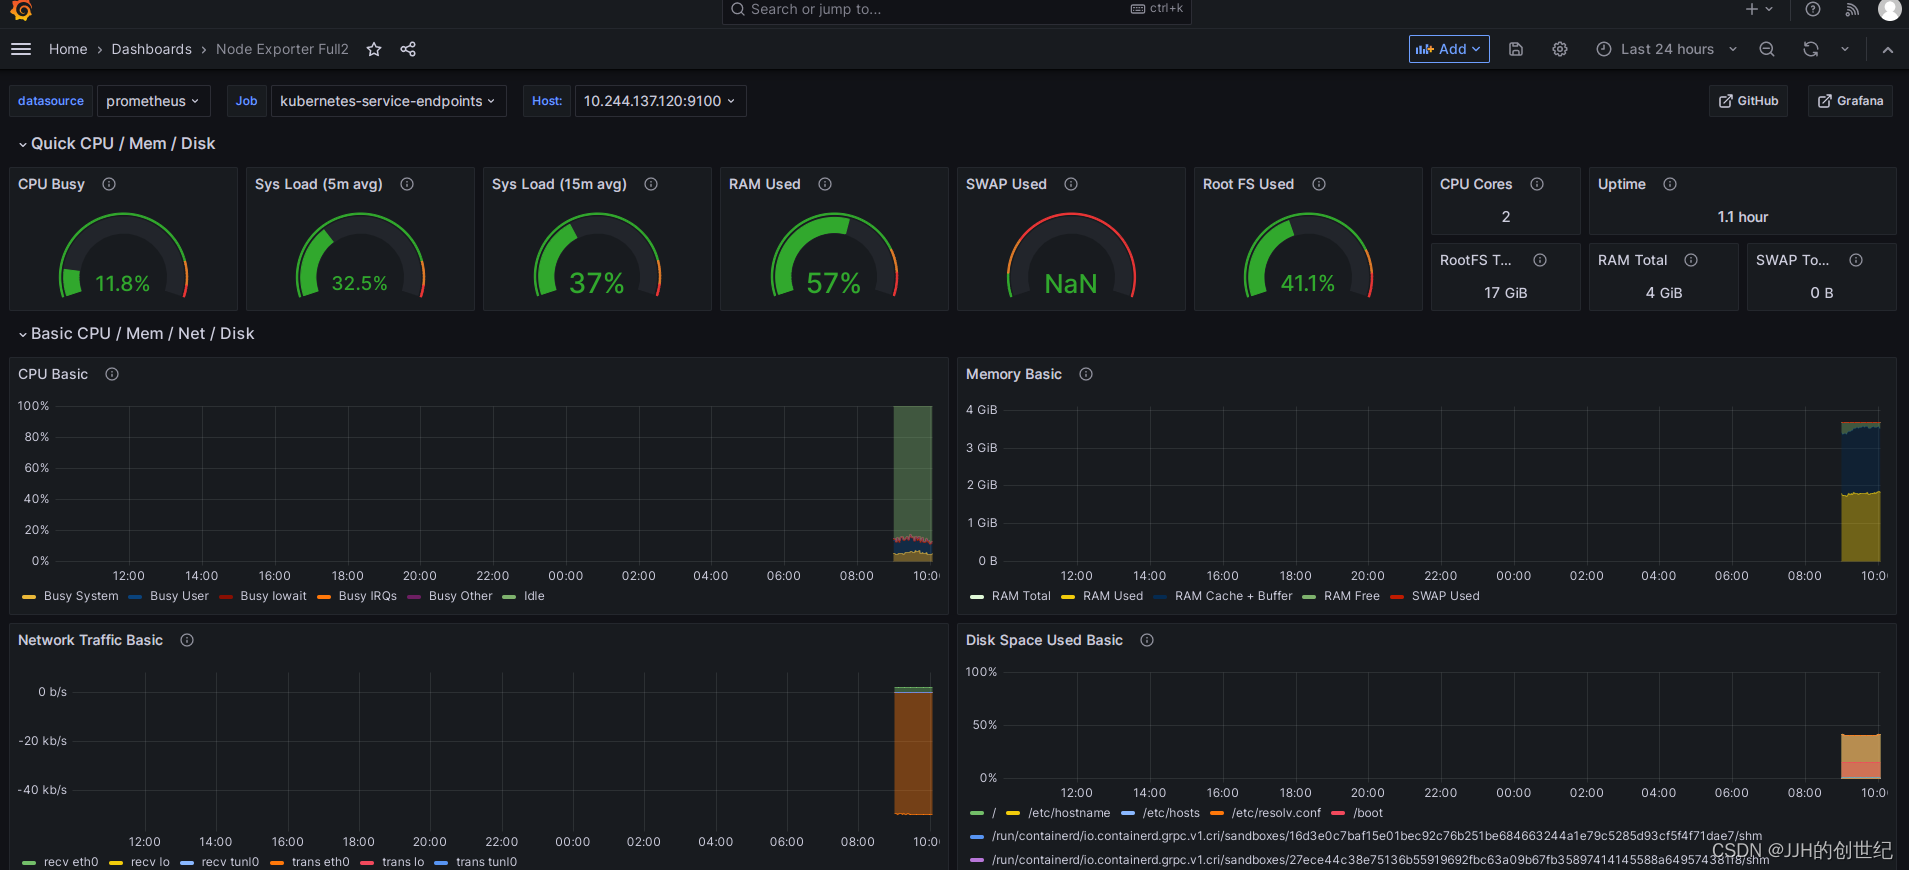
Visualising the node exporter metrics on Grafana is not difficult as you think.So here is how the node-exporter Grafana dashboard looks for CPU/memory and disk statistics.
The Template ID is 1860.
参考文档
k8s--普通k8s集群---使用rolebinding限制或增加访问命名空间以及可执行操作权限_k8s rolebinding_张小凡vip的博客-CSDN博客
k8s--job 控制器_行走在这人世间的 tester的技术博客_51CTO博客
Jobs | Kubernetes
prometheus理论+实践(1)_scrape_config_郝1.的博客-CSDN博客
Exporters and integrations | Prometheus
Querying basics | Prometheus
https://github.com/kubernetes/kube-state-metrics
Kubernetes Kube-state-metrics_富士康质检员张全蛋的博客-CSDN博客
k8s之containerPort、servicePort、nodePort、hostPort解析_k8s容器端口和服务端口_行者7786的博客-CSDN博客