文章目录
- 案例背景
- 线性回归(Loss Regression)
- 梯度下降法(批量梯度下降算法——batch gradient descent)
- 计算成本函数和梯度下降
- 使用线性回归拟合训练数据
- 模型预测
- 梯度下降效果可视化
- 完整版demo
案例背景
详情参照吴恩达机器学习课程的Exercise1,网络上有jupyter notebook版本和.py版本,本文使用.py版本在pycharm环境中调试运行。
给定拥有不同规模人口的城市(万人规模)对应的利润数据,通过线性回归模型预测某城市指定人口规模下的利润。
import numpy as np
import matplotlib.pylab as plt

def plotData(x, y):
    plt.plot(x, y, 'r.', ms=8)
    plt.xlabel('Population of City in 10,000')
    plt.ylabel('Profit in $10,000')
    plt.show()


data = np.loadtxt('ex1data1.txt', delimiter=',')
X = data[:, 0]
Y = data[:, 1]
m = np.size(Y, 0)
plotData(X, Y)

线性回归(Loss Regression)
线性回归的计算过程一般分为以下几步:
数据预处理:包括数据清洗、特征选择、特征缩放等。
模型选择:选择适合数据的线性回归模型。
模型训练:使用训练数据对模型进行训练,得到模型参数。
模型评估:使用测试数据对模型进行评估,得到模型的性能指标。
模型应用:使用训练好的模型进行预测或分类等任务。
线性回归具体是通过最小化预测值与实际值之间的误差(成本函数)来训练的。
具体来说,我们使用训练数据集来拟合一个线性方程,使得预测值与实际值之间的平均误差最小化。这个过程可以使用梯度下降法等优化算法来实现。在训练完成后,我们可以使用该模型来预测新的数据点的输出值。
梯度下降法(批量梯度下降算法——batch gradient descent)
批量梯度下降算法是一种非常常用的优化算法,用于训练机器学习模型。它通过计算损失函数对模型参数的梯度来更新参数,从而使得模型的预测结果更加准确。批量梯度下降算法的“批量(batch)”指的是每次更新参数时使用的样本数量,通常是整个训练集。
除了批量梯度下降算法之外,还有小批梯度下降 (Mini-Batch GD),随机梯度下降 (Stochastic GD)等优化算法。
相比于随机梯度下降算法,批量梯度下降算法的计算量更大,但是可以收敛到全局最优解。
计算成本函数和梯度下降
定义cost function为:
 其中线性模型
h
θ
(
x
)
h_\theta(x)
hθ(x)为:

python代码实现:
def computeCost(x, y, theta):
    ly = np.size(y, 0)
    cost = (x.dot(theta)-y).dot(x.dot(theta)-y)/(2*ly)
    return cost
对成本函数求
θ
\theta
θ的偏导得梯度下降计算过程:

其中
α
\alpha
α代表学习率,学习率代表着每一次梯度下降计算时的步长,如果设置得不合理,很有可能陷入局部极值点,而非最优点。比如当
α
\alpha
α取0时,就不存在梯度下降了,
θ
\theta
θ任意时刻一直卡着不动没有变化。
python代码实现:
def gradientDescent(x, y, theta, alpha, num_iters):
    m = np.size(y, 0)
    j_history = np.zeros((num_iters,))

    for i in range(num_iters):
        deltaJ = x.T.dot(x.dot(theta)-y)/m
        theta = theta-alpha*deltaJ
        j_history[i] = computeCost(x, y, theta)
    return theta, j_history
使用线性回归拟合训练数据
梯度的方向即函数值增加最快的方向,梯度的反方向就是下降最快的方向,梯度下降法就是基于此原理的一种优化方法。
关于梯度方向的问题,其实就是一个规定,也可以从高等数学中多元函数沿任意方向变化快慢的公式定义出发去理解,具体可参考下面这段文字:

data = np.loadtxt('ex1data1.txt', delimiter=',')
X = data[:, 0]
Y = data[:, 1]
X = np.vstack((np.ones((m,)), X)).T  #合并为一个矩阵并转置
theta = np.zeros((2,))   # 初始化参数

iterations = 1500  #迭代层数
alpha = 0.01  #学习率

J = computeCost(X, Y, theta)  #计算成本函数
print(J)

theta, j_history = gradientDescent(X, Y, theta, alpha, iterations)
print('Theta found by gradient descent: ', theta)

plt.plot(X[:, 1], Y, 'r.', ms=8, label='Training data')
plt.plot(X[:, 1], X.dot(theta), '-', label='Linear regression')
plt.xlabel('Population of City in 10,000')
plt.ylabel('Profit in $10,000')
plt.legend(loc='upper right')
plt.show()
模型预测
35000和70000人口规模的预测值:
predict1 = np.array([1, 3.5]).dot(theta)
print('For population = 35,000, we predict a profit of ', predict1 * 10000)
predict2 = np.array([1, 7.0]).dot(theta)
print('For population = 70,000, we predict a profit of ', predict2 * 10000)

X1 = np.vstack((X, [[1, 35], [1, 70]]))
X_tmp = X.dot(theta)

Y1 = np.append(Y, [[predict1 * 10000],[predict2 * 10000]])
plt.plot(X1[:, 1], Y1, 'r.', ms=8, label='Training data')
plt.plot(X[:, 1], Y, '-', label='Linear regression')
plt.plot(35, predict1 * 10000, 'gx', ms=10)
plt.plot(70, predict2 * 10000, 'gx', ms=10)
plt.xlabel('Population of City in 10,000')
plt.ylabel('Profit in $10,000')
plt.legend(loc='upper left')
plt.show()

For population = 35,000, we predict a profit of  4519.7678677017675
For population = 70,000, we predict a profit of  45342.45012944714

梯度下降效果可视化
from mpl_toolkits.mplot3d import Axes3D
import numpy as np
import matplotlib.pylab as plt

data = np.loadtxt('ex1data1.txt', delimiter=',')
X = data[:, 0]
Y = data[:, 1]
m = np.size(Y, 0)

def computeCost(x, y, theta):
    ly = np.size(y, 0)
    cost = (x.dot(theta) - y).dot(x.dot(theta) - y) / (2 * ly)
    return cost

X = np.vstack((np.ones((m,)), X)).T  # 合并为一个矩阵并转置
theta = np.zeros((2,))  # 初始化参数
iterations = 1500  # 迭代层数
alpha = 0.01  # 学习率

J = computeCost(X, Y, theta)  # 计算成本函数
print(J)

print('Visualizing J(theta_0, theta_1) ...')
theta0_vals = np.linspace(-10, 10, 100)
theta1_vals = np.linspace(-1, 4, 100)

J_vals = np.zeros((np.size(theta0_vals, 0), np.size(theta1_vals, 0)))

for i in range(np.size(theta0_vals, 0)):
    for j in range(np.size(theta1_vals, 0)):
        t = np.array([theta0_vals[i], theta1_vals[j]])
        J_vals[i, j] = computeCost(X, Y, t)

# 绘制三维图像
theta0_vals, theta1_vals = np.meshgrid(theta0_vals, theta1_vals)
fig = plt.figure()
ax = fig.add_axes(Axes3D(fig))
ax.plot_surface(theta0_vals, theta1_vals, J_vals.T)
ax.set_xlabel(r'$\theta$0')
ax.set_ylabel(r'$\theta$1')

# 绘制等高线图
fig2 = plt.figure()
ax2 = fig2.add_subplot(111)
ax2.contour(theta0_vals, theta1_vals, J_vals.T, np.logspace(-2, 3, 20))
ax2.plot(theta[0], theta[1], 'rx', ms=10, lw=2)
ax2.set_xlabel(r'$\theta$0')
ax2.set_ylabel(r'$\theta$1')
plt.show()
以线性模型
h
θ
(
x
)
h_\theta(x)
hθ(x)中的
θ
0
,
θ
1
\theta_0,\theta_1
θ0,θ1构成x轴与y轴坐标,成本函数
J
J
J的值作为z轴变量:


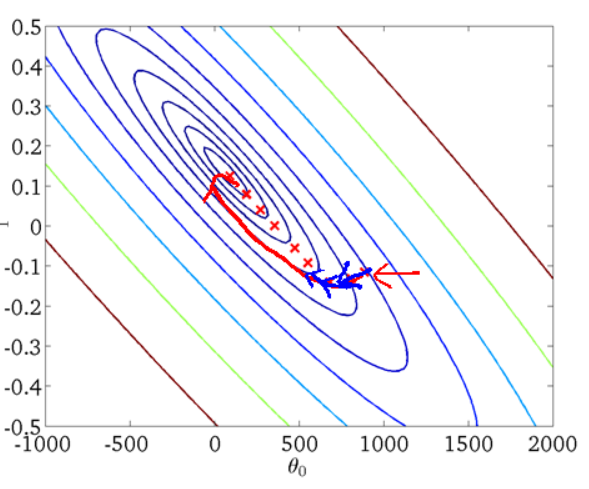
梯度下降全局最优解的寻找过程示意图:
完整版demo
import numpy as np
import matplotlib.pylab as plt
from mpl_toolkits.mplot3d import Axes3D

# ==================== Part 1: Basic Function ====================
print('Running warmUpExercise...')
print('5x5 Identity Matrix: ')
A = np.eye(5)  #创建5阶单位矩阵
print(A)
_ = input('Press [Enter] to continue.')

# ======================= Part 2: Plotting =======================
# 绘制散点图
def plotData(x, y):
    plt.plot(x, y, 'rx', ms=10)
    plt.xlabel('Population of City in 10,000')
    plt.ylabel('Profit in $10,000')
    plt.show()

print('Plotting Data...')
data = np.loadtxt('ex1data1.txt', delimiter=',')
X = data[:, 0]; Y = data[:, 1]
m = np.size(Y, 0)
plotData(X, Y)
_ = input('Press [Enter] to continue.')

# =================== Part 3: Gradient descent ===================
# 计算损失函数值
def computeCost(x, y, theta):
    ly = np.size(y, 0)
    cost = (x.dot(theta)-y).dot(x.dot(theta)-y)/(2*ly)
    return cost

# 迭代计算theta
def gradientDescent(x, y, theta, alpha, num_iters):
    m = np.size(y, 0)
    j_history = np.zeros((num_iters,))

    for i in range(num_iters):
        deltaJ = x.T.dot(x.dot(theta)-y)/m
        theta = theta-alpha*deltaJ
        j_history[i] = computeCost(x, y, theta)
    return theta, j_history

print('Running Gradient Descent ...')
X = np.vstack((np.ones((m,)), X)).T
theta = np.zeros((2,))  # 初始化参数

iterations = 1500
alpha = 0.01

J = computeCost(X, Y, theta)
print(J)

theta, j_history = gradientDescent(X, Y, theta, alpha, iterations)
print('Theta found by gradient descent: ', theta)

plt.plot(X[:, 1], Y, 'rx', ms=10, label='Training data')
plt.plot(X[:, 1], X.dot(theta), '-', label='Linear regression')
plt.xlabel('Population of City in 10,000')
plt.ylabel('Profit in $10,000')
plt.legend(loc='upper right')
plt.show()

# Predict values for population sizes of 35,000 and 70,000
predict1 = np.array([1, 3.5]).dot(theta)
print('For population = 35,000, we predict a profit of ', predict1*10000)
predict2 = np.array([1, 7.0]).dot(theta)
print('For population = 70,000, we predict a profit of ', predict2*10000)
_ = input('Press [Enter] to continue.')


# ============= Part 4: Visualizing J(theta_0, theta_1) =============
print('Visualizing J(theta_0, theta_1) ...')
theta0_vals = np.linspace(-10, 10, 100)
theta1_vals = np.linspace(-1, 4, 100)

J_vals = np.zeros((np.size(theta0_vals, 0), np.size(theta1_vals, 0)))

for i in range(np.size(theta0_vals, 0)):
    for j in range(np.size(theta1_vals, 0)):
        t = np.array([theta0_vals[i], theta1_vals[j]])
        J_vals[i, j] = computeCost(X, Y, t)

# 绘制三维图像
theta0_vals, theta1_vals = np.meshgrid(theta0_vals, theta1_vals)
fig = plt.figure()
ax = fig.add_axes(Axes3D(fig))
ax.plot_surface(theta0_vals, theta1_vals, J_vals.T)
ax.set_xlabel(r'$\theta$0')
ax.set_ylabel(r'$\theta$1')

# 绘制等高线图
fig2 = plt.figure()
ax2 = fig2.add_subplot(111)
ax2.contour(theta0_vals, theta1_vals, J_vals.T, np.logspace(-2, 3, 20))
ax2.plot(theta[0], theta[1], 'rx', ms=10, lw=2)
ax2.set_xlabel(r'$\theta$0')
ax2.set_ylabel(r'$\theta$1')
plt.show()
ex1data1数据:
6.1101,17.592
5.5277,9.1302
8.5186,13.662
7.0032,11.854
5.8598,6.8233
8.3829,11.886
7.4764,4.3483
8.5781,12
6.4862,6.5987
5.0546,3.8166
5.7107,3.2522
14.164,15.505
5.734,3.1551
8.4084,7.2258
5.6407,0.71618
5.3794,3.5129
6.3654,5.3048
5.1301,0.56077
6.4296,3.6518
7.0708,5.3893
6.1891,3.1386
20.27,21.767
5.4901,4.263
6.3261,5.1875
5.5649,3.0825
18.945,22.638
12.828,13.501
10.957,7.0467
13.176,14.692
22.203,24.147
5.2524,-1.22
6.5894,5.9966
9.2482,12.134
5.8918,1.8495
8.2111,6.5426
7.9334,4.5623
8.0959,4.1164
5.6063,3.3928
12.836,10.117
6.3534,5.4974
5.4069,0.55657
6.8825,3.9115
11.708,5.3854
5.7737,2.4406
7.8247,6.7318
7.0931,1.0463
5.0702,5.1337
5.8014,1.844
11.7,8.0043
5.5416,1.0179
7.5402,6.7504
5.3077,1.8396
7.4239,4.2885
7.6031,4.9981
6.3328,1.4233
6.3589,-1.4211
6.2742,2.4756
5.6397,4.6042
9.3102,3.9624
9.4536,5.4141
8.8254,5.1694
5.1793,-0.74279
21.279,17.929
14.908,12.054
18.959,17.054
7.2182,4.8852
8.2951,5.7442
10.236,7.7754
5.4994,1.0173
20.341,20.992
10.136,6.6799
7.3345,4.0259
6.0062,1.2784
7.2259,3.3411
5.0269,-2.6807
6.5479,0.29678
7.5386,3.8845
5.0365,5.7014
10.274,6.7526
5.1077,2.0576
5.7292,0.47953
5.1884,0.20421
6.3557,0.67861
9.7687,7.5435
6.5159,5.3436
8.5172,4.2415
9.1802,6.7981
6.002,0.92695
5.5204,0.152
5.0594,2.8214
5.7077,1.8451
7.6366,4.2959
5.8707,7.2029
5.3054,1.9869
8.2934,0.14454
13.394,9.0551
5.4369,0.61705
参考文献:
[1] 姚远-梯度的方向为什么是函数值增加最快的方向?
[2] cs24k1993-批梯度下降法(Batch Gradient Descent ),小批梯度下降 (Mini-Batch GD),随机梯度下降 (Stochastic GD)



![[2019“好贷杯“风控能力挑战赛一等奖] 基于神经网络算法的A股市场多因子选股的研究](https://img-blog.csdnimg.cn/0fc42a8482b74ea09d198d301adc71a8.png)
