第五章. 可视化数据分析分析图
5.2 图表的常用设置2
本节主要介绍图表的常用设置,设置标题和图例,添加注释文本,调整图表与画布边缘间距以及其他设置。
7.设置标题(title)
1).语法:
matplotlib.pyplot.title(label,fontdict=None,loc='center',pad=None,**kwargs)
参数说明:
label:图表标题文本
fontdict:字典,用于设置标题字体的样式,如’{‘fontsize’:10,‘fontweight’:10,‘va’:‘bottom’,‘ha’:‘center’}’
loc:标题水平位置,参数:center,left,right
pad:标题距离图表顶部的距离
8.设置图例(legend)
1).语法:
matplotlib.pyplot.legend(*args, **kwargs)
参数说明:
可设置很多参数,如图例名称,显示位置,轴与图例之间的距离
2).图例显示方式:
- 自动显示:
matplotlib.pyplot.legend() - 手动添加:
注:手动添加图例时,有时文本会显示不全,在文本后面加一个逗号(,)可解决,例如:(‘图书采购价目’,)matplotlib.pyplot.legend(('图书采购价目',), loc='upper right')
3).图例显示位置:(loc)
| 位置(字符串) | 位置索引 | 描述 | 位置(字符串) | 位置索引 | 描述 |
|---|---|---|---|---|---|
| best | 0 | 自适应 | center left | 6 | 左侧中间位置 |
| upper right | 1 | 右上方 | center right | 7 | 右侧中间位置 |
| upper left | 2 | 左上方 | lower center | 8 | 下方中间位置 |
| lower left | 3 | 左下方 | upper center | 9 | 上方中心位置 |
| lower right | 4 | 右下方 | center | 10 | 中心 |
| right | 5 | 右侧 |
注:
- 参数bbox_to_anchor也可对图例的位置进行控制,元组类型 bbox_to_anchor =(num1,num2),num1:控制legend左右移动(值越大越向右移动),num2:控制legend上下移动(值越大越向上移动)
- 参数borderaxespad,可控制轴和图例边框之间的间距,字体大小为单位度量
9.添加注释(annotate)
在图表上给数据添加文本注释,描述信息
1).语法:
matplotlib.pyplot.annotate(s, xy, *args, **kwargs)
参数说明:
s:标注文本
xy:要标注的点,二维元组(x,y)。
xytext:可选的,文本的位置,二维元组(x,y)。如果没有设置,默认为要标注的点的坐标。
xycoords:可选的,点的坐标系。字符串、Artist、Transform、callable或元组。
arrowprops:箭头的样式,dict型数据,如果属性为空,则会在注释文本和被注释点之间画箭头
2).xycoords参数设置及说明
| 设置值 | 说明 |
|---|---|
| figure points | 以图的左下角为参考,单位点数 |
| figure pixels | 以图的左下角为参考,单位像素数 |
| figure fraction | 以图的左下角为参考,单位百分比 |
| axes points | 以子图的左下角为参考,单位点数(一个figure可以有多个axes ) |
| axes pixels | 以子图的左下角为参考,单位像素数 |
| axes fraction | 以子图的左下角为参考,单位百分比 |
| data | 以被注释的坐标点x,y为参考(默认值) |
| polar | 不使用本地数据坐标系,使用极坐标系 |
3).arrowprops参数设置及说明
| 设置值 | 说明 |
|---|---|
| width | 箭头的宽度,单位点 |
| headwidth | 箭头头部的宽度,单位点 |
| headlength | 箭头头部的长度,单位点 |
| shrink | 箭头两端收缩的百分比(占总比) |
| ? | 任何matplotlib.patches.FancyArrowPatch中的关键字 |
10.调整图表与画布边缘间距(subplots_adjust)
绘制图表的时候,由于x,y轴标题与画布边缘距离太近,而显示不全,可通过subplots_adjust函数来调节图表和画布之间的距离
1).语法:
matplotlib.pyplot.subplots_adjust(left=None,bottom=None,right=None,top=None,wspace=None,hspace=None)
参数说明:
left,bottom,right,top:调整上下左右的空白,left和bottom值越小,空白越小,right和top,值越大,空白越小(画布是从左下角开始,取值0~1)
wspace,hspace:用于调节列间距和行间距
11.上述函数的应用
1).结果展示:
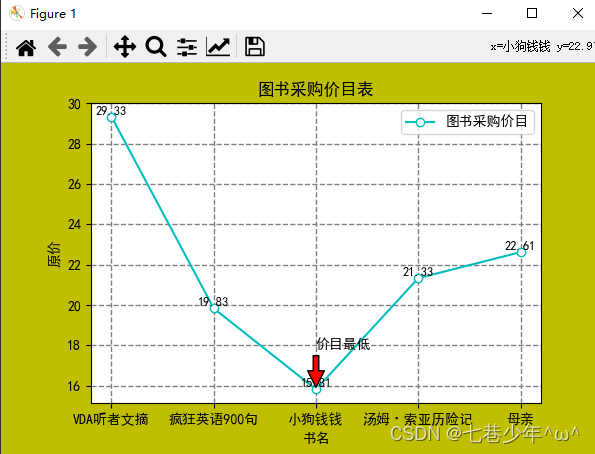
2).代码:
import pandas as pd
import matplotlib.pyplot as plt

pd.set_option('display.unicode.east_asian_width', True)
df = pd.read_excel('F:\\Note\\图书采购清单.xlsx', sheet_name='Sheet1', usecols=['原价', '书名'])
print(df)

# 设置画布
fig = plt.figure(figsize=(6, 4), facecolor='y')

plt.rcParams['font.sans-serif'] = ['SimHei']  # 解决中文乱码
plt.rcParams['axes.unicode_minus'] = False  # 解决负号不显示的问题

# 设置线
plt.plot(df['书名'], df['原价'], color='c', linestyle='-', marker='o', mfc='w')

# 设置网格线
plt.grid(color='0.5', linestyle='--', linewidth=1)

# 设置x,y轴坐标
plt.xlabel('书名')
plt.ylabel('原价')

# 设置坐标轴刻度
plt.xticks(df['书名'])

# 设置文本标签
for x, y in zip(df['书名'], df['原价']):
    plt.text(x, y, '%.2f' % y, ha='center', va='bottom', fontsize=9)

# 设置标题和图例
plt.title('图书采购价目表')

# 设置图标图例
plt.legend(('图书采购价目',), loc='upper right')  # 手动添加图例时,有时文本会显示不全,在文本后面加一个逗号(,)可解决,例如('图书采购价目',)

# 添加注释
plt.annotate('价目最低', xy=(df['书名'][2], df['原价'][2]), xytext=(df['书名'][2], df['原价'][2] + 2), xycoords='data',
             arrowprops=dict(facecolor='r', shrink=0.05))

# 调整图表与画布边缘间距
plt.subplots_adjust(left=0.15, bottom=0.15, right=0.9, top=0.9)

# 显示图像
plt.show()







![[附源码]Python计算机毕业设计Django的花店售卖系统的设计与实现](https://img-blog.csdnimg.cn/b3c9aea1d1074b3893826d8b7c005a17.png)
![[附源码]SSM计算机毕业设计学习资源共享与在线学习系统JAVA](https://img-blog.csdnimg.cn/e45bc202e05a4ccfa8e0d1a93874f2d5.png)
