在 contour函数中添加如下代码
%------- 计算畅通区面积和占比例  --------%
S=pi*maxrange*maxrange/1e6;
S0= nnz(isInRange)*reslons*reslats/1e6;

isnn = ~isnan(cdata);
cdata0 = cdata(isnn);
S1=numel(cdata0)*reslons*reslats/1e6;

A=S1/S0; % 畅通区所占比例;
fprintf("总面积为: %f\n畅通区面积为: %f\n畅通区所占比例为: %f\n",S0,S1,A)
%--------------------------------------%
一、利用Matab 求解天线的覆盖范围,通视以及是否能够联通
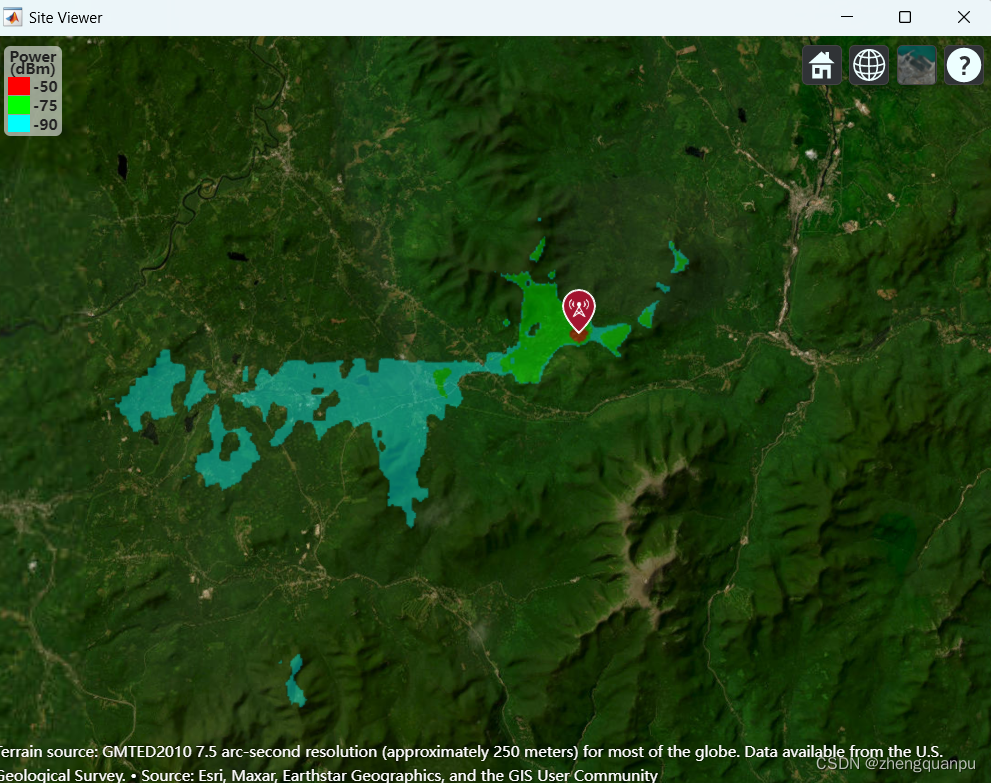
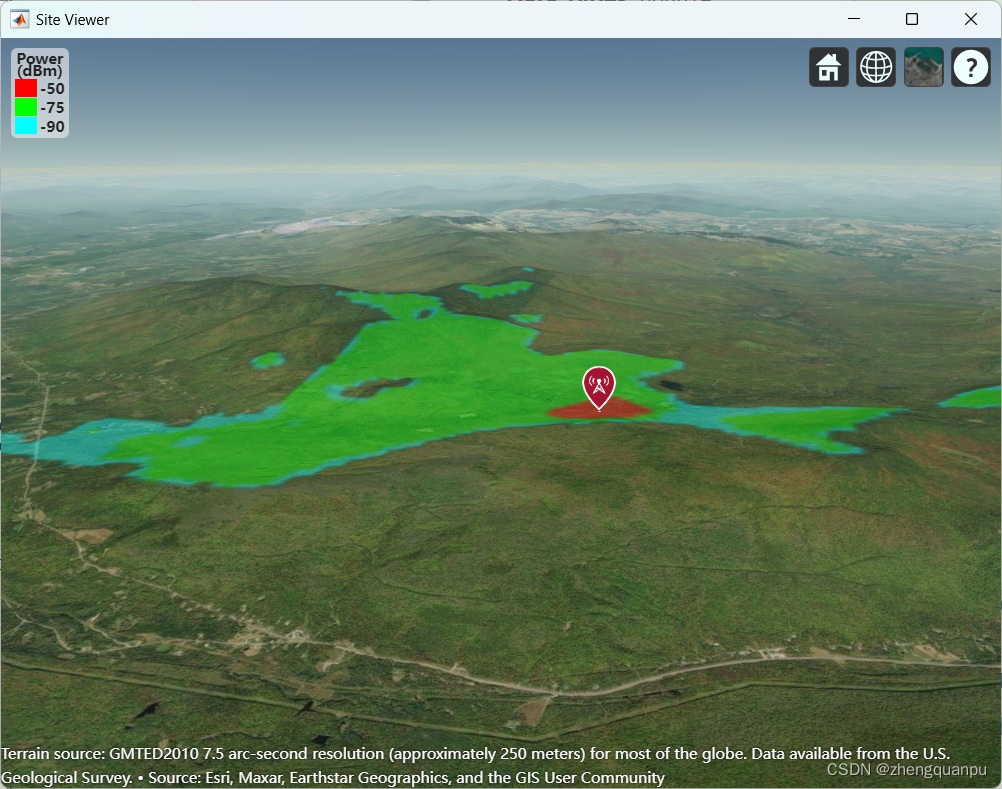
%% 计算天线的覆盖范围,覆盖面积随着地形变化,不同信号强度用不同的颜色表示,求解覆盖面积(???)
viewer1 = siteviewer;
tx = txsite('Name','MathWorks', ...
        'Latitude', 42.3001, ...
        'Longitude', -71.3503);

rx = rxsite('Name','Fenway Park', ...
       'Latitude',42.3467, ...
       'Longitude',-71.0972,'AntennaHeight',10);
% rx1 = rxsite('Name','Fenway Park', ...
%        'Latitude',42.3467, ...
%        'Longitude',-71.0972,'AntennaHeight',1.2,'SystemLoss',10);
 show(tx); % 显示对应的点位
% coverage(tx,rx)

% 不同颜色表示
strongerSignal = -50;
strongerSignalColor = "red";
strongSignal = -75;
strongSignalColor = "green";
weakSignal = -90;
weakSignalColor = "cyan";


for k=1:100
    lat=0.1*k;
    tx.Latitude= tx.Latitude+lat;
    pause
    coverage(tx,'SignalStrengths',[strongerSignal,strongSignal,weakSignal], ...
    'Colors', [strongerSignalColor,strongSignalColor,weakSignalColor]);
end
% los(tx,rxs) %两点是否通视
% link(rxs,tx,"SuccessColor",'y','FailColor','c') %两点是否能够联通
% coverage(tx,"Map",viewer1)
% return;
%%%%%%%%%%%%%%%%%%%
% viewer2 = siteviewer;
% tx = txsite('Name','MathWorks', ...
%         'Latitude', 42.3001, ...
%         'Longitude', -71.3503);
%
% rx = rxsite('Name','Fenway Park', ...
%        'Latitude',42.3467, ...
%        'Longitude',-71.0972);
% rx1 = rxsite('Name','Fenway Park', ...
%        'Latitude',42.3467, ...
%        'Longitude',-71.0972,'AntennaHeight',1.2,'SystemLoss',10);

% coverage(tx,rx)
% coverage(tx,rx,"Map",viewer2) %选用对应的地图
return;
% 计算信干比及通信容量
sv1 = siteviewer("Name","SINR map");
sinr(tx,"MaxRange",5000)

pd = sinr(tx,"MaxRange",5000);
[sinrDb,lats,lons] = getDataVariable(pd,"SINR");
% 由信干比求容量
% Create new propagation data for the capacity map and display the contour plot.
bw = 1e6; % Bandwidth is 1 MHz
sinrRatio = 10.^(sinrDb./10); % Convert from dB to power ratio
capacity = bw*log2(1+sinrRatio)/1e6; % Unit: Mbps

pdCapacity = propagationData(lats,lons,"Capacity",capacity);
sv2 = siteviewer("Name","Capacity map");
legendTitle = "Capacity" + newline + "(Mbps)";
contour(pdCapacity,"LegendTitle",legendTitle);
% plot(pdCapacity, "LegendTitle", legendTitle, "Colormap", parula);
1、信干比覆盖
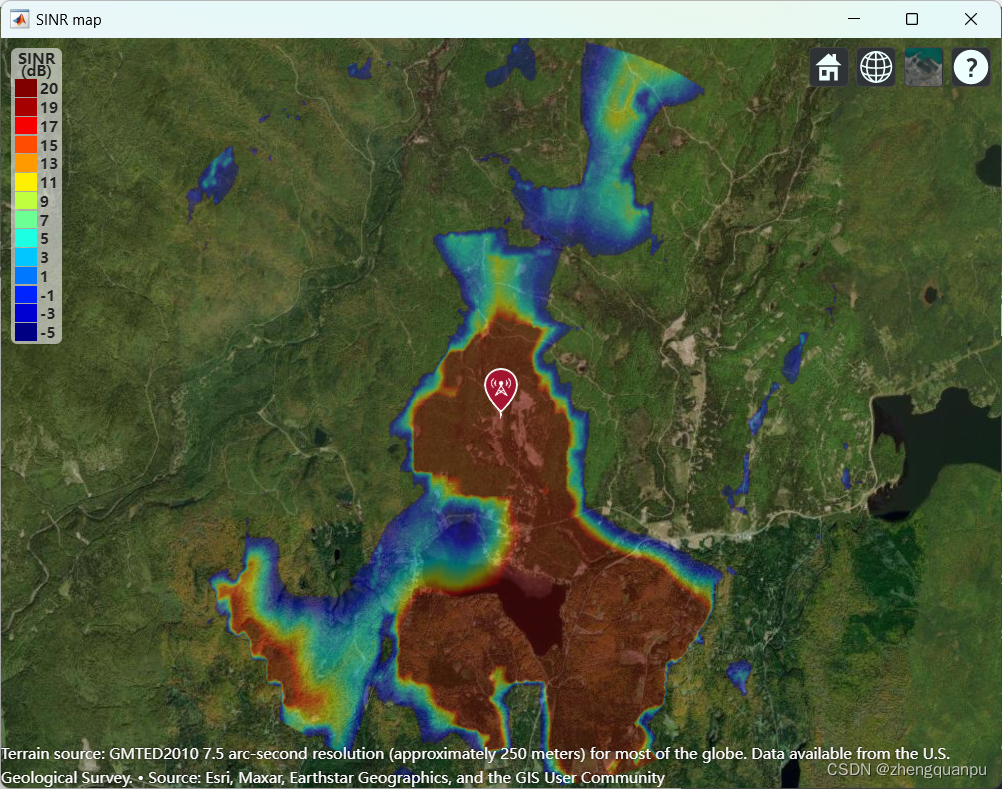
2、 通信容量计算,覆盖范围
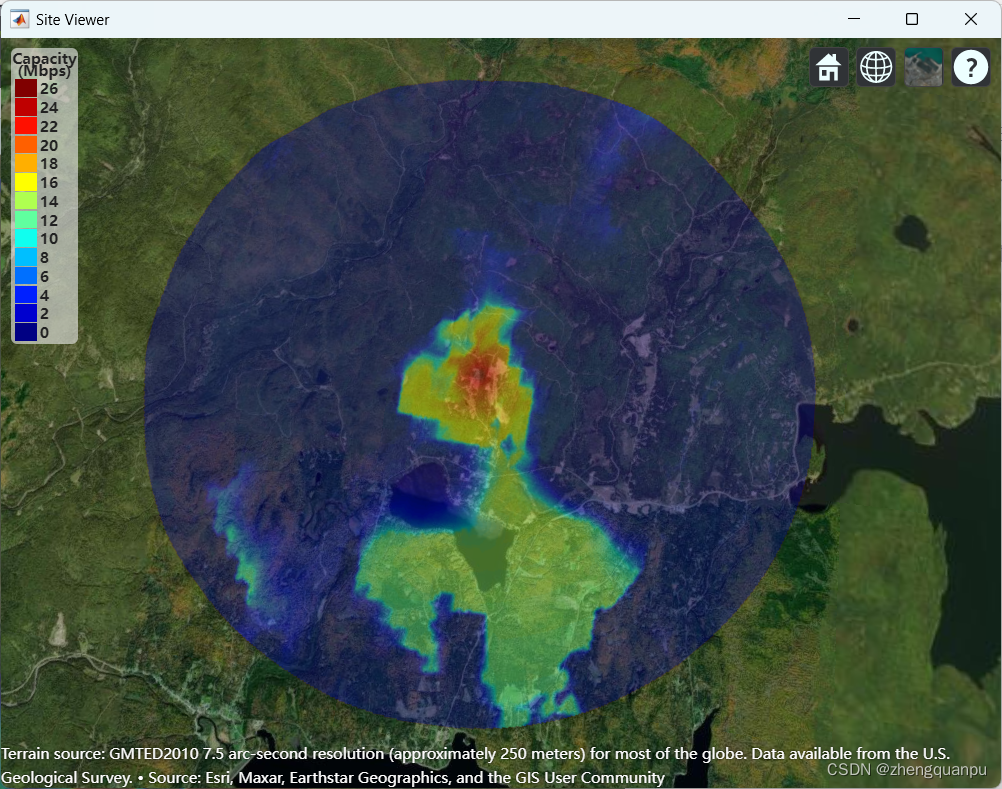
二、利用Matab 加载路径轨迹数据
%% 加载已有的GPS轨迹数据
trk = gpxread('F:\地图数据\2022-02-05+1435+驾车.gpx','FeatureType','track');

lat = trk.Latitude;
lon = trk.Longitude;
h = trk.Elevation;
% Create a geographic globe. Then, plot the path as a line. By default, the view is directly above the data. Tilt the view by holding Ctrl and dragging.

uif = uifigure;
g = geoglobe(uif);
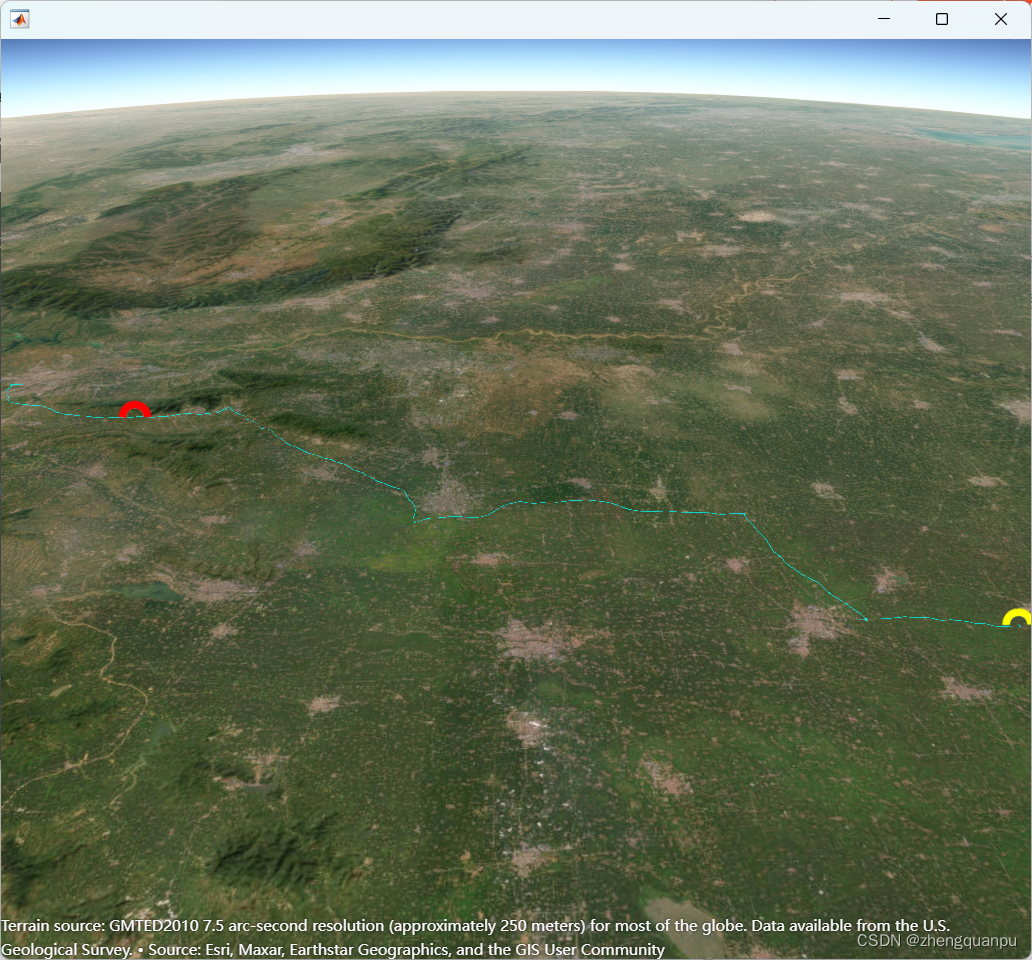
geoplot3(g,lat,lon,h,'c','HeightReference','ellipsoid')

% 标记出最高点和最低点的位置
[hMax, Imax]=max(h);
[hMin, Imin]=min(h);
hold(g,"on")
h_rdrtraj = geoplot3(g,lat(Imax),lon(Imax),h(Imax)+90,"ro","LineWidth",6,"MarkerSize",10);
h_rdrtraj1 = geoplot3(g,lat(Imin),lon(Imin),h(Imin)+90,"yo","LineWidth",6,"MarkerSize",10);

return;
三维视图:
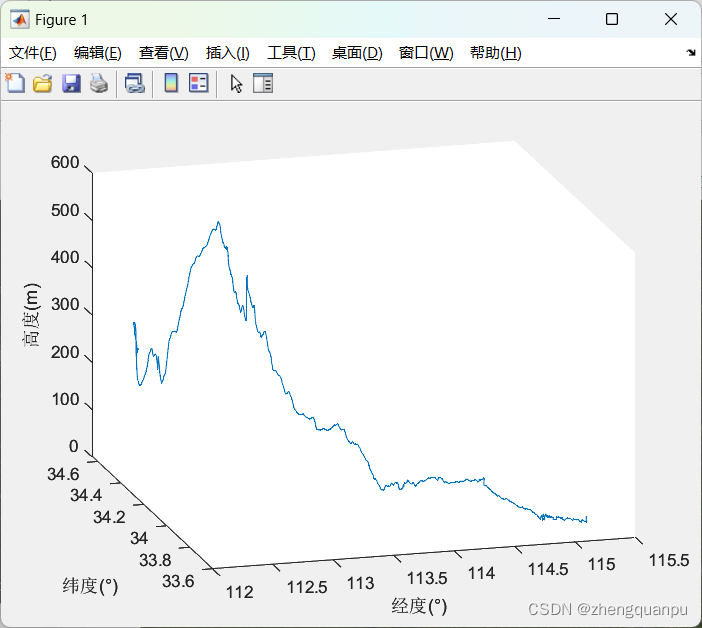
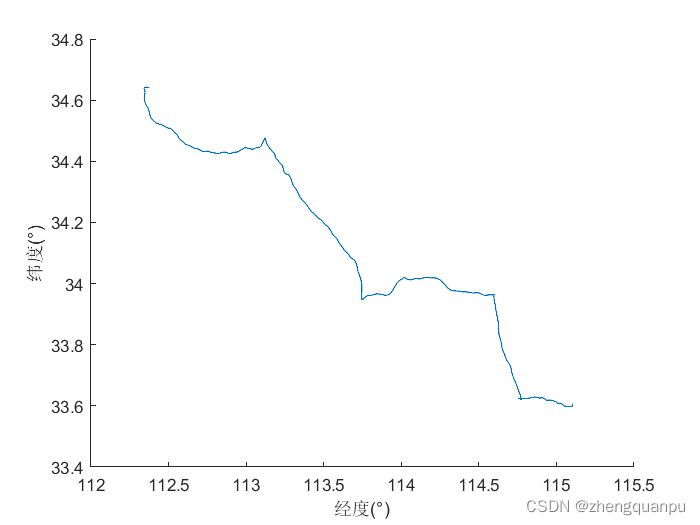
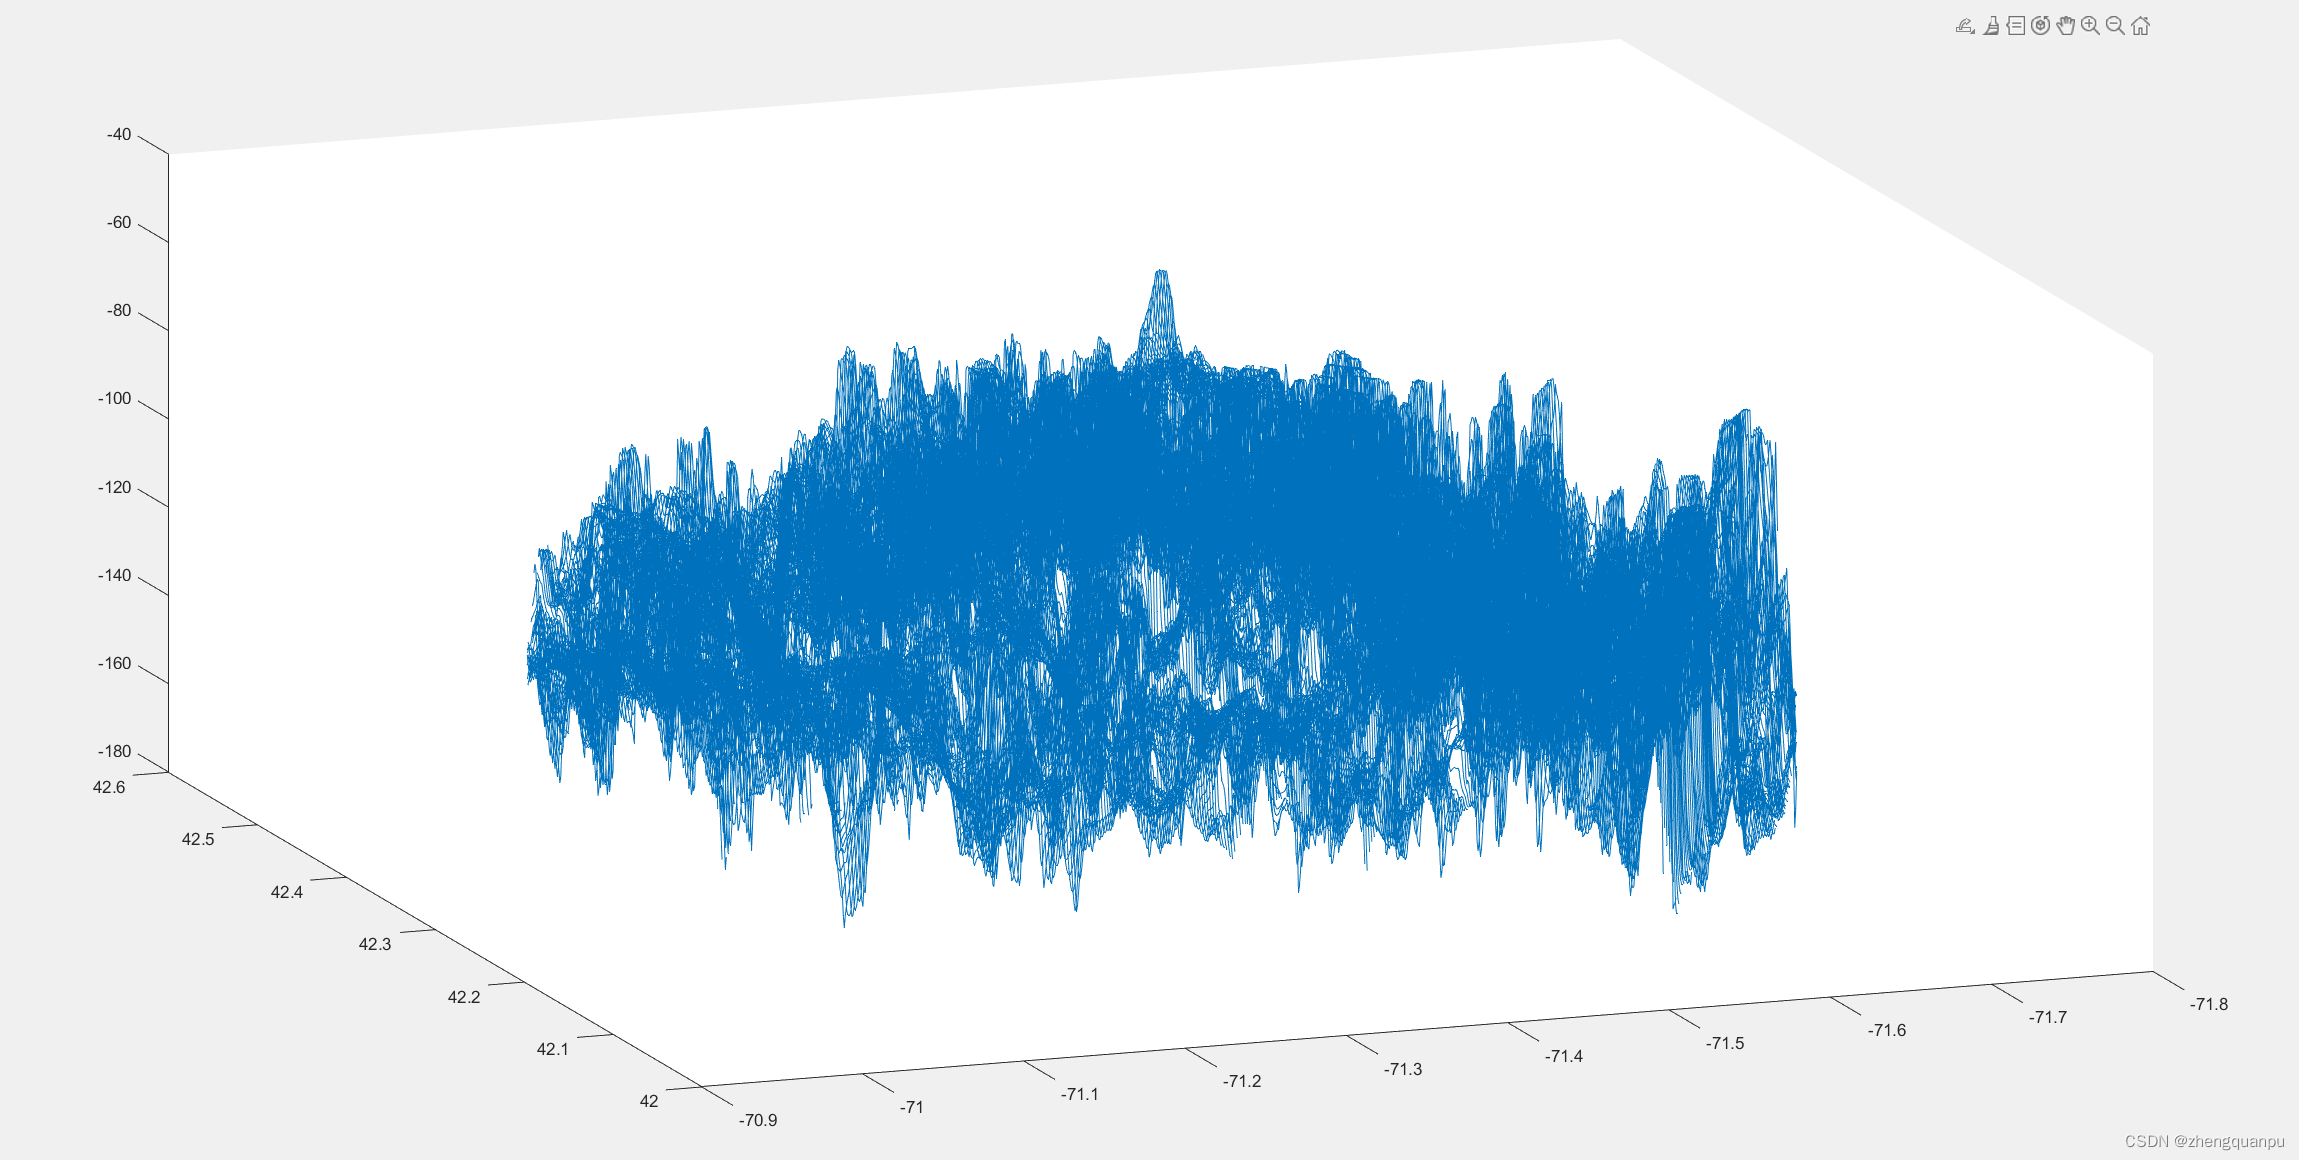
数据的三维图:
三、利用Matab 绘制轨迹数据
%% 生成飞机轨迹数据
tlat0 = 39.80384;           % Target initial latitude (deg)
tlon0 = -105.49916;         % Target initial longitude (deg)
tht0 = 3000;                % Target initial height (m)
azs = 1:2:540;              % Target azimuth (deg)
r = 5000;                   % Target slant range (m)

% Convert from polar coordinates to Cartesian East, North, Up (ENU).
% [X,Y] = pol2cart(deg2rad(azs),r);% 画圆形

%画8字形
% t = 0:0.01:2*pi;                        % 控制运动的圈数 一个周期为 2*pi
t = deg2rad(azs);
a = 1000;                                  % 控制横轴上的范围
b=1000;
X = a * cos( t ) ./ (1+sin(t).*sin(t));
Y = b*sin( t ).*cos( t ) ./ (1+sin(t).*sin(t)); % 当然可以乘一个系数放大纵轴范围

% Convert ENU to geodetic.
Z = linspace(0,1000,numel(azs));
wgs84 = wgs84Ellipsoid;
[tlat,tlon,tht] = enu2geodetic(X,Y,Z,tlat0,tlon0,tht0,wgs84);

% Define the target altitude.
talt = tht - egm96geoid(tlat,tlon); % Target altitude (m)

fs = 0.1;
t = (0:length(X)-1)/fs;
ttraj = geoTrajectory([tlat.' tlon.' talt.'],t,'SampleRate',fs);

fig = uifigure;
g = geoglobe(fig,"Terrain","southboulder");
h_ttraj = geoplot3(g,tlat,tlon,talt,"yo","LineWidth",3);
campos(g,39.77114,-105.62662,6670)
camheading(g,70)
campitch(g,-12)
return;
return;
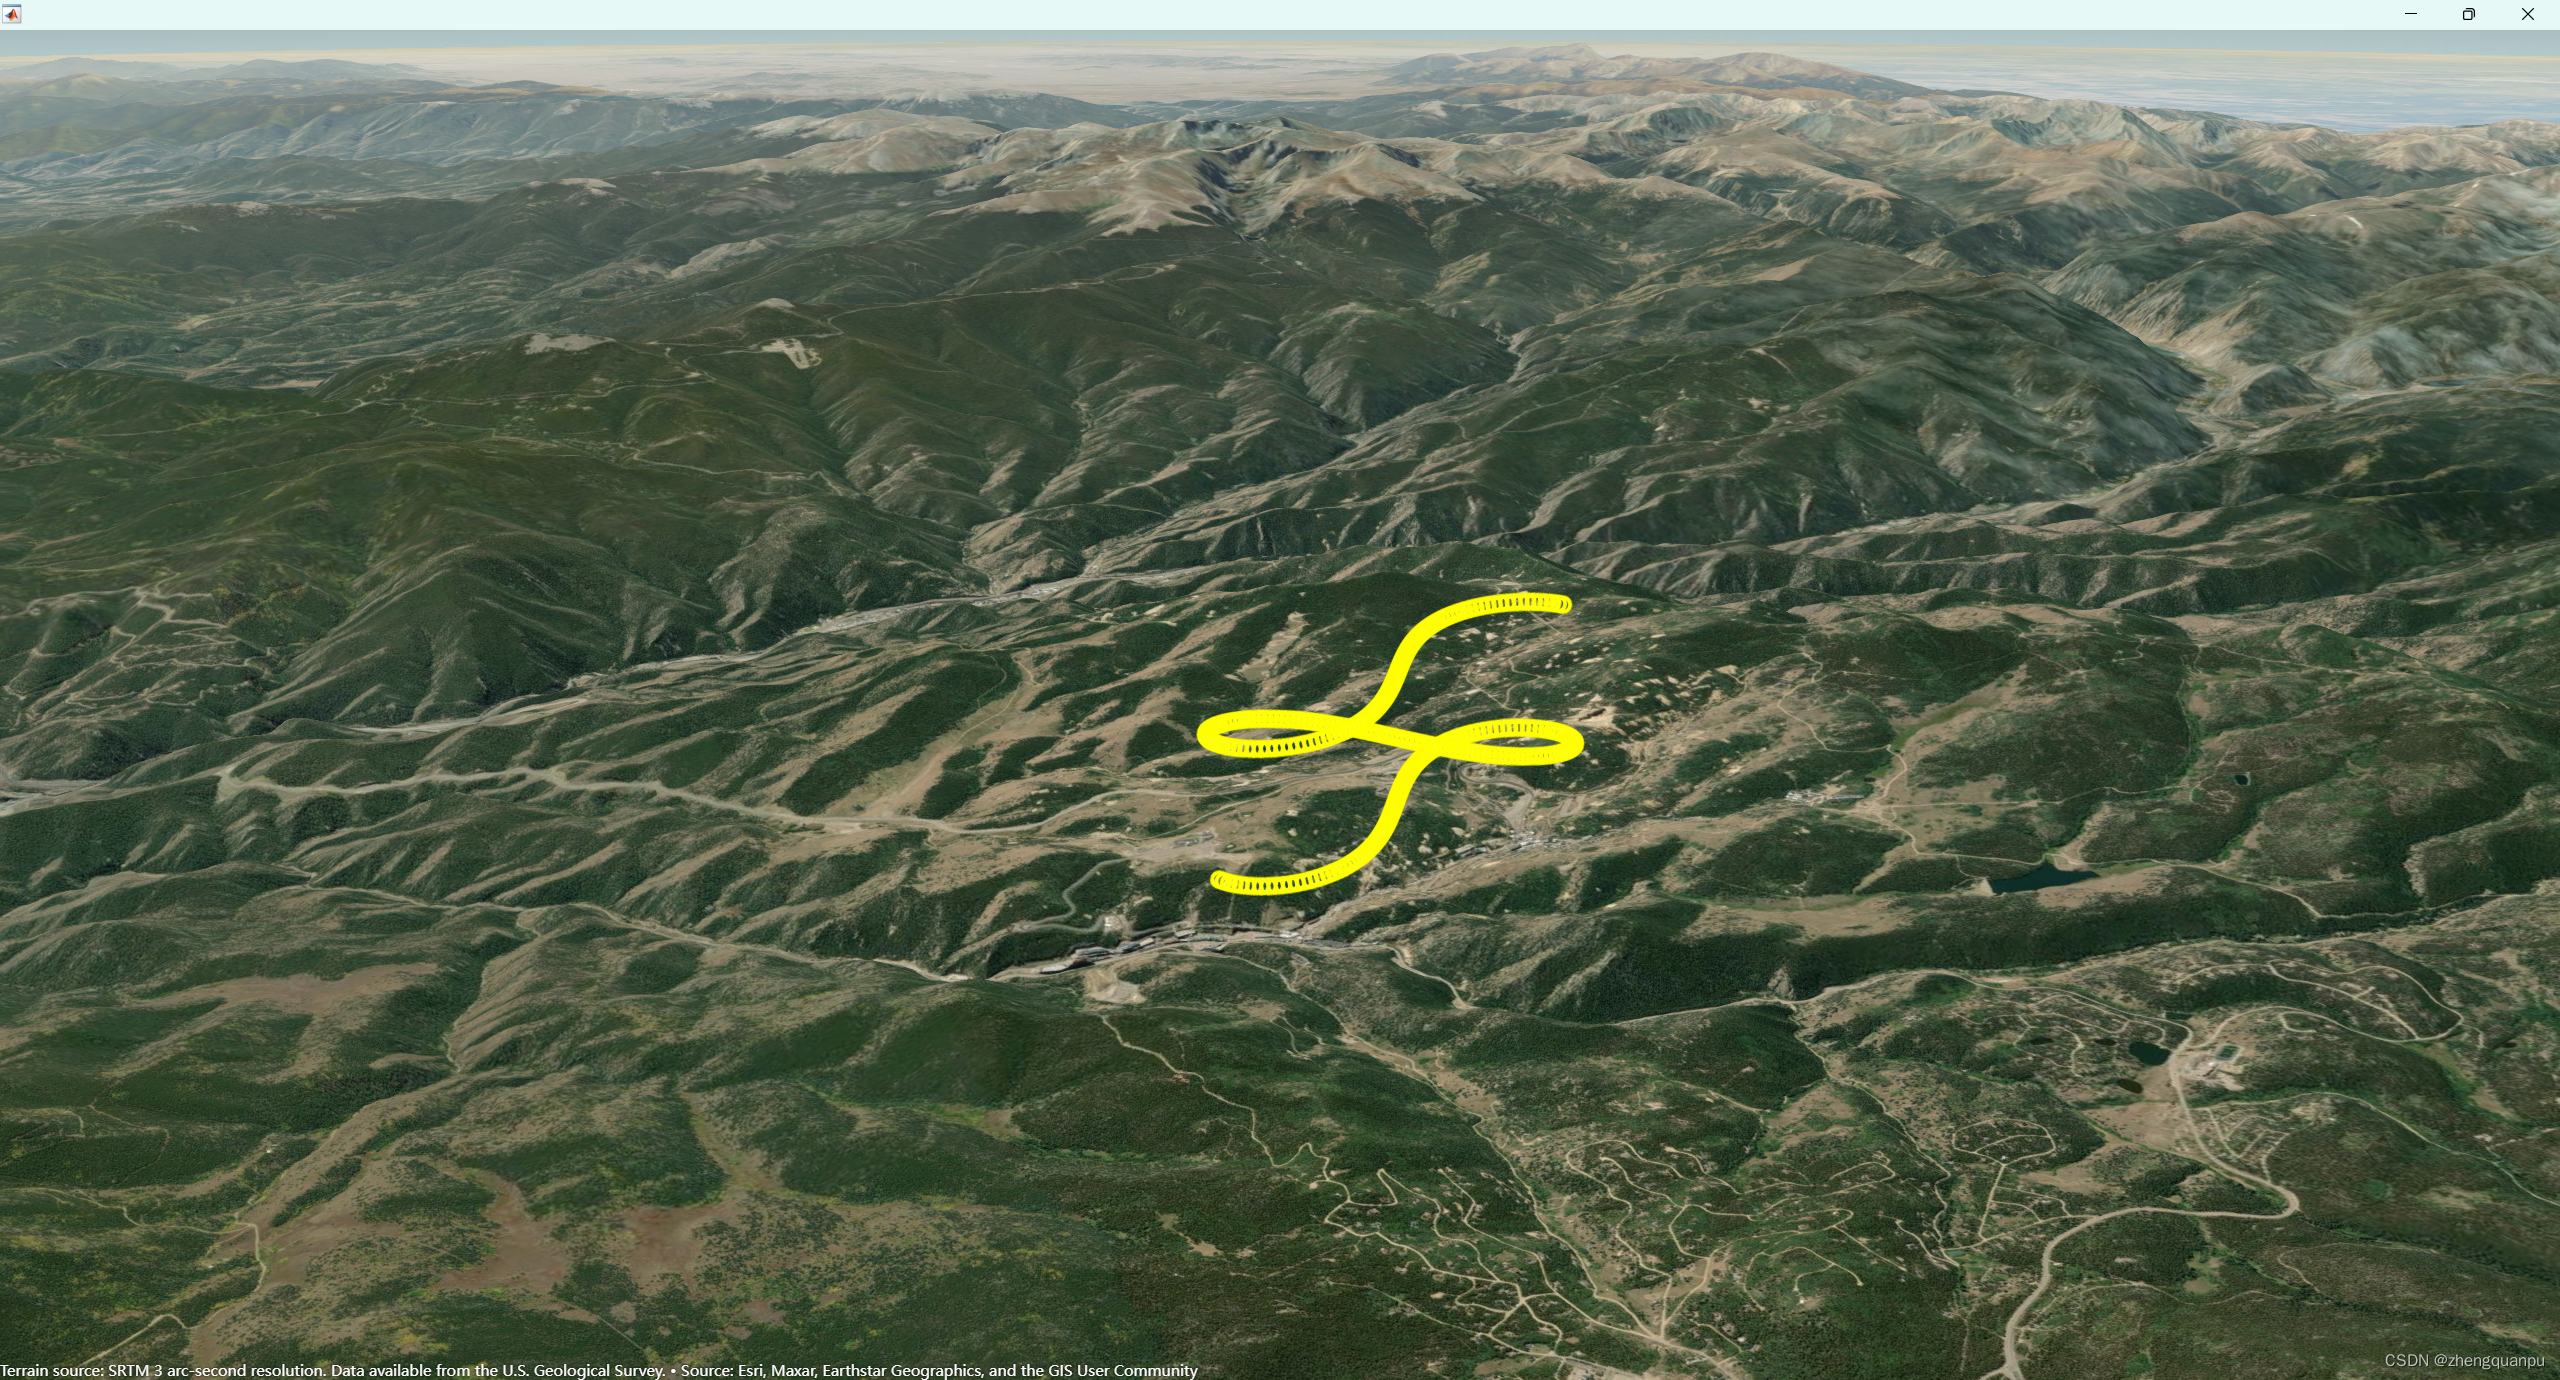
% 关键代码
 t = 0:pi/50:2*pi;
 X = 16*sin(t).^3;
 Y = 13*cos(t)-5*cos(2*t)-2*cos(3*t)-cos(4*t);
X=1000*X;
Y=1000*Y;
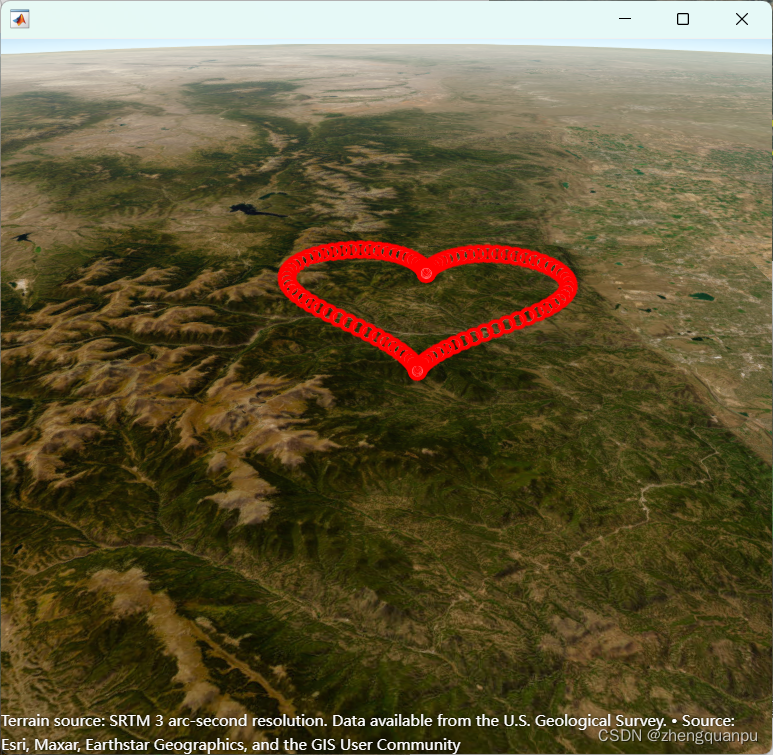
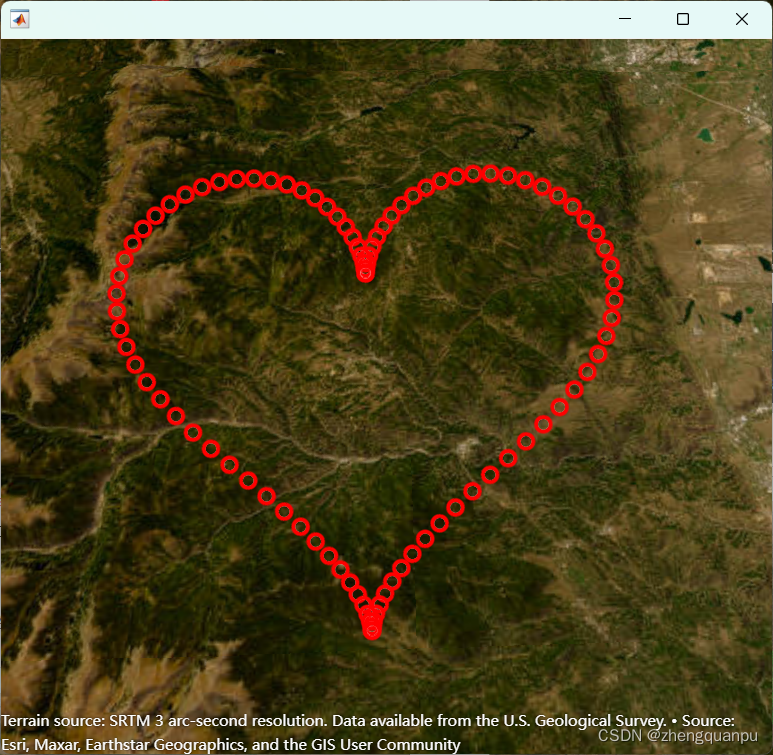
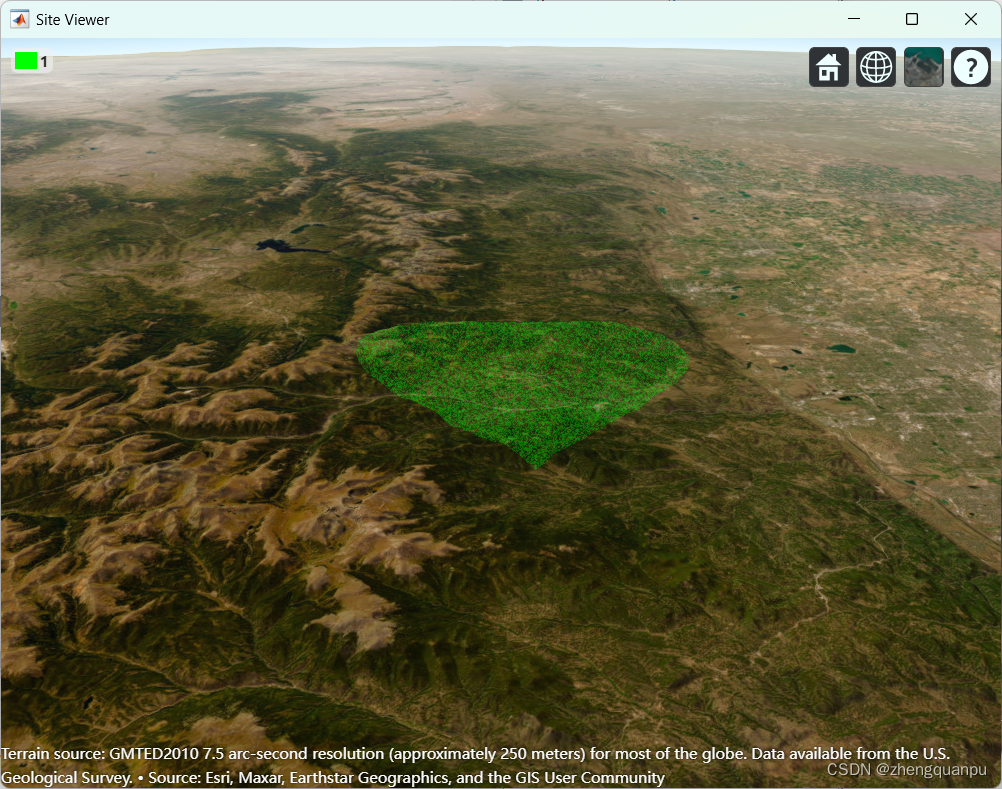
% 绘制心型区域
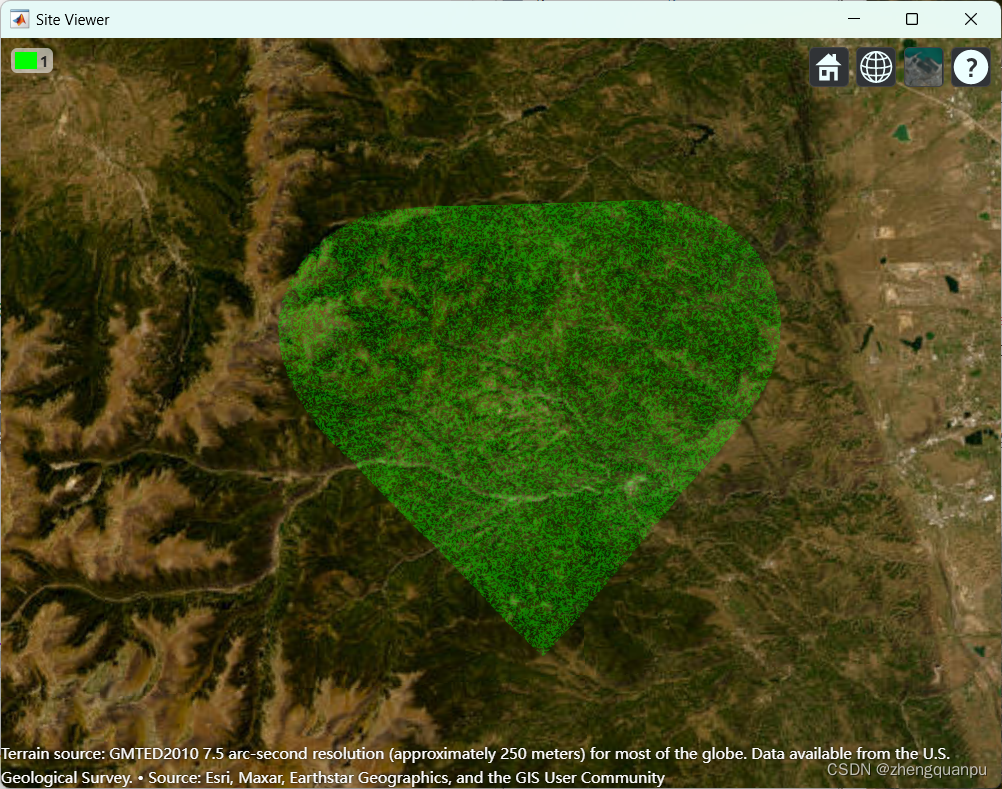
regionData = propagationData(tlat,tlon,'Area',ones(size(tlat)));
contour(regionData,'ShowLegend',false,'Colors','green','Levels',0)
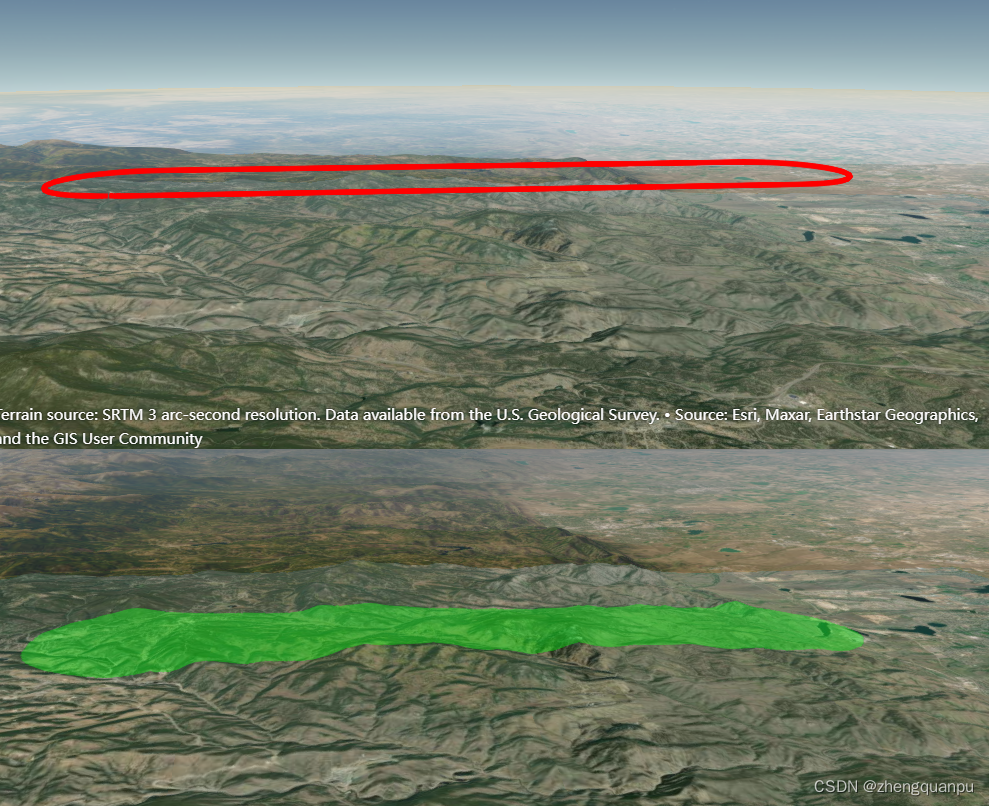
% 心型不完整,最上面是直线型的,不知道为什么
% 绘制赛道型轨迹
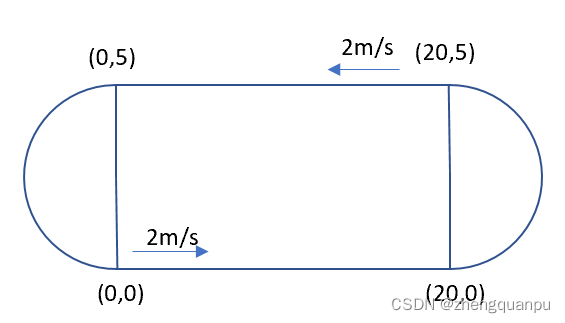
% https://ww2.mathworks.cn/help/fusion/ref/waypointtrajectory-system-object.html?s_tid=srchtitle_waypointTrajectory_1
% 最下面的例子

% The four corner points of the trajectory are (0,0,0), (20,0,0), (20,5,0) and (0,5,0) in meters, respectively.
wps = [0 0 0;
      20 0 0;
      20 5 0;
      0  5 0;
      0  0 0];
vels = [2 0 0;
        2 0 0;
       -2 0 0;
       -2 0 0;
        2 0 0];
      %  The time of arrival for the five waypoints is:
t = cumsum([0 20/2 5*pi/2/2 20/2 5*pi/2/2]');

% The orientation of the trajectory at the five waypoints are:
eulerAngs = [0 0 0;
             0 0 0;
           180 0 0;
           180 0 0;
             0 0 0]; % Angles in degrees.
% Convert Euler angles to quaternions.
quats = quaternion(eulerAngs,'eulerd','ZYX','frame');
fs = 100;
traj = waypointTrajectory(wps,'SampleRate',fs, ...
        'Velocities',vels,...
        'TimeOfArrival',t,...
        'Orientation',quats);
[pos, orient, vel, acc, angvel] = traj();
i = 1;

spf = traj.SamplesPerFrame;
while ~isDone(traj)
    idx = (i+1):(i+spf);
    [pos(idx,:), orient(idx,:), ...
        vel(idx,:), acc(idx,:), angvel(idx,:)] = traj();
    i = i+spf;
end

plot(pos(:,1),pos(:,2), wps(:,1),wps(:,2), '--o')
xlabel('X (m)')
ylabel('Y (m)')
zlabel('Z (m)')
legend({'Trajectory', 'Waypoints'})
axis equal
得出对应的XYZ坐标之后,放大,坐标转换到对应的地理坐标系中,然后加载到地图。
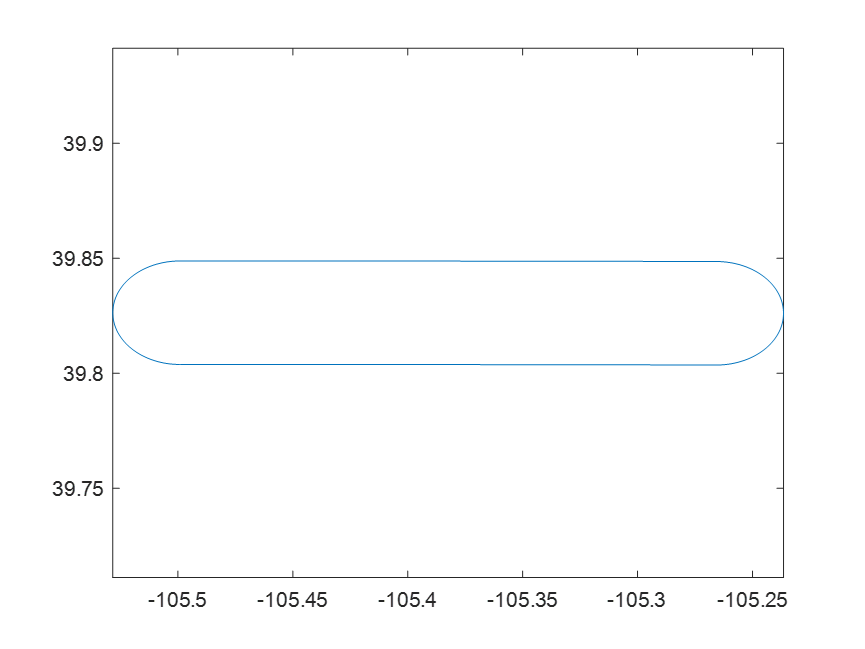
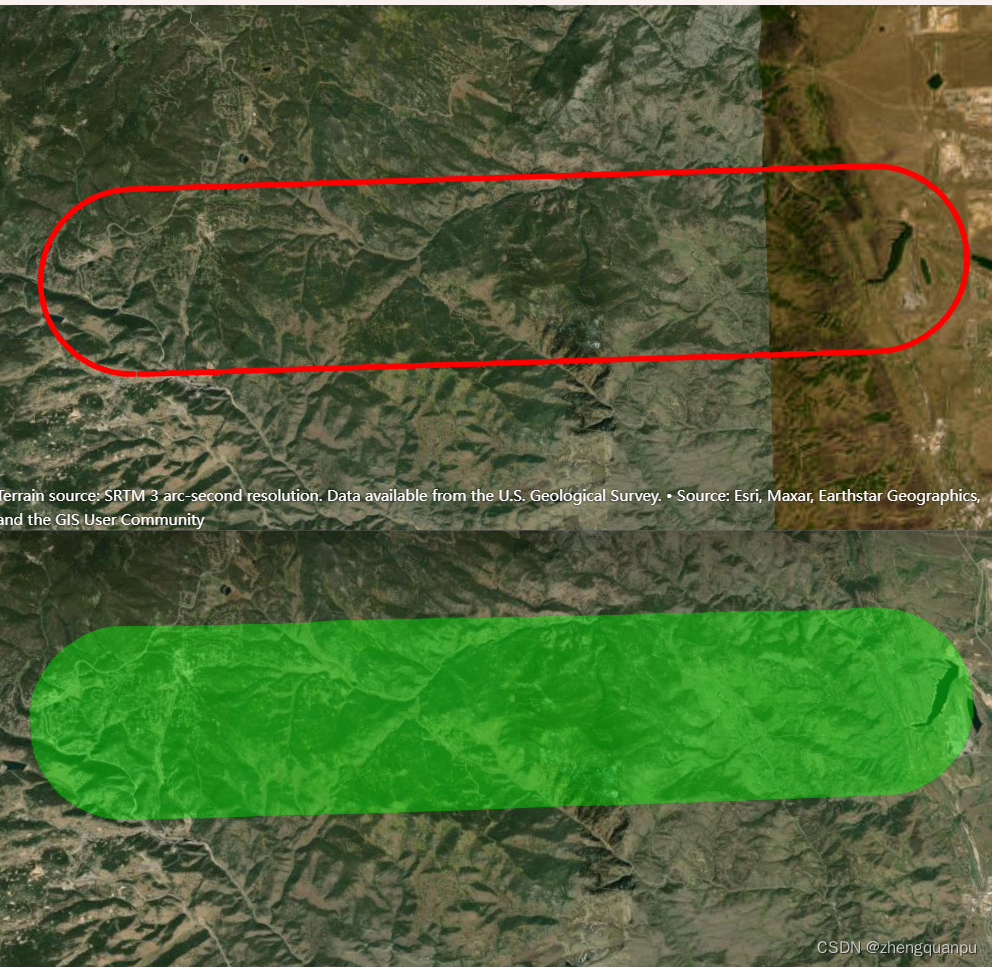
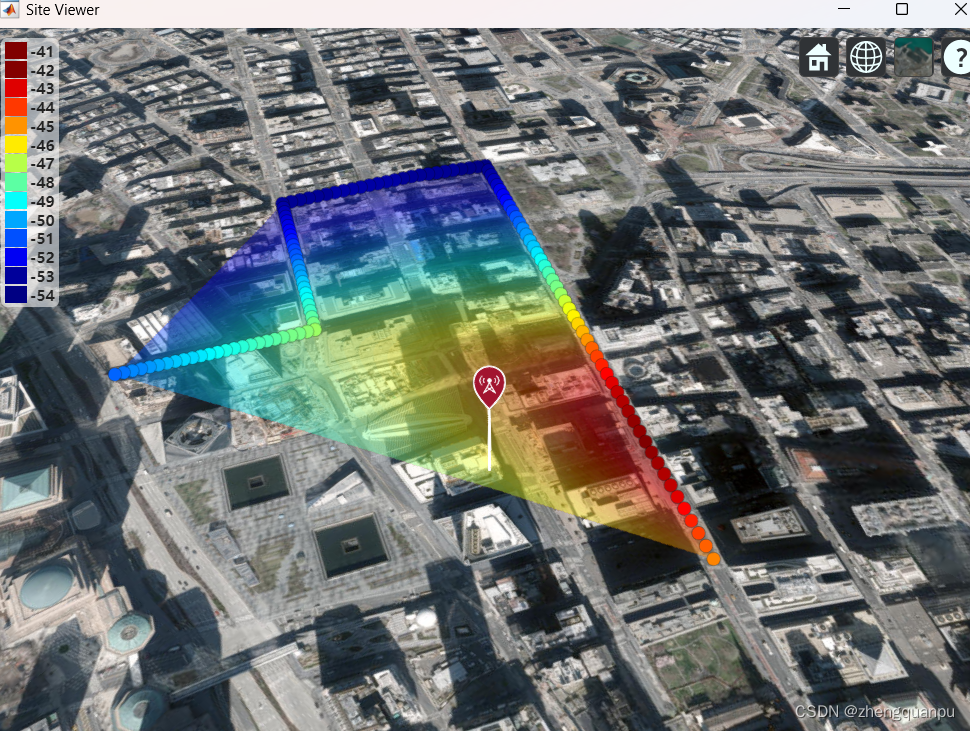
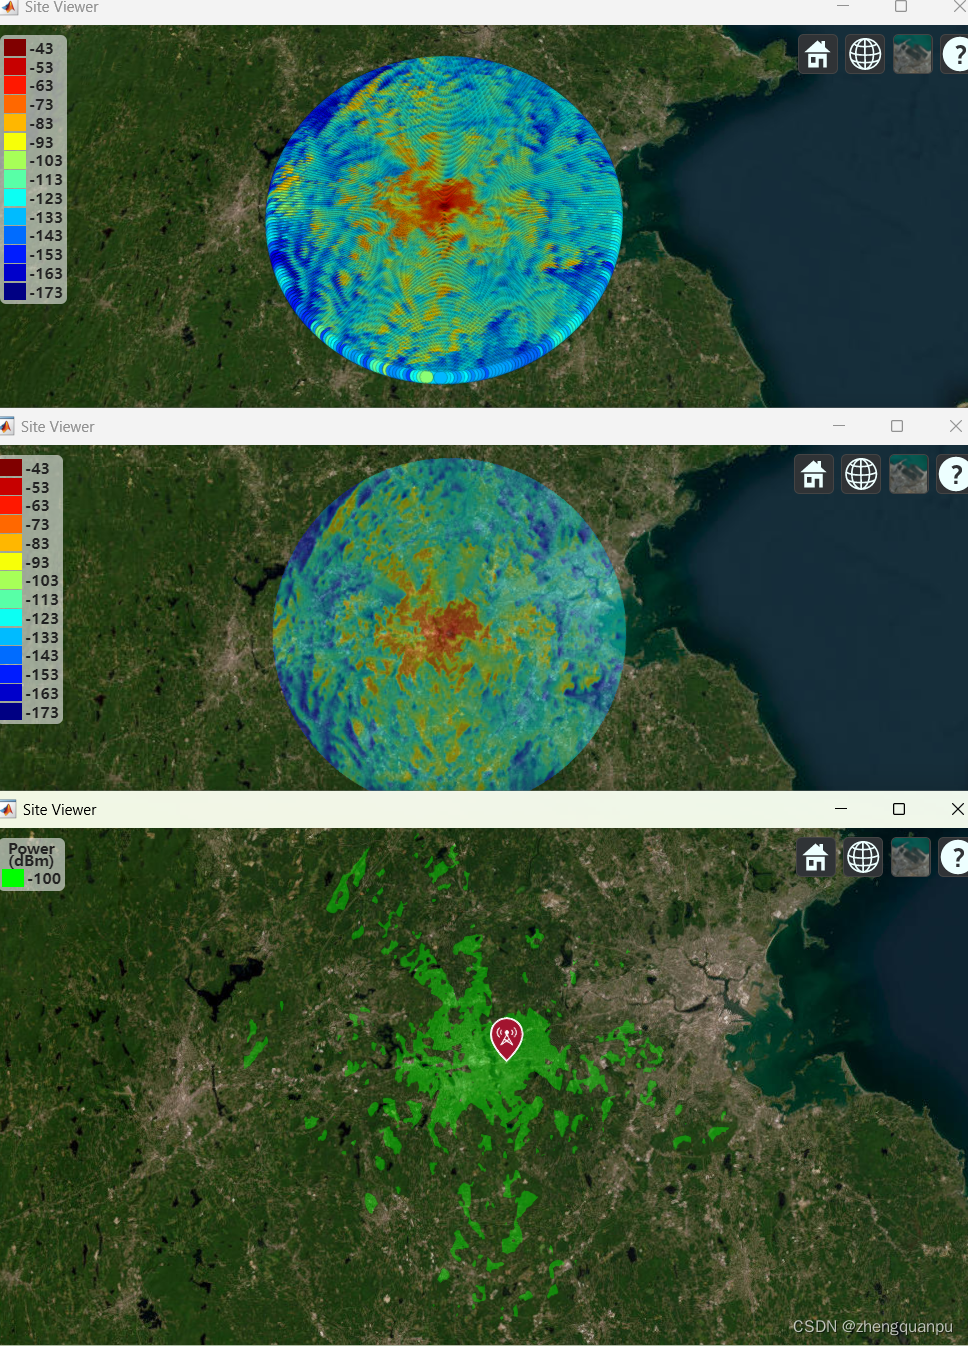
plot,contour,coverage三种 绘制方式的显示
后记:
关键的函数: show, plot,contour,coverage,table,propagationData
Capacity Map Using SINR Data
注:对原数据进行修改后,再返回进行显示。
Define names and locations of sites around Boston.
names = ["Fenway Park","Faneuil Hall","Bunker Hill Monument"];
lats = [42.3467,42.3598,42.3763];
lons = [-71.0972,-71.0545,-71.0611];
Create an array of transmitter sites.
Create a signal-to-interference-plus-noise-ratio (SINR) map, where signal source for each location is selected as the transmitter site with the strongest signal.
sv1 = siteviewer("Name","SINR map");
sinr(txs,"MaxRange",5000)
Return SINR propagation data.
pd = sinr(txs,"MaxRange",5000);
[sinrDb,lats,lons] = getDataVariable(pd,"SINR");
Compute capacity using the Shannon-Hartley theorem.
bw = 1e6; % Bandwidth is 1 MHz
sinrRatio = 10.^(sinrDb./10); % Convert from dB to power ratio
capacity = bw*log2(1+sinrRatio)/1e6; % Unit: Mbps
Create new propagation data for the capacity map and display the contour plot.
pdCapacity = propagationData(lats,lons,"Capacity",capacity);
sv2 = siteviewer("Name","Capacity map");
legendTitle = "Capacity" + newline + "(Mbps)";
contour(pdCapacity,"LegendTitle",legendTitle);
% Trim grid locations to those which are within data range
[datalats, datalons] = rfprop.internal.MapUtils.georange(...
    txs, gridlats(:), gridlons(:), datarange, terrainSource);
%   propagationData properties:
%  **由输入的经纬度等数据,生成对应的列表,没有插值计算 **
%      Name             - Propagation data name
%      Data             - Propagation data table (read-only)
%      DataVariableName - Name of data variable to plot
%
%   propagationData methods:
%
%      plot            - Display RF propagation data in Site Viewer
%      contour         - Display contour map of RF propagation data in Site Viewer
%      location        - Coordinates of RF propagation data
%      getDataVariable - Get data variable values
%      interp          - Interpolate RF propagation data
% coverage contour plot 都是利用对应的经纬度值和对应的值,进行插值,绘制等高线,着色。
% Create temp image file and mark for deletion on close of Site Viewer
fileLoc = [tempname, '.png'];
imwrite(imageRGB, fileLoc, 'Alpha', imageAlpha);
viewer.addTempFile(fileLoc);


% Add image
iv = viewer.Instance.GlobeViewer.getViewer("Image");
[~, imageDescriptor] = iv.buildPlotDescriptors(fileLoc, [latmin, lonmin, latmax, lonmax], ...
    "Transparency", transparency, ...
    "ID", {pd.contourID}, ...
    "Animation", animation);
composite.addGraphic("image", imageDescriptor);
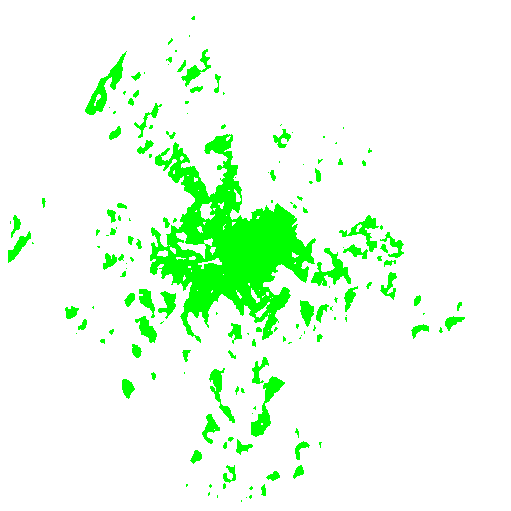
视线插值,Converage调用contour,绘制一个PNG格式的图片加载到地图上。
% Generate lat/lon grid for contour map image,产生插值的数据
[lonmin,lonmax] = bounds(lons);
[latmin,latmax] = bounds(lats);
imlonsv = linspace(lonmin,lonmax,imageSize(2));
imlatsv = linspace(latmin,latmax,imageSize(1));
[imlons,imlats] = meshgrid(imlonsv,imlatsv);
imlons = imlons(:);
imlats = imlats(:);
% Create image data grid using interpolation. Query for locations within 对应的网格插值(对应的范围内(圆圈范围))
% range of any transmitter site, or otherwise use NaN.
cdata = nan(imageSize);
cdata(isInRange) = interp(pd,imlats(isInRange),imlons(isInRange), ...
    'DataVariableName',dataVariableName);
cdata = flipud(cdata); % Start data columns from north instead of south
propagationData % 产生表的数据
rfprop.internal.MapUtils.greatCircleDistance

        % Trim locations to those which are within range
            isInDataRange = any(isInDataRange,2);
            lats = lats(isInDataRange);
            lons = lons(isInDataRange);
   radius = rfprop.Constants.SphericalEarthRadius;
            [d, az] = map.geodesy.internal.greatCircleDistance(lat1, lon1, lat2, lon2, radius);

% Trim grid locations to those which are within data range 可以利用此 函数求出对应的面积
[datalats, datalons] = rfprop.internal.MapUtils.georange(...
    txs, gridlats(:), gridlons(:), datarange, terrainSource);%%% 由细分经纬度矩形网格和辐射距离,裁剪成圆形

% Convert grid resolution to angular resolution radials using chord 网格分辨率转换成辐射线的分辨率
% math, where grid res is the chord length. Adjust to next lower value
% that uniformly divides 360 degrees.
txsnumradials = zeros(numTx,1);
for txInd = 1:numTx
    chordang = 2*asind(res/(2*datarange(txInd))); % 弧度分辨率转换成角度分辨率
    txsnumradials(txInd) = ceil(360/chordang);% 转换成辐射线的数目
end
计算覆盖范围步骤:
(一)、按照分辨率求出对应的接收机位置坐标,以及接收到的功率
- 发射机的位置、功率,及接收点的功率、增益,损耗,求出通信距离;
- 有发射机的位置、通信距离求出四个点的边界坐标;
- 有四个点的边界坐标和分辨率求出对应的细分矩形网格坐标;
- 矩形网格坐标和通信距离,求出圆形范围内的坐标(对矩形进行裁剪为圆形,即求出在圆圈范围的坐标值);(此时为网格状分布 grid分布)
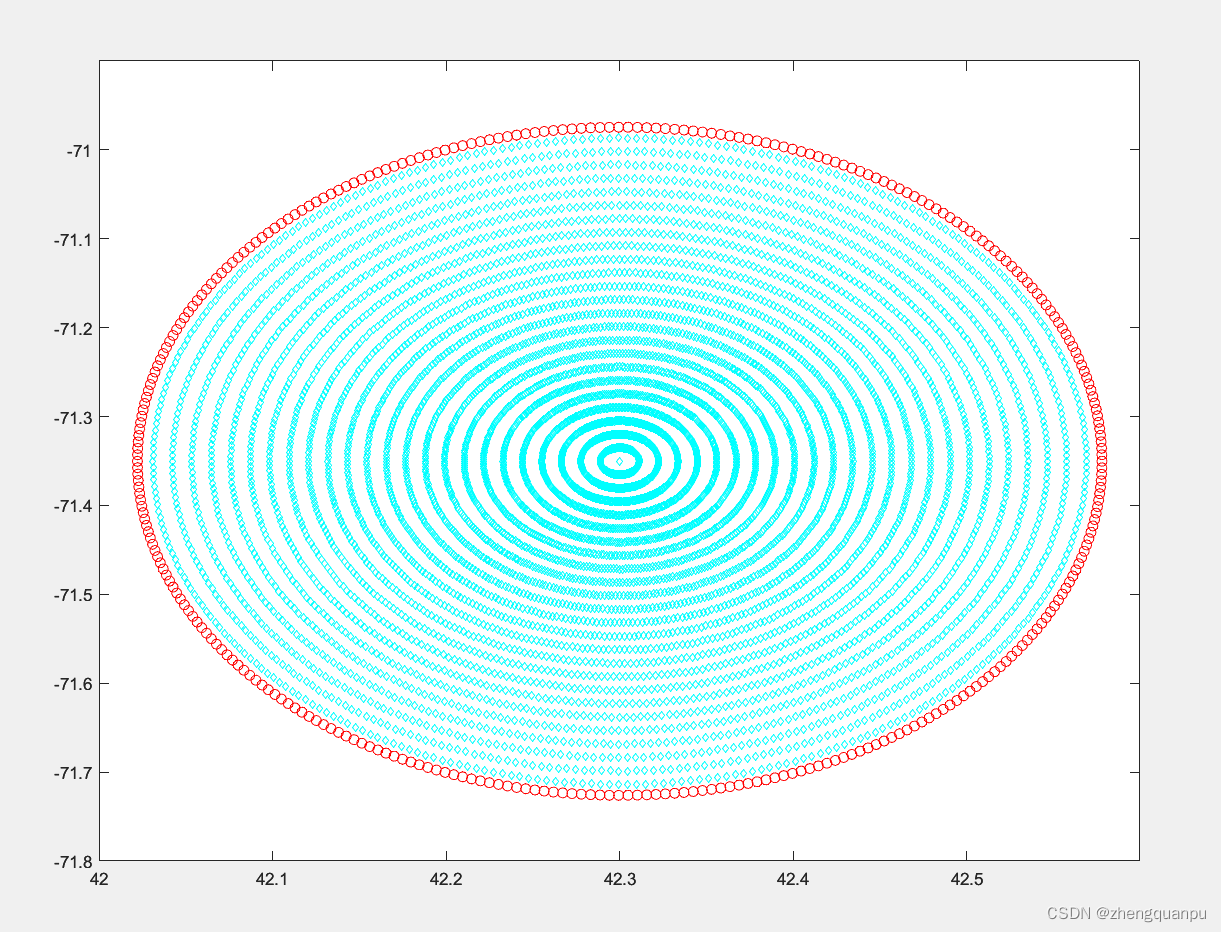
- 也可按照地形分辨率res,即分辨率res对应的弧长进行求解,此时弧长分辨率对应的角度,此时为辐射状均匀分布。(表示中心一个发射机,按照不同半径的圆圈上进行布置接收机,求出此时的接收机在不同传播模型下的接收到功率,此时的接收到的功率收到不同传播模型的影响);
- 打包形成数据 pd,包含位置坐标和对应的功率。
(二)、 着色。
- 已知经纬度的范围(四个角)和图片的尺寸,对图片进行切分,形成网格;
imlonsv = linspace(lonmin,lonmax,imageSize(2));
imlatsv = linspace(latmin,latmax,imageSize(1));
- 对矩形网格进行裁切成满足一定长度圆形;
isInRange = any(gc <= maxrange,2);
- 对步骤一形成的打包数据 pd 在圆圈范围内坐标进行插值,形成圆圈范围内的功率值 cdata ;
cdata = nan(imageSize);
cdata(isInRange) = interp(pd,imlats(isInRange),imlons(isInRange), ...
    'DataVariableName',dataVariableName);
- 对形成的功率值 cdata 阶梯离散化;
cdata = pd.discretizeDataToLevels(cdata, levels);
- 把对应的阶梯离散化数据映射成RGB数据;
% Create image data matrix, mapping color data to RGB values
[imageRGB, legendColors, legendColorValues] = rfprop.internal.ColorUtils.dataColors(...
    cdata, useColors, colors, cmap, clim, levels, showLegend);
- 设置图片无数据的地方为透明;
% Create transparency matrix (make clear where data is NaN)
imageAlpha = ones(size(imageRGB,1),size(imageRGB,2));
imageAlpha(isnan(cdata)) = 0;
- 生成临时文件图片;
% Create temp image file and mark for deletion on close of Site Viewer
fileLoc = [tempname, '.png'];
imwrite(imageRGB, fileLoc, 'Alpha', imageAlpha);
viewer.addTempFile(fileLoc);
- 图片加载的对应位置坐标的地形上,进行显示。
- 分辨率,自动生成分辨率和指定分辨率。自动分辨率的计算方法为:最通信距离的2倍,除99,即把最大距离50等分。最大通信距离的计算为:当接收到的信号强度最小时,传播的距离。
 % Use default value for terrain prop model
function maxrange = validateMaxRange(p, type, pm, txs, txslatlon, strengths, rxGain, map)
 maxrange(k) = range(txs(k), ss, rxGain(k), type, pm);
  d = 2*max(maxrange);
  gridLength = 99;
 res = d / gridLength;
- 由距离分辨率转换成对应的经纬度矢量
由分辨率求出对应的经纬度网格状间隔
% Convert resolution from geodesic meters to degrees.
% 由分辨率转换成经纬度的间隔值
 if (latNorth >= 0) && (latSouth <= 0) % Range goes through Equator 赤道
                latRadius = earthR;
            else
                largestLat = mean([abs(latNorth), abs(latSouth)]);
                latRadius = cosd(largestLat) * earthR;
            end
            resDegLon = rad2deg(res/latRadius);% 对应的角度分辨率

            % Use linspace to guarantee endpoints of grid are the geo boundaries
            numlonv = floor(abs(diff([lonWest, lonEast])) / resDegLon);
            numlatv = floor(abs(diff([latNorth, latSouth])) / resDegLat);
            %%% 指定分辨率的经纬度值
            lonv = linspace(lonWest, lonEast, numlonv); % Longitude is angle in x-direction
            latv = linspace(latNorth, latSouth, numlatv); % Latitude is angle in y-direction
            numGridEl = numel(lonv)*numel(latv);
          %  然后在生成网格经纬度
              [gridlats, gridlons] = meshgrid(lonv, latv);

% Trim grid locations to those which are within data range 裁剪在范围之内
[datalats, datalons] = rfprop.internal.MapUtils.georange(...
    txs, gridlats(:), gridlons(:), datarange, terrainSource);
  % Trim grid locations to those which are within data range 裁剪在范围之内
        function [lats, lons] = georange(sites, lats, lons, datarange, terrainSource)
            % Return locations within range of sites

            % Return early if no sites
            if isempty(lats) || isempty(lons)
                return
            end

            % Compute great circle range
            gc = nan(numel(lats),numel(sites));
            for siteInd = 1:numel(sites)
                site = sites(siteInd);
                lat = double(site.Latitude);
                lon = wrapTo180(double(site.Longitude));
                gc(:,siteInd) = rfprop.internal.MapUtils.greatCircleDistance(lat, lon, lats, lons);
            end

            % Apply data range
            isInDataRange = gc <= datarange;

            % Apply terrain range
            if ~strcmp(terrainSource,'none')
                latLimits = terrainSource.LatitudeLimits;
                lonLimits = terrainSource.LongitudeLimits;
                if ~isequal(latLimits,[-90 90]) || ~isequal(lonLimits, [-180 180])
                    outOfTerrainRange = terrainSource.isOutOfRange(lats,lons);
                    isInDataRange = isInDataRange & ~outOfTerrainRange;
                end
            end

            % Trim locations to those which are within range
            isInDataRange = any(isInDataRange,2);
            lats = lats(isInDataRange);
            lons = lons(isInDataRange);
        end
由分辨率求出对应的经纬度辐射状间隔
步骤:
1.由分辨率对应的弧长,求出该弧长对应的角度;
2.由对应的角度和长度,生成对应的经纬度;
3.经纬度满足在最大通信范围之内;(即得出最外圈的坐标值)
4.最外圈的坐标值和发射机的坐标,在地球上构成最大弧长,对最大弧长按照分辨率进行均分;
5.由对应的坐标,即为对应的接收机的位置,求出对应的接受信号强度;
6.把对应的图片的大小即为此时对应接收机的边框位置;
[lonmin,lonmax] = bounds(lons);
[latmin,latmax] = bounds(lats);
imlonsv = linspace(lonmin,lonmax,imageSize(2));
imlatsv = linspace(latmin,latmax,imageSize(1));
7.裁剪图片在对应的圆圈范围之内(isInRange);
8.求出对应的插值;(pd包含原来求出的圆形辐射的位置坐标和辐射强度值)
cdata(isInRange) = interp(pd,imlats(isInRange),imlons(isInRange), ...
    'DataVariableName',dataVariableName);
9.把对应的数据离散化,映射到色彩范围之内。
   n = max(1, ceil(S0/dS));
    S = S0 * transpose(((0 : n) / n));
5.由起始坐标和指定长度,指定方位,求出对应的坐标。
%%% 由分辨率弧长求出对应的角度,由角度求出对应的辐射线条数目
 chordang = 2*asind(res/(2*datarange(txInd)));
    txsnumradials(txInd) = ceil(360/chordang);
%%% 计算最远端圆上的经纬度值
 % Compute end location for each radial by creating a vector of
    % candidate end locations (spaced by gridres) and choosing the
    % furthest one that is within range of any site.
    endlats = zeros(numradials,1);
    endlons = zeros(numradials,1);
    raddists = res:res:maxraddist; % Candidate end locations
    numangs = numradials;
    for angInd = 1:numangs
        % Trim candidate end locations to those within range
        [raddistlats, raddistlons] = rfprop.internal.MapUtils.greatCircleForward(...
            txlat, txlon, raddists, angs(angInd));% 对固定点指定距离和角度的经纬度坐标
        [raddistlats, raddistlons] = rfprop.internal.MapUtils.georange(...
            txs, raddistlats, raddistlons, datarange, terrainSource); % 在圆内的点

        if isempty(raddistlats)
            % Skip radial since there is no value on it within range
            numradials = numradials - 1;
        else
            % Select furthest location as radial end location
            endlats(angInd) = raddistlats(end);
            endlons(angInd) = raddistlons(end);
        end
    end
三、覆盖面积的计算
后记测试U:
再由此时的经纬度和接收到的功率,绘制等高线图,填充不同的颜色)
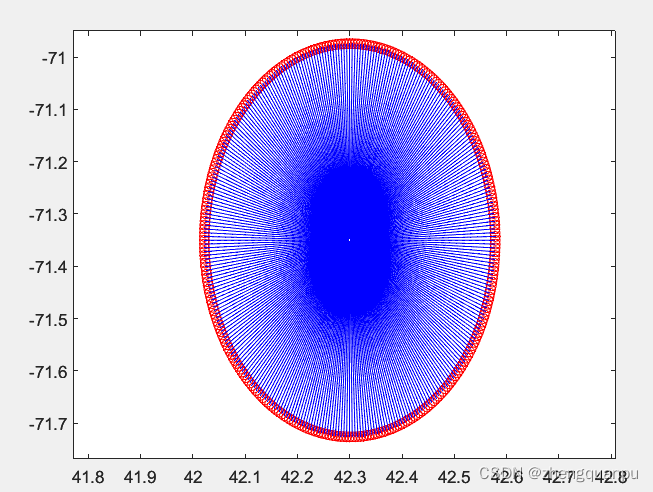
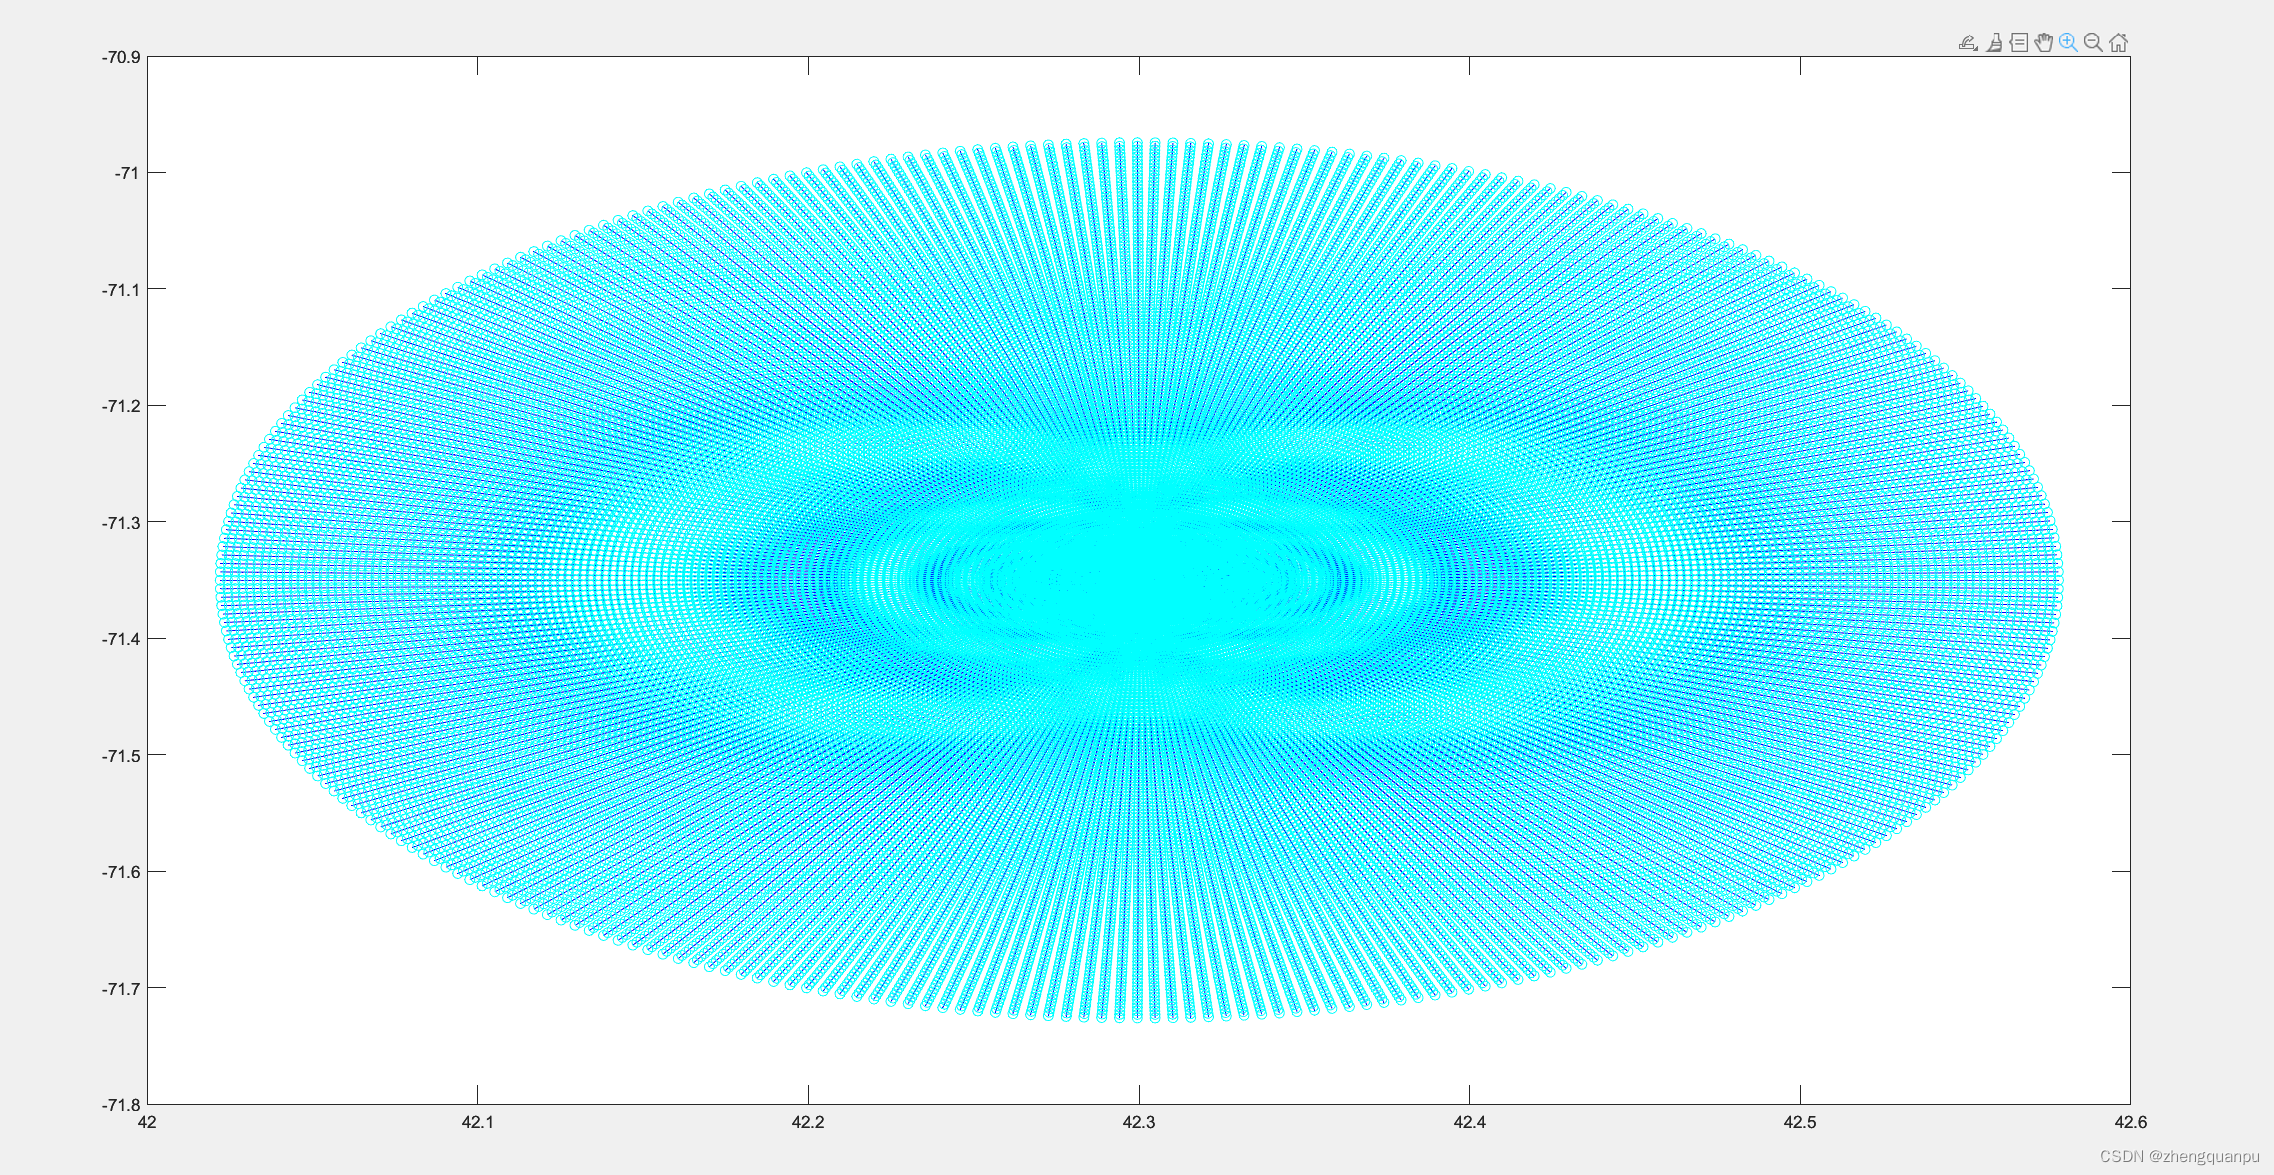
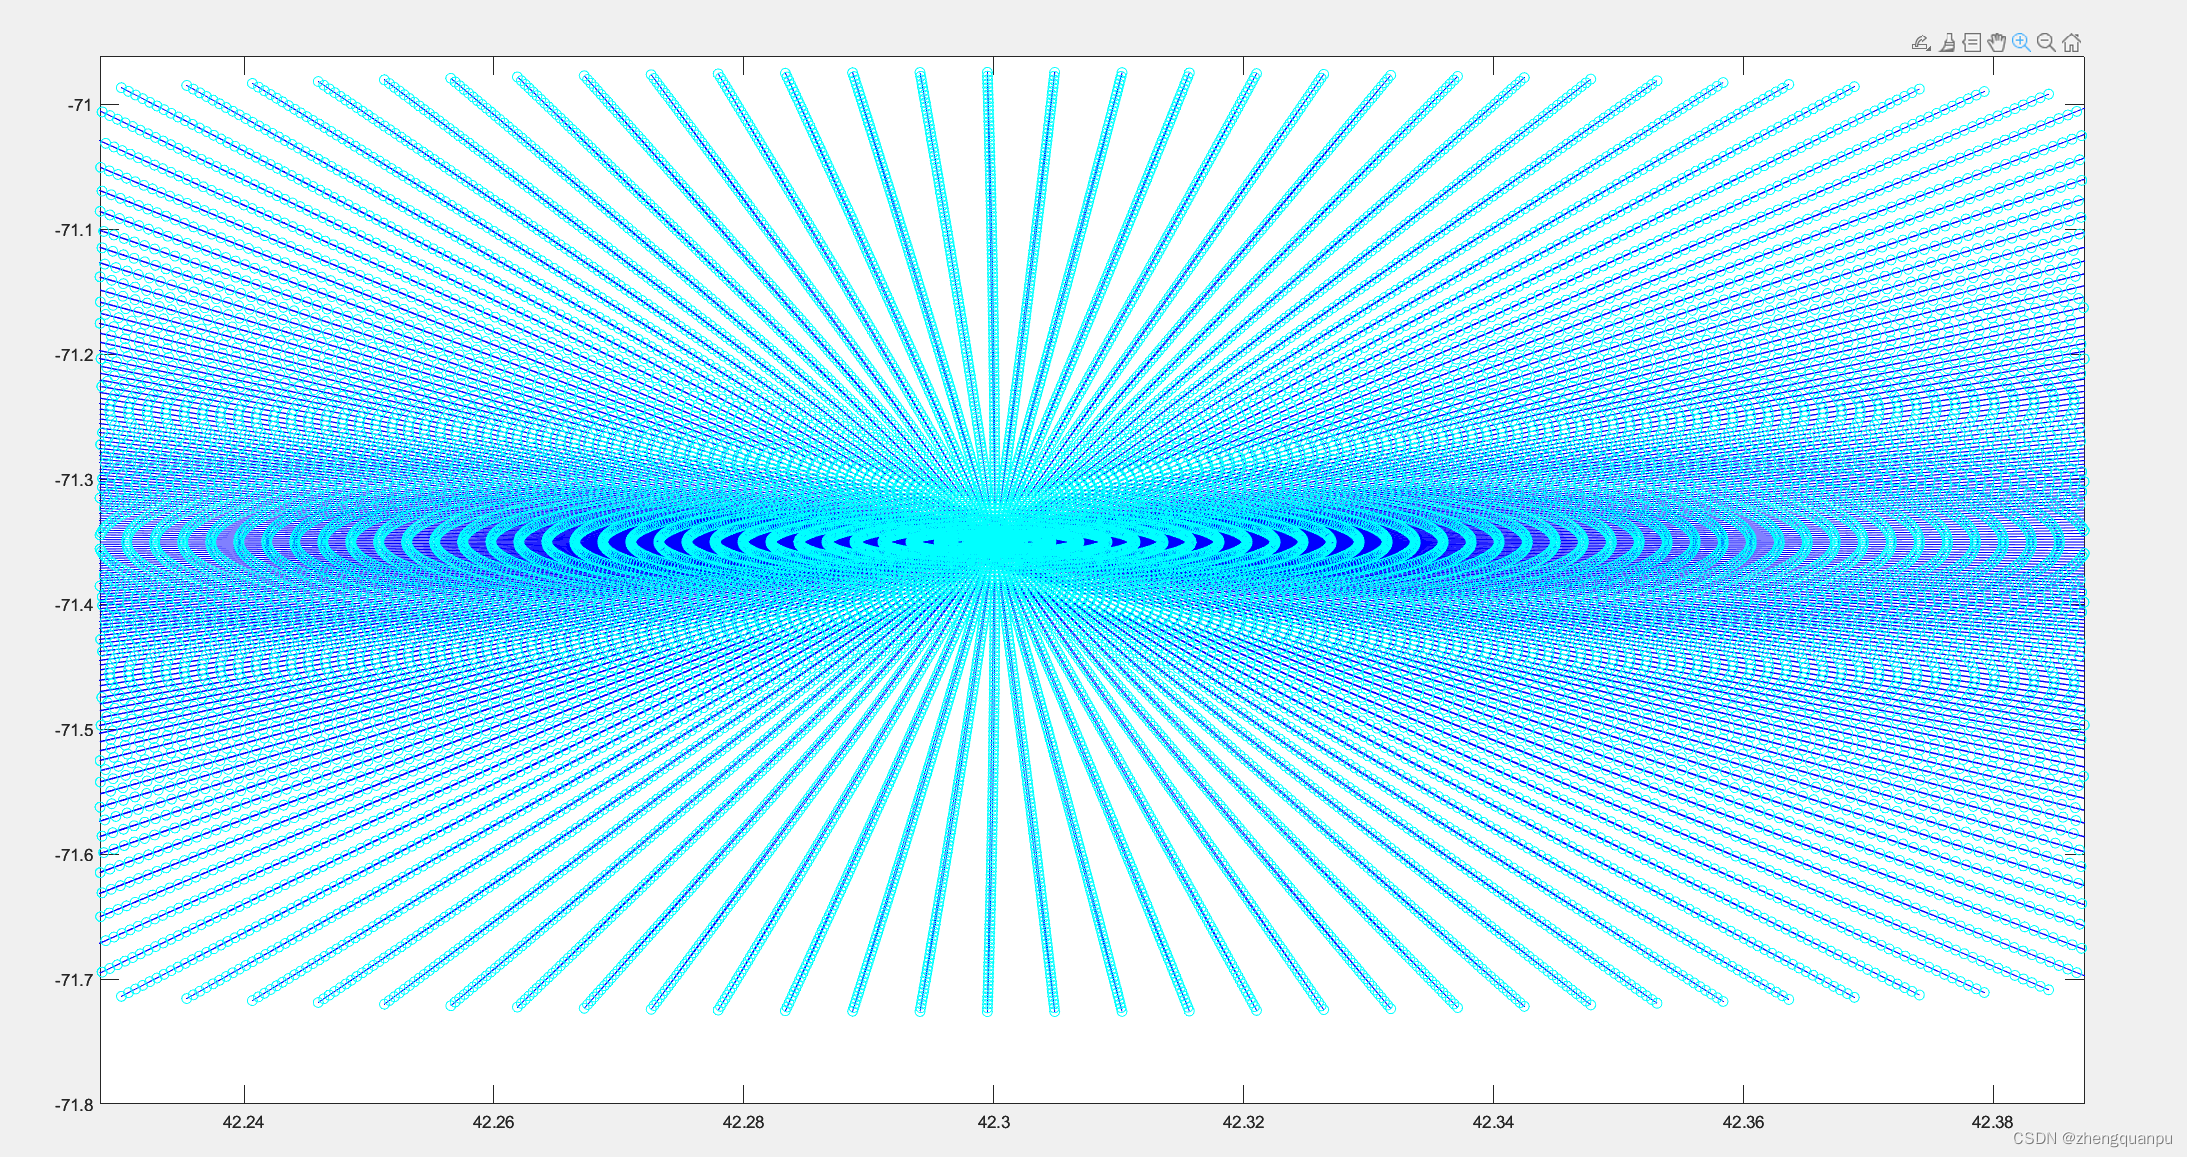
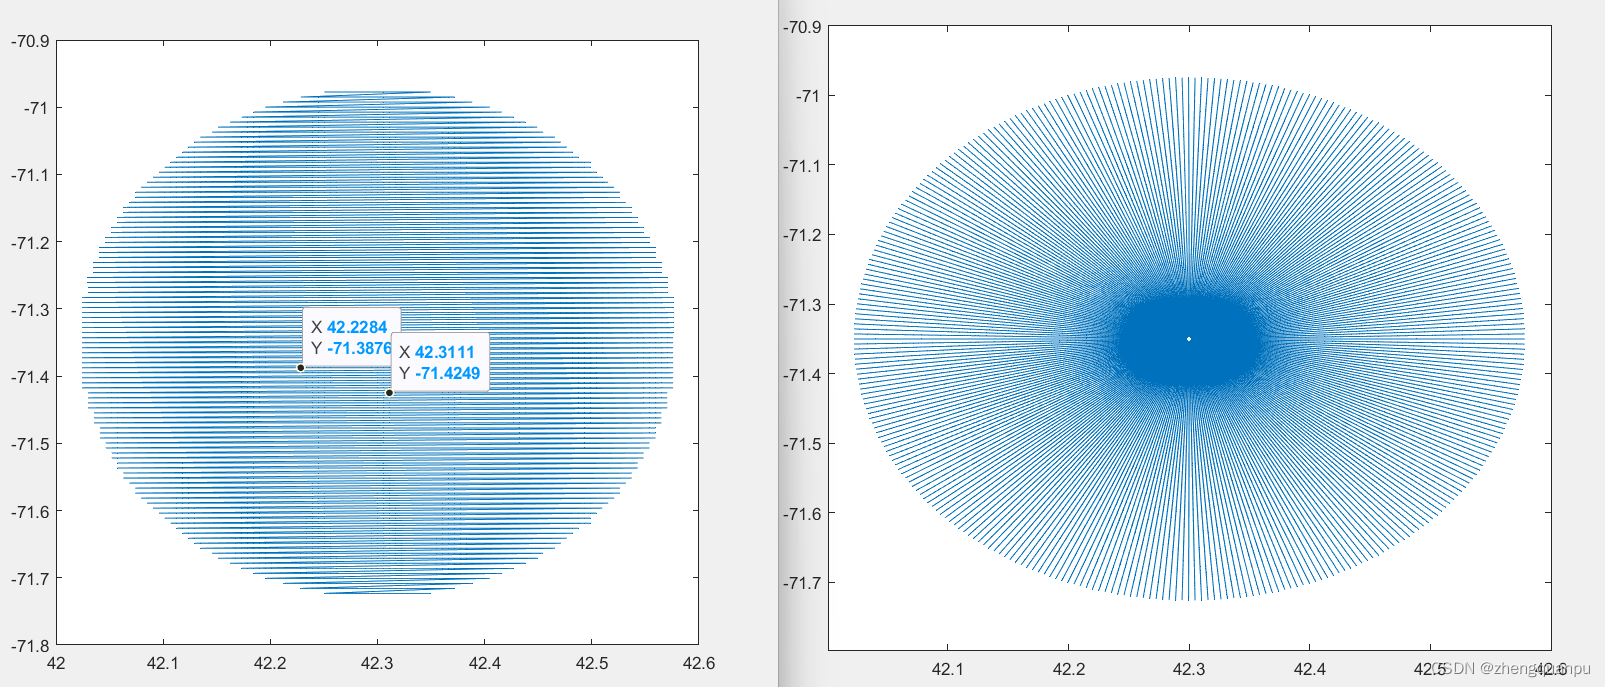
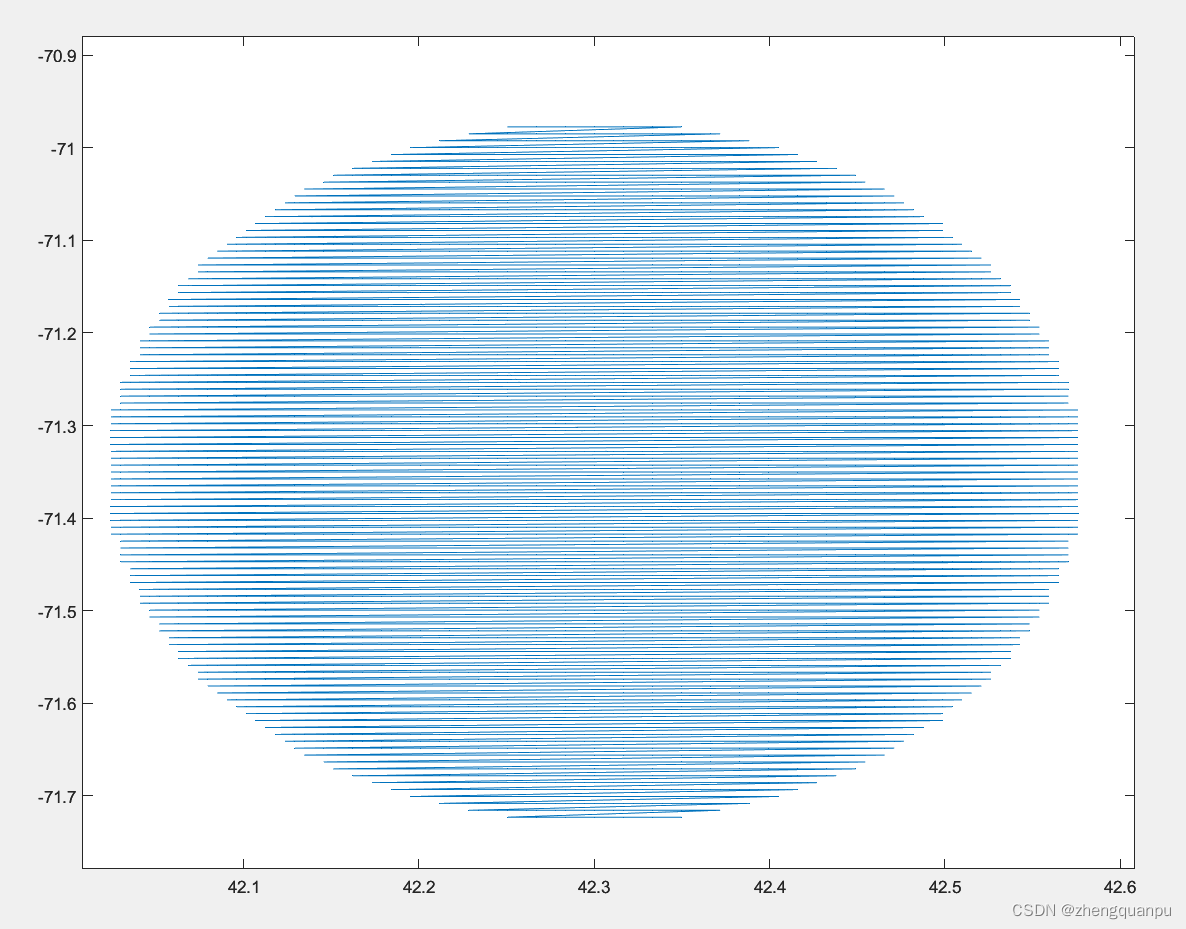
绘制直线网格和辐射线,两种不同的方式
r = range(propmodel,tx,pl)
% Range of radio wave propagation
pl = pathloss(propmodel,rx,tx)
% Path loss of radio wave propagation

pm = propagationModel("freespace");
tx = txsite("Name","Apple Hill","Latitude",42.3001,"Longitude",-71.3604);
coverage(tx,pm)
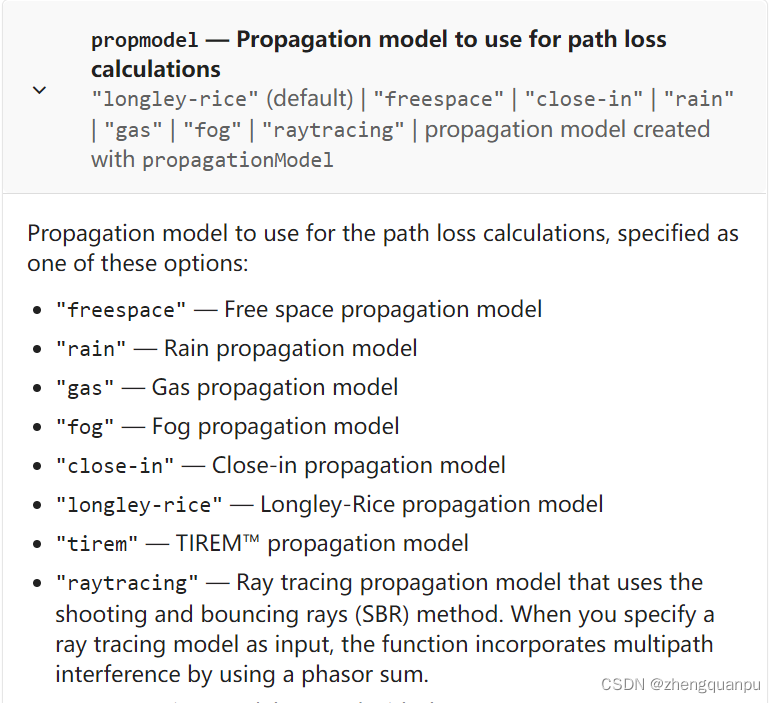
Longley Rice传播模型。该模型也称为不规则地形模型(ITM)。可以使用此模型计算不规则地形(包括建筑物)上站点之间的点对点路径损耗。路径损耗由自由空间损耗、地形衍射、地面反射、大气折射、对流层散射和大气吸收计算得出。
Longley Rice模型实现了模型的点对点模式,该模式使用地形数据来预测两点之间的损失。
在20 MHz至20 GHz范围内有效。
计算自由空间损耗、地形和障碍物衍射、地面反射、大气折射和对流层散射的路径损耗。
通过结合物理和经验数据提供路径损耗估计。
‘tirem’ — Terrain Integrated Rough Earth Model™ (TIREM™). “‘tirem’ -地形综合粗糙地面模型. 可以使用此模型计算不规则地形(包括建筑物)上站点之间的点对点路径损耗。路径损耗由自由空间损耗、地形衍射、地面反射、大气折射、对流层散射和大气吸收计算得出。该模型需要访问外部TIREM库。实际模型在1MHz至1000GHz范围内有效。但使用天线工具箱™ 频率范围被限制在200GHz。
RayTracing一种多路径传播模型,使用光线跟踪分析来计算传播路径和相应的路径损耗。路径损耗由自由空间损耗、材料引起的反射损耗和天线极化损耗计算得出。可以使用拍摄和反弹光线(SBR)方法或图像方法执行光线跟踪分析。使用“method”属性指定方法。SBR方法包括表面反射的影响,但不包括衍射、折射或散射的影响。图像方法仅考虑表面反射。两种光线跟踪方法都适用于100MHz至100GHz的频率范围。有关图像和SBR方法之间的差异的信息,请参见选择传播模型。使用光线跟踪函数计算和绘制站点之间的传播路径。
https://ww2.mathworks.cn/help/antenna/ug/choose-a-propagation-model.html
验证内部不同的参数的正确性和加深理解
tx = txsite('Name','MathWorks Apple Hill', ...
    'Latitude',42.3001,'Longitude',-71.3504, ...
    'TransmitterFrequency', 2.5e9);

rx = rxsite('Name','Fenway Park', ...
    'Latitude',42.3467,'Longitude',-71.0972);

% Create the propagation model for heavy rainfall rate.

pm = propagationModel('rain','RainRate',50)
% pm =
%   Rain with properties:
%
%     RainRate: 50
%         Tilt: 0

% Calculate the pathloss at the receiver using the rain propagation model.

[pl,info] = pathloss(pm,rx,tx)

ss =sigstrength(rx,tx,pm)
%%% 验证发射机传播的功率和计算得到的功率是否相等
powerdiff=abs(pow2db(tx.TransmitterPower)-pl+30-ss)

% pm = propagationModel('rain','RainRate',50)
r = range(pm,tx,pl)

rr=distance(rx,tx)
%%% 验证损耗得出的传播距离和原先设置的距离是否相等
rdiff=abs(r-rr)
%  arclen= 2.1504e+04
[arclen,az] = distance(tx.location,rx.location, referenceEllipsoid('GRS80'))

% pm = propagationModel("freespace");
% tx = txsite("Name","Apple Hill","Latitude",42.3001,"Longitude",-71.3604);
view1=siteviewer;
coverage(tx,rx,pm)

view2=siteviewer;
coverage(tx,rx,pm,'SignalStrengths',-87.5)

link(rx,tx,pm,'SuccessColor','y')
los(tx,rx)

return;
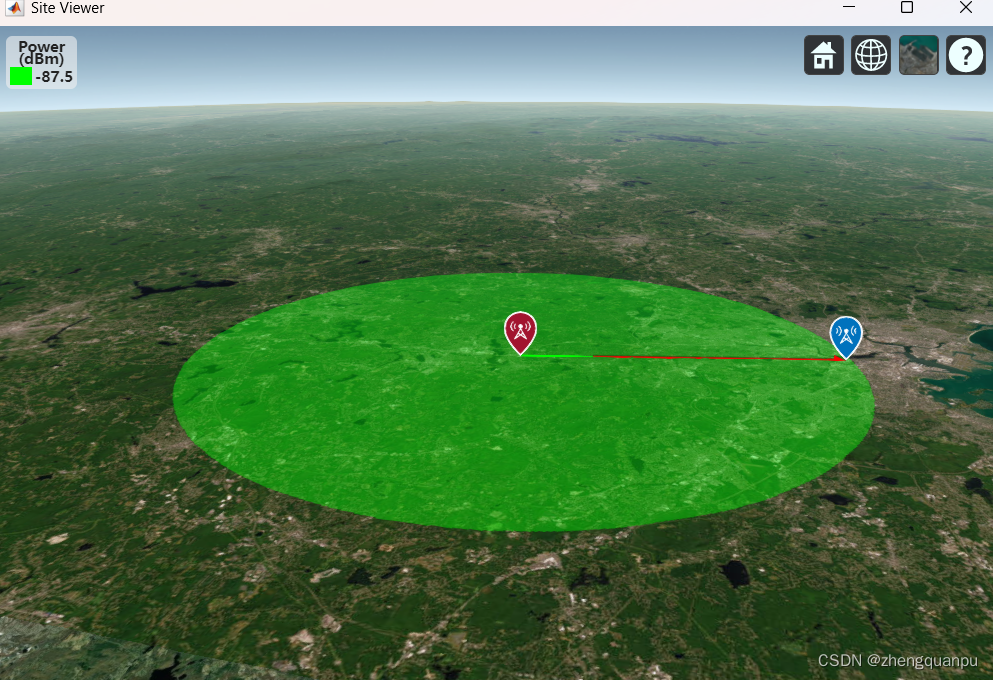
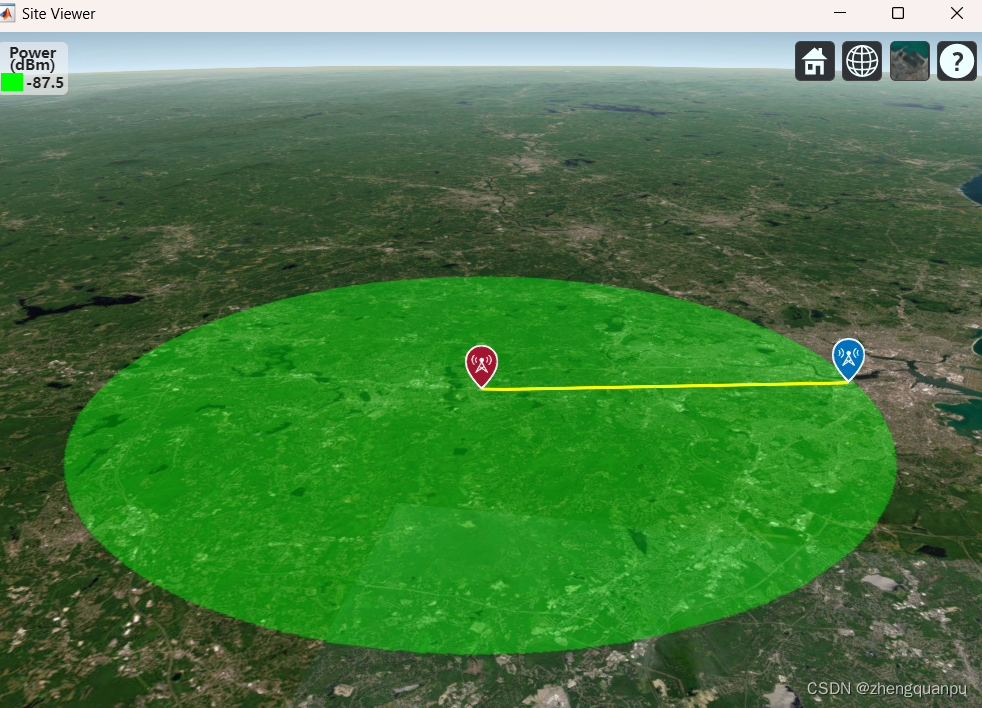
说明:不同通视,但能够通信。
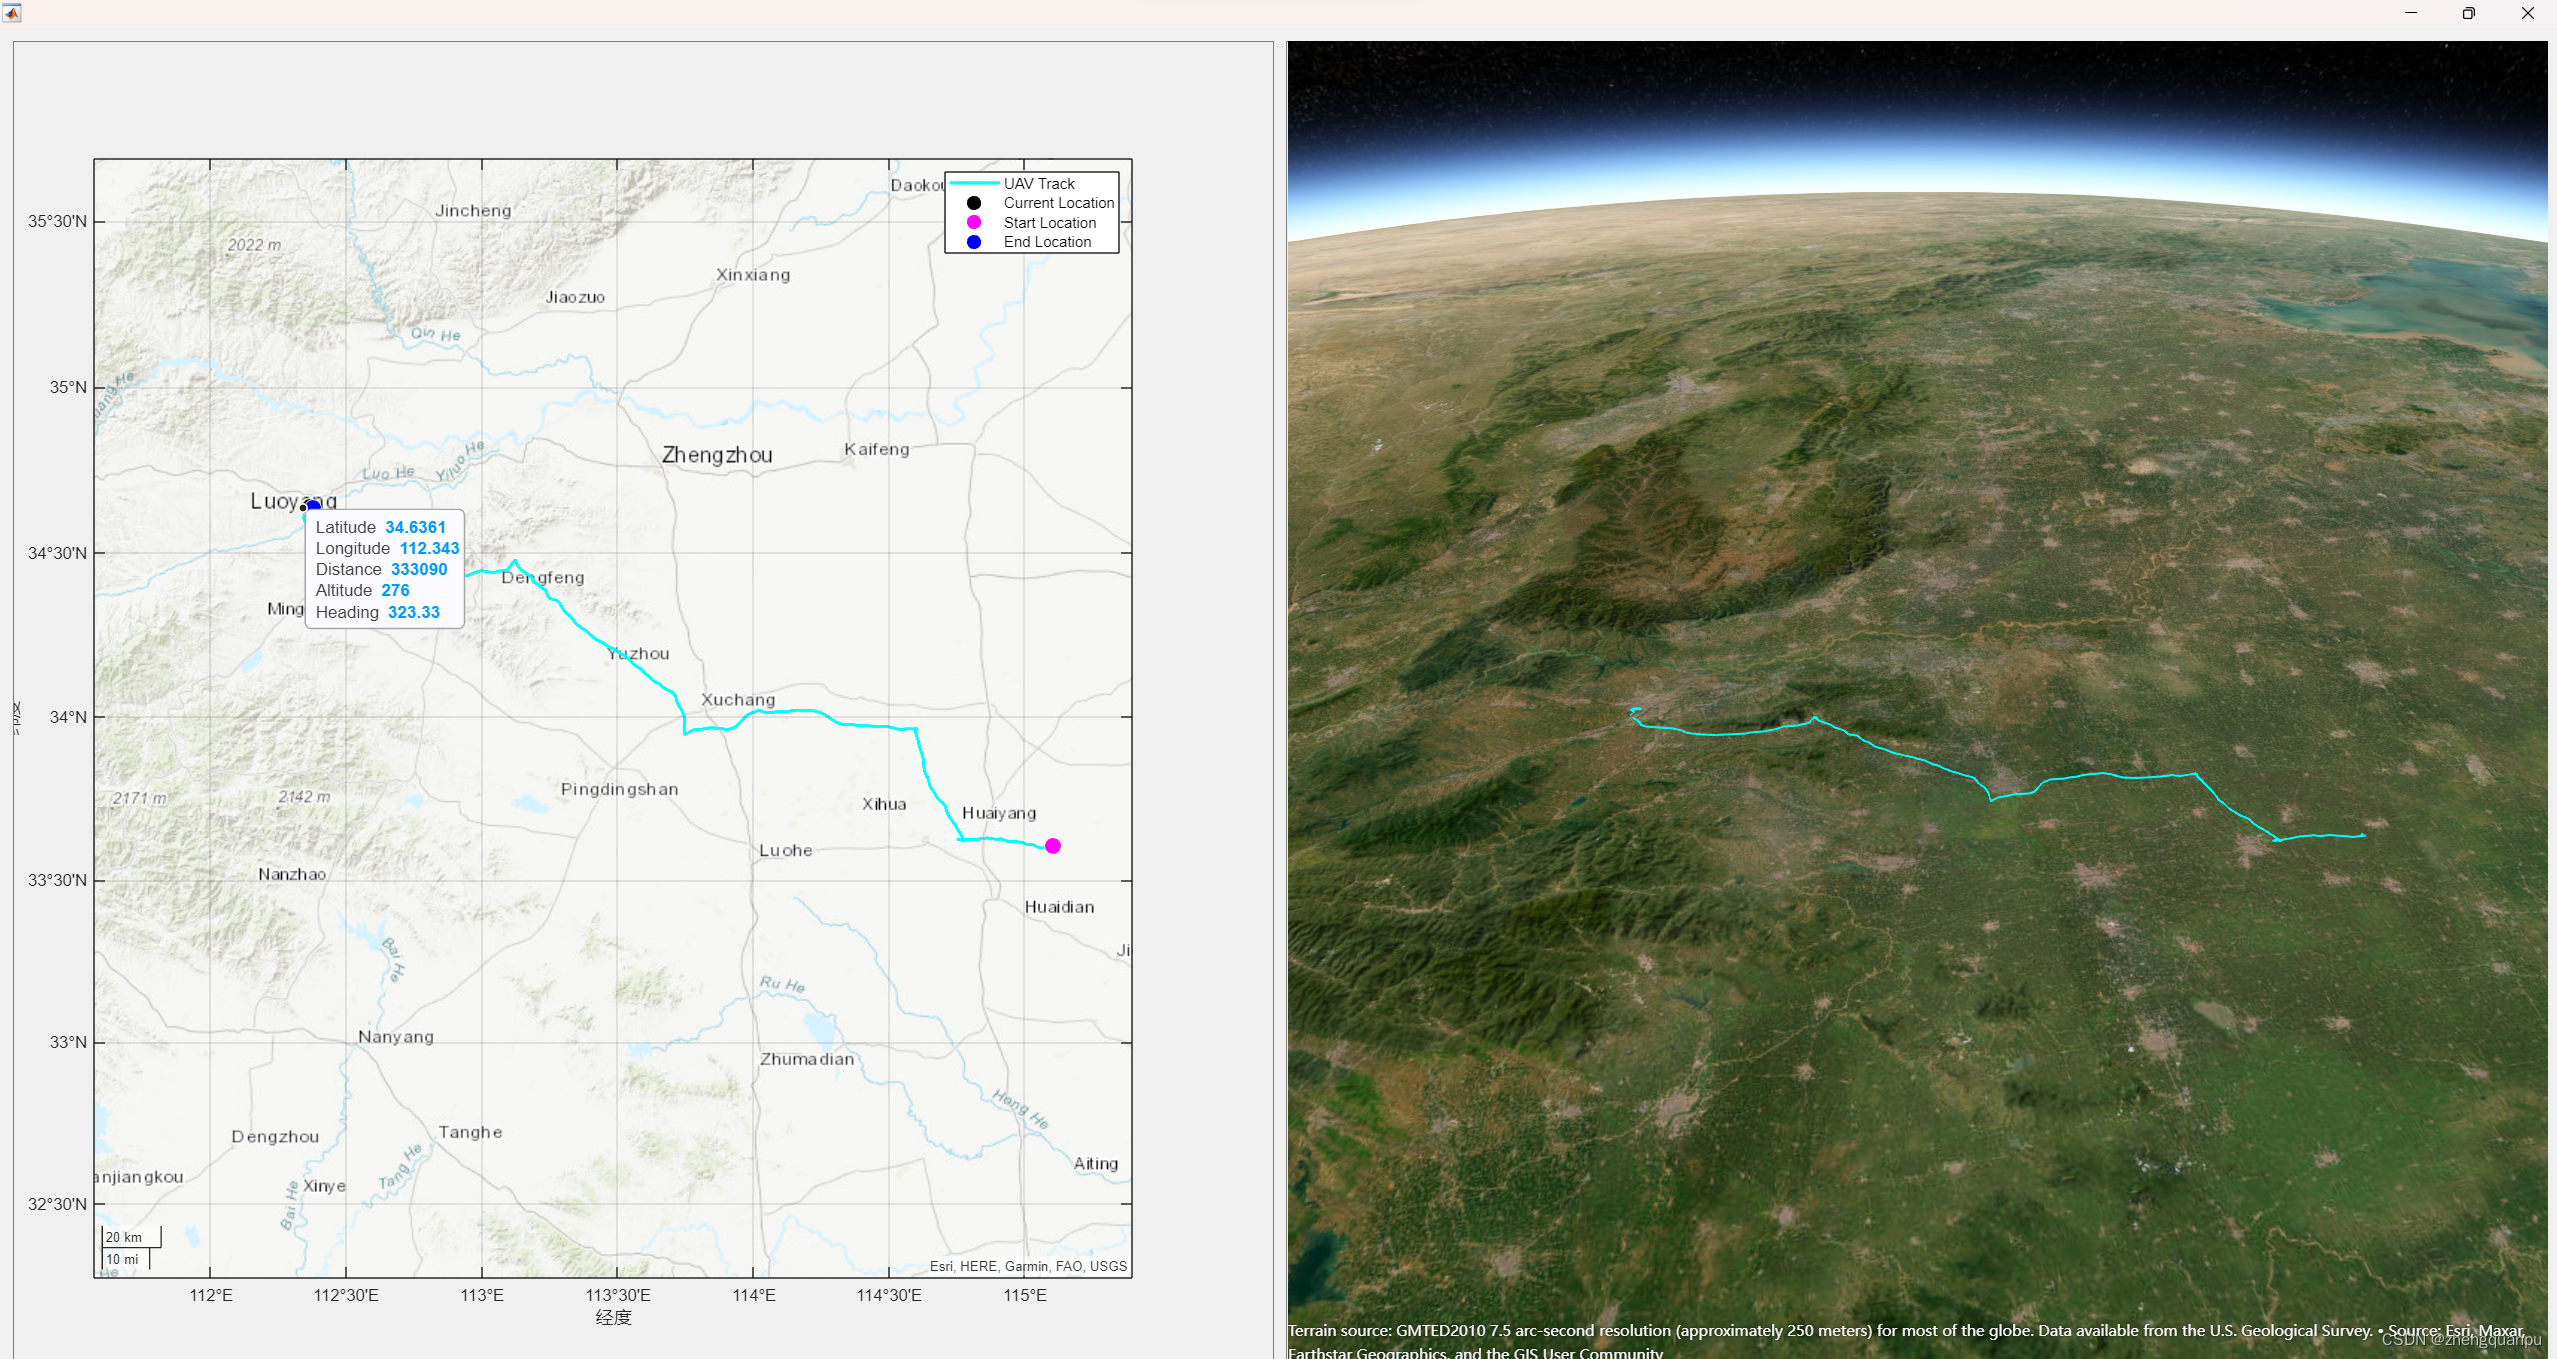
无人机飞行轨迹的 二三维联动
Get Coordinates of Mauna Loa Baseline Observatory
Specify the coordinates of the Mauna Loa Baseline Observatory [2]. The height of the observatory is in meters above mean sea level (MSL).
obslat = 19.5362;
obslon = -155.5763;
obsH = 3397.00;
Get Coordinates of Mauna Loa Volcano
Specify the coordinates of the top of Mauna Loa [3]. The height of the volcano is orthometric and is in meters.
mllat = 19.475;
mllon = -155.608;
mlH = 4169;
figpos = [1000 500 800 400];
uif = uifigure("Position",figpos);
ug = uigridlayout(uif,[1,2]);
p1 = uipanel(ug);
p2 = uipanel(ug);
gx = geoaxes(p1,"Basemap","satellite");
gg = geoglobe(p2);
gx.InnerPosition = gx.OuterPosition;
gg.Position = [0 0 1 1];
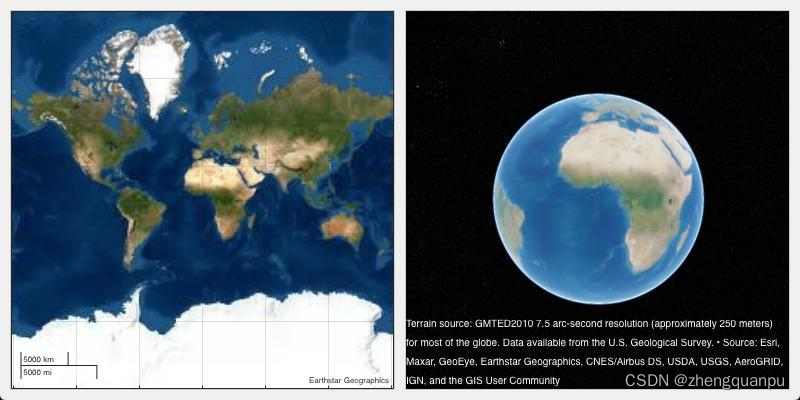
heightAboveTerrain = 200;
gx.MapCenter = [obslat, obslon];
zoomLevel = heightToZoomLevel(heightAboveTerrain, obslat);
gx.ZoomLevel = zoomLevel;

N = egm96geoid(obslat, obslon);
obsh = obsH + N;
ellipsoidalHeight = obsh + heightAboveTerrain;
campos(gg,obslat,obslon,ellipsoidalHeight)
drawnow
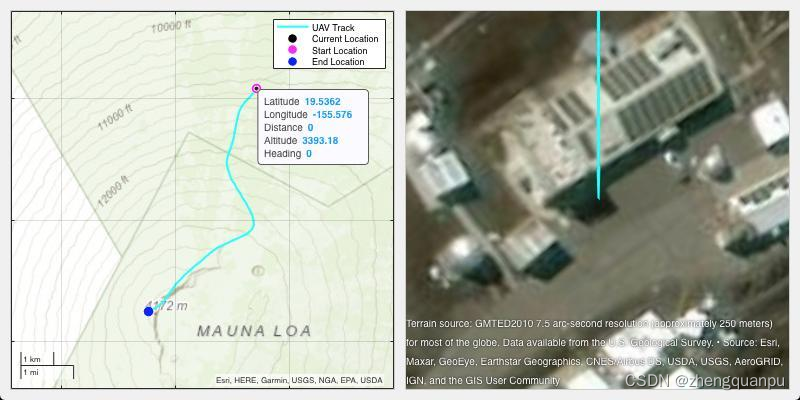
加载轨迹进行显示
% T = readgeotable("sample_uavtrack.gpx","Layer","track_points");
% trk = gpxread('F:\地图数据\2022-02-05+1435+驾车.gpx','FeatureType','track');
T = readgeotable("F:\地图数据\2022-02-05+1435+驾车.gpx","Layer","track_points");
tlat = T.Shape.Latitude';
tlon = T.Shape.Longitude';
talt = T.Elevation';

wgs84 = wgs84Ellipsoid;
theading = azimuth(tlat(1:end-1),tlon(1:end-1),tlat(2:end),tlon(2:end),wgs84);
theading = [theading(1);theading(:)];
Calculate the cumulative distance for the UAV flight track. The distance function does not take into account changes in elevation or altitude. In order to calculate the distance the UAV moves from point to point in 3-D, you need to work in geocentric Cartesian coordinates (X, Y, Z). Compute the point-to-point offset components (in meters) using the ecefOffset function. The altitude data of the UAV flight is referenced to the mean sea level. To use the ecefOffset function, the heights must be referenced to the ellipsoid. Convert the orthometric heights of the flight track to ellipsoidal height (relative to the WGS84 ellipsoid). All heights are in meters.
N = egm96geoid(tlat,tlon);
h = talt + N;

lat1 = tlat(1:end-1);
lat2 = tlat(2:end);
lon1 = tlon(1:end-1);
lon2 = tlon(2:end);
h1 = h(1:end-1);
h2 = h(2:end);
[dx,dy,dz] = ecefOffset(wgs84,lat1,lon1,h1,lat2,lon2,h2);

Calculate the Euclidean distance between each pair of adjacent points using the hypot function. The distance is in meters.
distanceIncrementIn3D = hypot(hypot(dx, dy), dz);
Compute cumulative distance in 3-D and the total distance in meters.
cumulativeDistanceIn3D = cumsum(distanceIncrementIn3D);
totalDistanceIn3D = sum(distanceIncrementIn3D);
fprintf("Total UAV track distance is %f meters.\n",totalDistanceIn3D)
Assign a variable for the cumulative distance to be used for plotting the animation.
tdist = [0 cumulativeDistanceIn3D];
geoplot3(gg,tlat,tlon,talt,"c","LineWidth",2,"HeightReference","geoid")
ptrack = geoplot(gx,tlat,tlon,"c","LineWidth",2);

[clat,clon,cheight] = campos(gg);
gx.MapCenter = [clat,clon];
gx.ZoomLevel = heightToZoomLevel(cheight, clat);
drawnow

campos(gg,tlat(1),tlon(1))
camheight(gg,talt(1) + 75)
campitch(gg,-90)
camheading(gg,theading(3))

hold(gx,"on")
marker = geoplot(gx,tlat(1),tlon(1),"ow","MarkerSize",10,"MarkerFaceColor","k");
mstart = geoplot(gx,tlat(1),tlon(1),"ow","MarkerSize",10,"MarkerFaceColor","magenta");
mend = geoplot(gx,tlat(end),tlon(end),"ow","MarkerSize",10,"MarkerFaceColor","blue");

marker.DisplayName = "Current Location";
mstart.DisplayName = "Start Location";
mend.DisplayName = "End Location";
ptrack.DisplayName = "UAV Track";
legend(gx)

View the topology of the region by changing the basemap.
gx.Basemap = "topographic";

dt = datatip(ptrack,"DataIndex",1,"Location","southeast");
dtrow = dataTipTextRow("Distance",tdist);
dtrow(end+1) = dataTipTextRow("Altitude",talt);
dtrow(end+1) = dataTipTextRow("Heading",theading);
ptrack.DataTipTemplate.DataTipRows(end+1:end+3) = dtrow;
pitch = -2.7689;
campitch(gg,pitch)

for k = 2:200:(length(tlat)-1)
    campos(gg,tlat(k),tlon(k))
    camheight(gg,talt(k)+100)
    camheading(gg,theading(k))

    set(marker,"LatitudeData",tlat(k),"LongitudeData",tlon(k));
    dt.DataIndex = k;

    drawnow
    pause(.3)
end

campos(gg,tlat(end),tlon(end),talt(end)+100)
dt.DataIndex = length(tlat);
View a 360-Degree Panorama from Top of Mauna Loa Volcano
View a 360-degree panorama from the top of Mauna Loa by rotating the camera heading 360 degrees. Rotate clockwise with a step size of 5-degrees and start at the next 5 degree step. Update the heading data tip.
initialHeading = camheading(gg);
increment = 5;
initialHeading = initialHeading + (increment - mod(initialHeading,increment));

filename = 'panoramic.gif';
for degree = initialHeading:increment:initialHeading+360
    heading = mod(degree,360);
    ptrack.DataTipTemplate.DataTipRows(end).Value(dt.DataIndex) = heading;
    camheading(gg,heading);
    drawnow
end
%   内部函数
function zoomLevel = heightToZoomLevel(height, lat)
    earthCircumference = 2 * pi * 6378137;
    zoomLevel = log2((earthCircumference *cosd(lat)) / height) + 1;
    zoomLevel = max(0, zoomLevel);
    zoomLevel = min(19, zoomLevel);
end
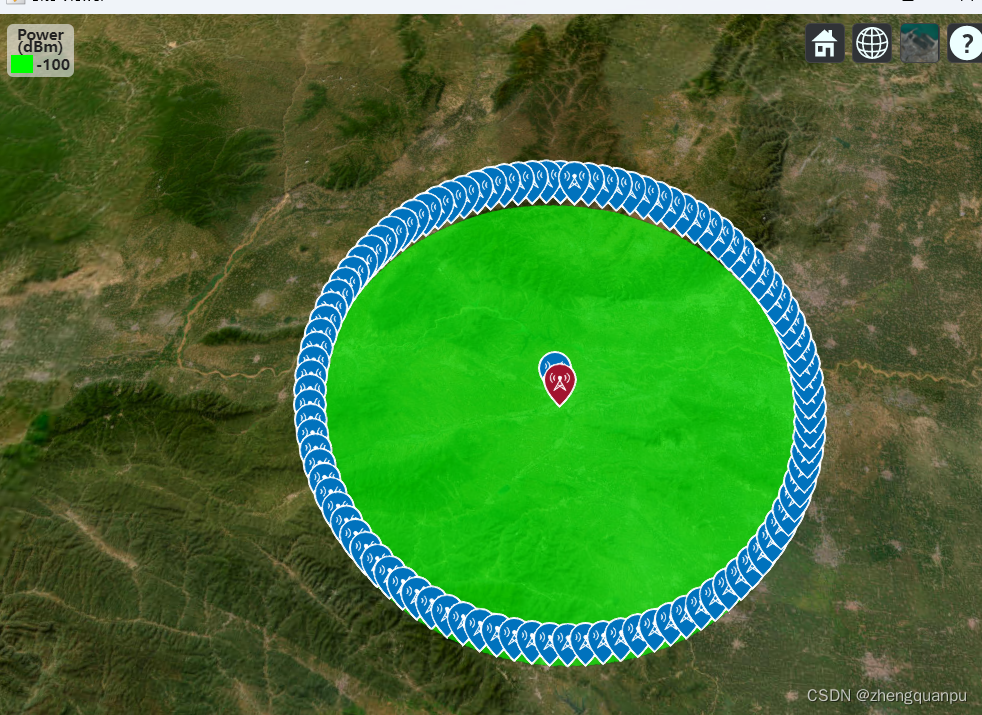
tx=txsite; rx=rxsite;
Pt=pow2db(tx.TransmitterPower);
Pr=-100-30;LossdB=Pt-Pr;
% 由自由空间传播损耗公式,直接 推导出对应的距离
lamba=freq2wavelen(tx.TransmitterFrequency);
R0=lamba/(4*pi)*10^(LossdB/20)/1000
% 自带的函数进行计算:由损耗计算距离
pm = propagationModel('freespace');
r1 = range(pm,tx,LossdB)/1000
%计算接收和发射之间的损耗信息
[pl,info] = pathloss(pm,rx,tx)
% 由发射机的位置和对应的距离,进行画圆,求出对应经纬度,
% 再由对应的经纬度和发射点求出对应的⚪半径(距离),
r2 = r1; wgs84 = wgs84Ellipsoid("km");
[lats, lons]=scircle1(tx.Latitude,tx.Longitude,r2,[],wgs84);
R1=distance('gc',[lats,lons],[lat0,lon0],wgs84);
% 绘出对应的覆盖范围和计算出的经纬度绘制的圆圈是否一致
coverage(tx,rx,'PropagationModel','freespace')
rxs=rxsite("Latitude",lats,"Longitude",lons);
show(rxs)
% 验证新的距离信息
[pl,info] = pathloss(pm,rxs,tx);
R2=info.PropagationDistance
return
