一、说明
networkx在02年5月产生,是用python语言编写的软件包,便于用户对复杂网络进行创建、操作和学习。利用networkx可以以标准化和非标准化的数据格式存储网络、生成多种随机网络和经典网络、分析网络结构、建立网络模型、设计新的网络算法、进行网络绘制等。 ——百度百科
Gallery — NetworkX 3.1 documentation
二、简单图操作种种
2.1 简单的无向图
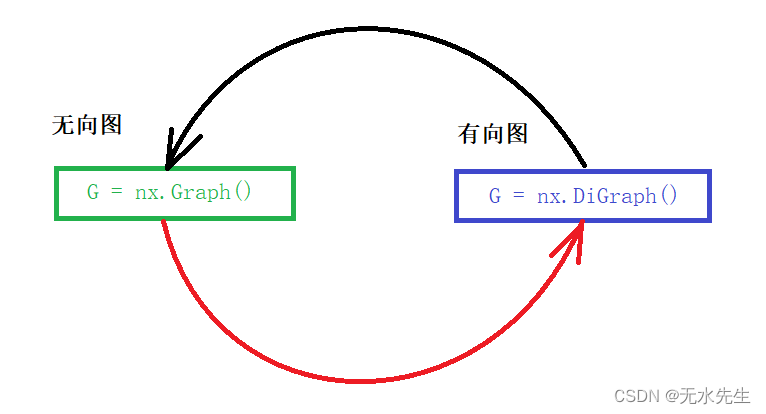
无向图和有向图的区别:在生成图的时候已经选定。
- 效果图:
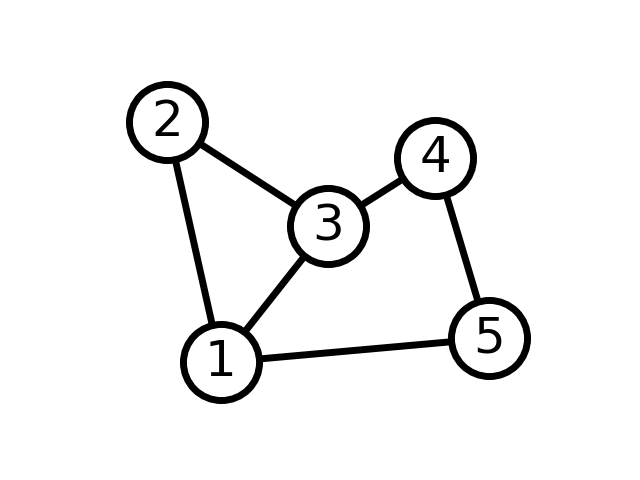
- 代码示例
import networkx as nx
import matplotlib.pyplot as plt

G = nx.Graph()
G.add_edge(1, 2)
G.add_edge(1, 3)
G.add_edge(1, 5)
G.add_edge(2, 3)
G.add_edge(3, 4)
G.add_edge(4, 5)

# explicitly set positions
pos = {1: (0, 0), 2: (-1, 0.3), 3: (2, 0.17), 4: (4, 0.255), 5: (5, 0.03)}

options = {
    "font_size": 36,
    "node_size": 3000,
    "node_color": "white",
    "edgecolors": "black",
    "linewidths": 5,
    "width": 5,
}
nx.draw_networkx(G, pos, **options)

# Set margins for the axes so that nodes aren't clipped
ax = plt.gca()
ax.margins(0.20)
plt.axis("off")
plt.show()
2.2 简单的有向图
效果图:
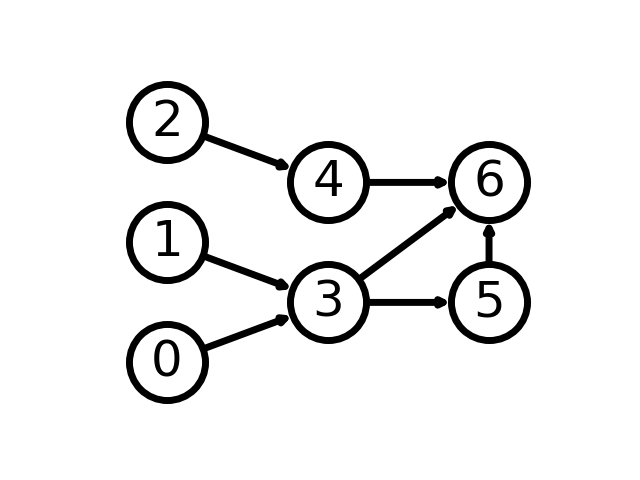
G = nx.DiGraph([(0, 3), (1, 3), (2, 4), (3, 5), (3, 6), (4, 6), (5, 6)])

# group nodes by column
left_nodes = [0, 1, 2]
middle_nodes = [3, 4]
right_nodes = [5, 6]

# set the position according to column (x-coord)
pos = {n: (0, i) for i, n in enumerate(left_nodes)}
pos.update({n: (1, i + 0.5) for i, n in enumerate(middle_nodes)})
pos.update({n: (2, i + 0.5) for i, n in enumerate(right_nodes)})

nx.draw_networkx(G, pos, **options)

# Set margins for the axes so that nodes aren't clipped
ax = plt.gca()
ax.margins(0.20)
plt.axis("off")
plt.show()
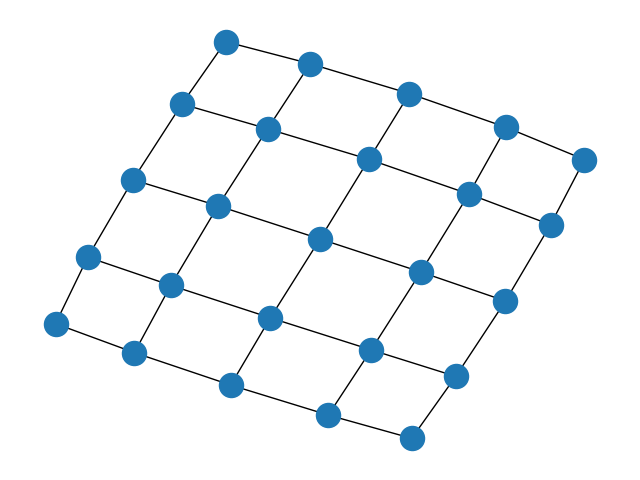
2.3 二维网格grid图 和边数据读写
重点语句:G = nx.grid_2d_graph(5, 5)
- 图示意:
- 代码示例
import matplotlib.pyplot as plt
import networkx as nx

G = nx.grid_2d_graph(5, 5)  # 5x5 grid

# print the adjacency list
for line in nx.generate_adjlist(G):
    print(line)
# write edgelist to grid.edgelist
nx.write_edgelist(G, path="grid.edgelist", delimiter=":")
# read edgelist from grid.edgelist
H = nx.read_edgelist(path="grid.edgelist", delimiter=":")

pos = nx.spring_layout(H, seed=200)
nx.draw(H, pos)
plt.show()
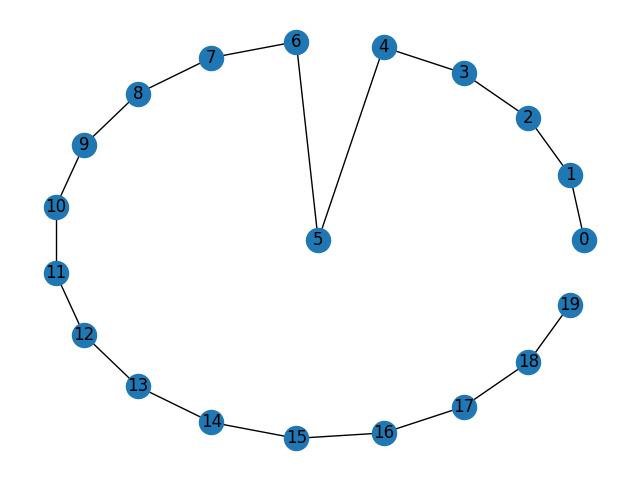
2.4 环图
用户指定环的位置后画出:
代码
import matplotlib.pyplot as plt
import networkx as nx
import numpy as np

G = nx.path_graph(20)  # An example graph
center_node = 5  # Or any other node to be in the center
edge_nodes = set(G) - {center_node}
# Ensures the nodes around the circle are evenly distributed
pos = nx.circular_layout(G.subgraph(edge_nodes))
pos[center_node] = np.array([0, 0])  # manually specify node position
nx.draw(G, pos, with_labels=True)
plt.show()
2.5 全连接神经网络
示例图

示例代码
import itertools
import matplotlib.pyplot as plt
import networkx as nx

subset_sizes = [5, 5, 4, 3, 2, 4, 4, 3]
subset_color = [
    "gold",
    "violet",
    "violet",
    "violet",
    "violet",
    "limegreen",
    "limegreen",
    "darkorange",
]


def multilayered_graph(*subset_sizes):
    extents = nx.utils.pairwise(itertools.accumulate((0,) + subset_sizes))
    layers = [range(start, end) for start, end in extents]
    G = nx.Graph()
    for i, layer in enumerate(layers):
        G.add_nodes_from(layer, layer=i)
    for layer1, layer2 in nx.utils.pairwise(layers):
        G.add_edges_from(itertools.product(layer1, layer2))
    return G


G = multilayered_graph(*subset_sizes)
color = [subset_color[data["layer"]] for v, data in G.nodes(data=True)]
pos = nx.multipartite_layout(G, subset_key="layer")
plt.figure(figsize=(8, 8))
nx.draw(G, pos, node_color=color, with_labels=False)
plt.axis("equal")
plt.show()
2.6 分布直方图-度秩图-连同子图
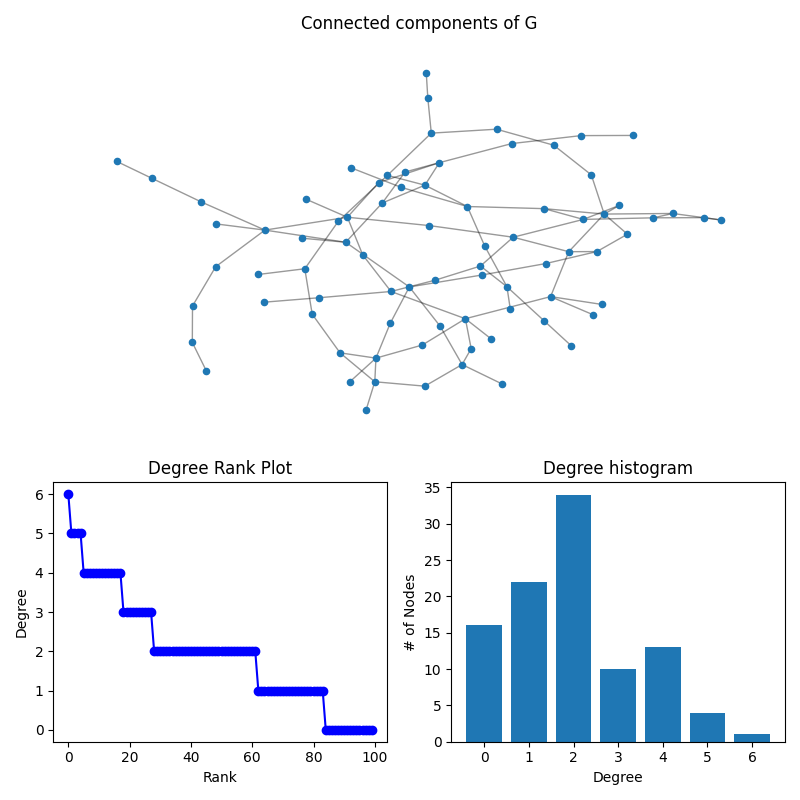
此示例展示了使用两种常用技术可视化节点度分布的几种方法:度秩图和度直方图。
在此示例中,生成了一个包含 100 个节点的随机图。确定每个节点的度数,并生成一个显示三件事的图形:1. 连通分量的子图 2. 图的度秩图,以及 3. 度直方图
import networkx as nx
import numpy as np
import matplotlib.pyplot as plt

G = nx.gnp_random_graph(100, 0.02, seed=10374196)

degree_sequence = sorted((d for n, d in G.degree()), reverse=True)
dmax = max(degree_sequence)

fig = plt.figure("Degree of a random graph", figsize=(8, 8))
# Create a gridspec for adding subplots of different sizes
axgrid = fig.add_gridspec(5, 4)

ax0 = fig.add_subplot(axgrid[0:3, :])
Gcc = G.subgraph(sorted(nx.connected_components(G), key=len, reverse=True)[0])
pos = nx.spring_layout(Gcc, seed=10396953)
nx.draw_networkx_nodes(Gcc, pos, ax=ax0, node_size=20)
nx.draw_networkx_edges(Gcc, pos, ax=ax0, alpha=0.4)
ax0.set_title("Connected components of G")
ax0.set_axis_off()

ax1 = fig.add_subplot(axgrid[3:, :2])
ax1.plot(degree_sequence, "b-", marker="o")
ax1.set_title("Degree Rank Plot")
ax1.set_ylabel("Degree")
ax1.set_xlabel("Rank")

ax2 = fig.add_subplot(axgrid[3:, 2:])
ax2.bar(*np.unique(degree_sequence, return_counts=True))
ax2.set_title("Degree histogram")
ax2.set_xlabel("Degree")
ax2.set_ylabel("# of Nodes")

fig.tight_layout()
plt.show()
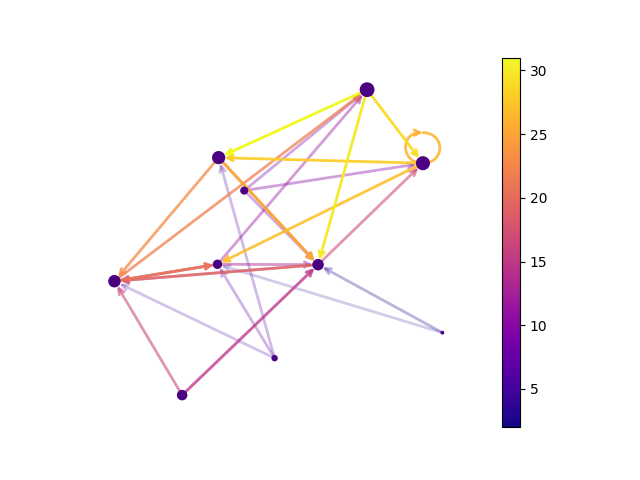
2.7 随机生成
import matplotlib as mpl
import matplotlib.pyplot as plt
import networkx as nx

seed = 13648  # Seed random number generators for reproducibility
G = nx.random_k_out_graph(10, 3, 0.5, seed=seed)
pos = nx.spring_layout(G, seed=seed)

node_sizes = [3 + 10 * i for i in range(len(G))]
M = G.number_of_edges()
edge_colors = range(2, M + 2)
edge_alphas = [(5 + i) / (M + 4) for i in range(M)]
cmap = plt.cm.plasma

nodes = nx.draw_networkx_nodes(G, pos, node_size=node_sizes, node_color="indigo")
edges = nx.draw_networkx_edges(
    G,
    pos,
    node_size=node_sizes,
    arrowstyle="->",
    arrowsize=10,
    edge_color=edge_colors,
    edge_cmap=cmap,
    width=2,
)
# set alpha value for each edge
for i in range(M):
    edges[i].set_alpha(edge_alphas[i])

pc = mpl.collections.PatchCollection(edges, cmap=cmap)
pc.set_array(edge_colors)

ax = plt.gca()
ax.set_axis_off()
plt.colorbar(pc, ax=ax)
plt.show()
2.8 渐变颜色化
颜色渐变的边
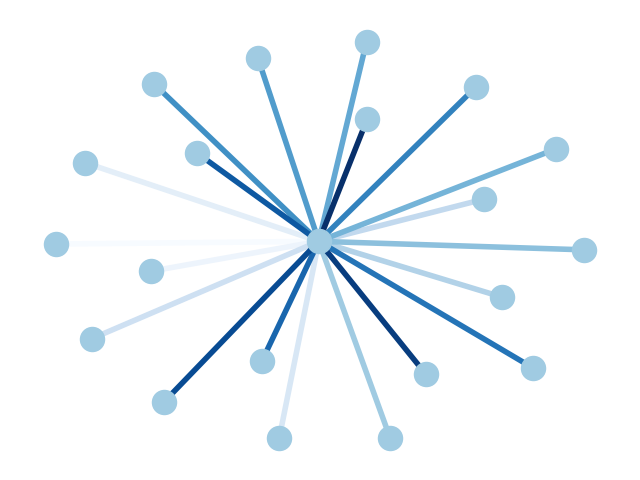
代码
import matplotlib.pyplot as plt
import networkx as nx

G = nx.star_graph(20)
pos = nx.spring_layout(G, seed=63)  # Seed layout for reproducibility
colors = range(20)
options = {
    "node_color": "#A0CBE2",
    "edge_color": colors,
    "width": 4,
    "edge_cmap": plt.cm.Blues,
    "with_labels": False,
}
nx.draw(G, pos, **options)
plt.show()
颜色渐变的节点
import matplotlib.pyplot as plt
import networkx as nx

G = nx.cycle_graph(24)
pos = nx.spring_layout(G, iterations=200)
nx.draw(G, pos, node_color=range(24), node_size=800, cmap=plt.cm.Blues)
plt.show()
2.9 Barabási-Albert 网络
使用 NetworkX ego_graph() 函数返回 Barabási-Albert 网络中最大枢纽的主要 egonet 的示例。

from operator import itemgetter

import matplotlib.pyplot as plt
import networkx as nx

# Create a BA model graph - use seed for reproducibility
n = 1000
m = 2
seed = 20532
G = nx.barabasi_albert_graph(n, m, seed=seed)

# find node with largest degree
node_and_degree = G.degree()
(largest_hub, degree) = sorted(node_and_degree, key=itemgetter(1))[-1]

# Create ego graph of main hub
hub_ego = nx.ego_graph(G, largest_hub)

# Draw graph
pos = nx.spring_layout(hub_ego, seed=seed)  # Seed layout for reproducibility
nx.draw(hub_ego, pos, node_color="b", node_size=50, with_labels=False)

# Draw ego as large and red
options = {"node_size": 300, "node_color": "r"}
nx.draw_networkx_nodes(hub_ego, pos, nodelist=[largest_hub], **options)
plt.show()
2.10 创建一个 G{n,m} 随机图并计算特征值。
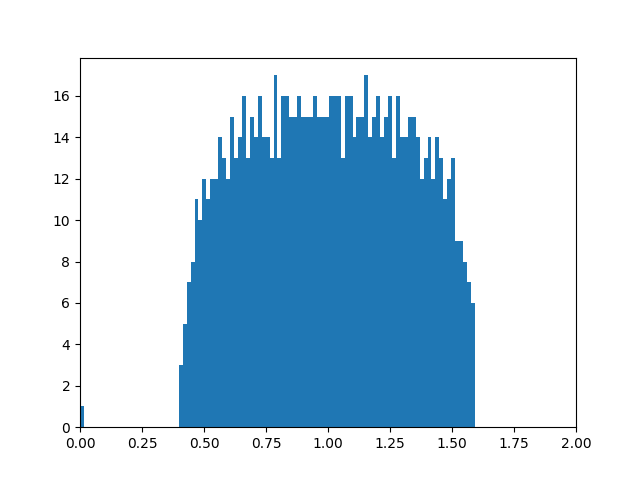
import matplotlib.pyplot as plt
import networkx as nx
import numpy.linalg

n = 1000  # 1000 nodes
m = 5000  # 5000 edges
G = nx.gnm_random_graph(n, m, seed=5040)  # Seed for reproducibility

L = nx.normalized_laplacian_matrix(G)
e = numpy.linalg.eigvals(L.toarray())
print("Largest eigenvalue:", max(e))
print("Smallest eigenvalue:", min(e))
plt.hist(e, bins=100)  # histogram with 100 bins
plt.xlim(0, 2)  # eigenvalues between 0 and 2
plt.show()