Python遥感开发之FY的批量处理
- 0 FY遥感数据
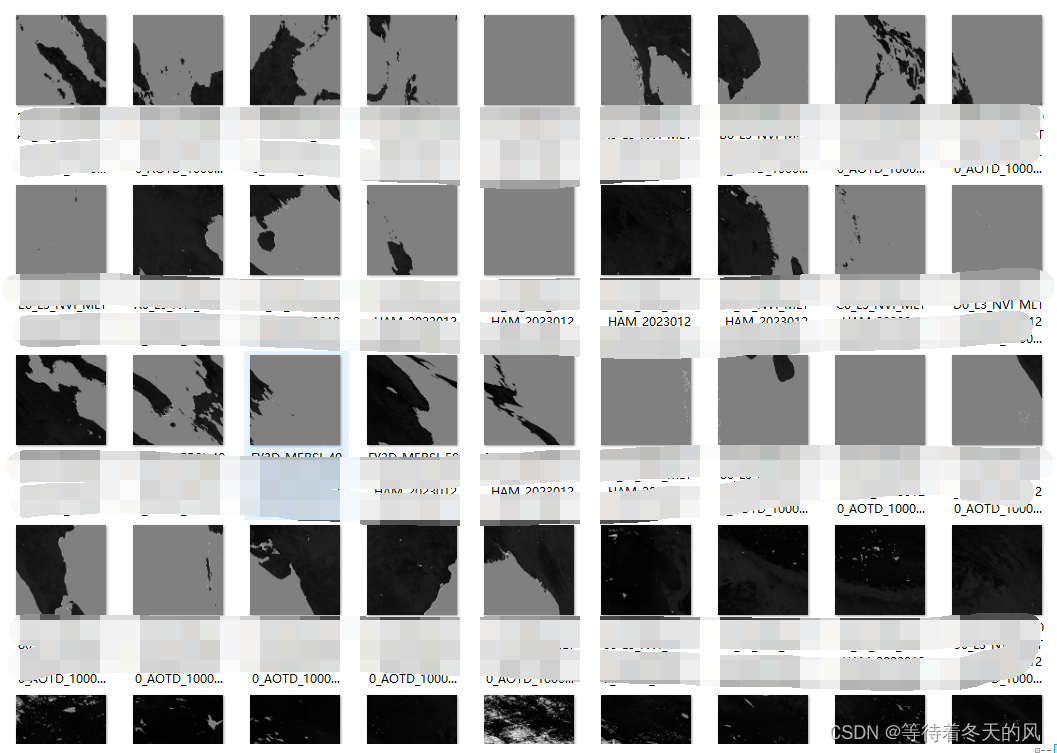
- 1 批量提取数据
- 2 批量拼接TIF数据
- 3 批量HAM转WGS投影(重要)
- 4 批量掩膜裁剪
介绍FY数据的格式,以及FY数据的批量提取数据、批量拼接数据、批量投影转换、批量掩膜裁剪等操作。
本博客代码参考《 Hammer坐标系转换到WGS1984,以处理FY3D/MERSI NVI数据为例。FY3D/MERSI NVI空间分辨率250m,全球 10°×10°分幅 》,非常感谢博主公开代码!!!
0 FY遥感数据
- 本博客以《MERSI-II植被指数旬产品(1000M)》数据处理为例子,“FY3D_MERSI_00A0_L3_NVI_MLT_HAM_20191130_AOTD_1000M_MS.HDF”,其中FY3D是卫星名字、MERSI是仪器名称、00A0是数据区域类型(也是该影像的经纬度范围)、L3是数据级别、NVI是数据名称、MLT是通道名称、HAM是投影方式、AOTD是时段类型、1000M是分辨率、HDF是数据名称格式。
- 最核心最难的就是HAM投影如何转换成常见的WGS投影
1 批量提取数据
MERSI-II植被指数旬产品(1000M)数据包含如下波段,根据需要自己取

切记
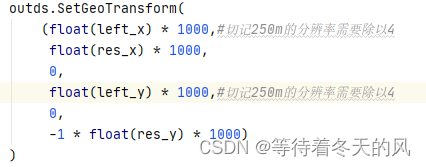
完整代码如下所示:
import os
from osgeo import gdal
import h5py

def get_data_list(file_path, out = ""):
    list1 = []  # 文件的完整路径
    if os.path.isdir(file_path):
        fileList = os.listdir(file_path)
        if out != "":
            for f in fileList:
                out_data = out + "\\" + f
                out_data = out_data.replace(".HDF", "_ndvi.tif")
                list1.append(out_data)
        else:
            for f in fileList:
                pre_data = file_path + '\\' + f  # 文件的完整路径
                list1.append(pre_data)
        return list1

import numpy as np

def HDF2Tif(in_file,out_file):
    hdf_ds = h5py.File(in_file, "r")
    if type(hdf_ds.attrs['Left-Top X']) is np.ndarray:
        left_x = hdf_ds.attrs['Left-Top X'][0]
    else:
        left_x = float(hdf_ds.attrs['Left-Top X'])

    if type(hdf_ds.attrs['Left-Top Y']) is np.ndarray:
        left_y = hdf_ds.attrs['Left-Top Y'][0]
    else:
        left_y = float(hdf_ds.attrs['Left-Top Y'])

    res_x = hdf_ds.attrs['Resolution X'][0]
    res_y = hdf_ds.attrs['Resolution Y'][0]
    ndviname = list(hdf_ds.keys())[6] #5是evi 6是ndvi
    # print(list(hdf_ds.keys()))

    ndvi_ds = hdf_ds[ndviname]
    rows = ndvi_ds.shape[0]
    cols = ndvi_ds.shape[1]
    data = ndvi_ds[()]
    driver = gdal.GetDriverByName("GTiff")
    outds = driver.Create(out_file, cols, rows, 1, gdal.GDT_Int16)
    outds.SetGeoTransform(
        (float(left_x) * 1000,#切记250m的分辨率需要除以4
         float(res_x) * 1000,
         0,
         float(left_y) * 1000,#切记250m的分辨率需要除以4
         0,
         -1 * float(res_y) * 1000)
    )
    proj = 'PROJCS["World_Hammer",GEOGCS["Unknown datum based upon the custom spheroid",DATUM["Not_specified_based_on_custom_spheroid",SPHEROID["Custom spheroid",6363961,0]],PRIMEM["Greenwich",0],UNIT["Degree",0.0174532925199433]],PROJECTION["Hammer_Aitoff"],PARAMETER["False_Easting",0],PARAMETER["False_Northing",0],PARAMETER["Central_Meridian",0],UNIT["metre",1],AXIS["Easting",EAST],AXIS["Northing",NORTH]]'
    outds.SetProjection(proj)
    outband = outds.GetRasterBand(1)
    outband.WriteArray(data)
    pass

if __name__ == '__main__':
    infile = r"C:\Users\Administrator\Desktop\HDF"
    outfile = r"C:\Users\Administrator\Desktop\01提取ndvi"
    infile_list = get_data_list(infile)
    outfile_list = get_data_list(infile,outfile)
    for in_file,out_file in zip(infile_list,outfile_list):
        print(in_file)
        HDF2Tif(in_file,out_file)
2 批量拼接TIF数据
import os
from osgeo import gdal

def get_data_list(file_path, out = ""):
    list1 = []  # 文件的完整路径
    if os.path.isdir(file_path):
        fileList = os.listdir(file_path)
        if out != "":
            for f in fileList:
                out_data = out + "\\" + f
                out_data = out_data.replace(".HDF", "_ndvi.tif")
                list1.append(out_data)
        else:
            for f in fileList:
                pre_data = file_path + '\\' + f  # 文件的完整路径
                list1.append(pre_data)
        return list1

def get_same_list(image, infile_list):
    infile_list02 = []
    for data in infile_list:
        if image in data:
            # print("----", data)
            infile_list02.append(data)
    return infile_list02

def get_same_image_list(infile_list):
    image_list= []
    for file in infile_list:
        filename = file[-31:-23]
        if filename not in image_list:
            image_list.append(filename)
    return list(set(image_list))

def pinjie(infile_list,outfile):
    ds = gdal.Open(infile_list[0])
    cols = ds.RasterXSize
    rows = ds.RasterYSize
    ingeo = ds.GetGeoTransform()
    proj = ds.GetProjection()
    minx = ingeo[0]
    maxy = ingeo[3]
    maxx = ingeo[0] + ingeo[1] * cols
    miny = ingeo[3] + ingeo[5] * rows
    ds = None
    for file in infile_list[1:]:
        ds = gdal.Open(file)
        cols = ds.RasterXSize
        rows = ds.RasterYSize
        geo = ds.GetGeoTransform()
        minx_ = geo[0]
        maxy_ = geo[3]
        maxx_ = geo[0] + geo[1] * cols
        miny_ = geo[3] + geo[5] * rows
        minx = min(minx, minx_)
        maxy = max(maxy, maxy_)
        maxx = max(maxx, maxx_)
        miny = min(miny, miny_)
        geo = None
        ds = None
    newcols = int((maxx - minx) / abs(ingeo[1]))
    newrows = int((maxy - miny) / abs(ingeo[5]))
    driver = gdal.GetDriverByName("GTiff")
    outds = driver.Create(outfile, newcols, newrows, 1, gdal.GDT_Int16)
    outgeo = (minx, ingeo[1], 0, maxy, 0, ingeo[5])
    outds.SetGeoTransform(outgeo)
    outds.SetProjection(proj)
    outband = outds.GetRasterBand(1)
    for file in infile_list:
        ds = gdal.Open(file)
        data = ds.ReadAsArray()
        geo = ds.GetGeoTransform()
        x = int(abs((geo[0] - minx) / ingeo[1]))
        y = int(abs((geo[3] - maxy) / ingeo[5]))
        outband.WriteArray(data, x, y)
        ds = None
    outband.FlushCache()
    pass
if __name__ == '__main__':

    infile = r"C:\Users\Administrator\Desktop\01提取ndvi"
    outfile = r"C:\Users\Administrator\Desktop\02拼接"
    infile_list = get_data_list(infile)
    image_name_list = get_same_image_list(infile_list)
    print(image_name_list)
    for name in image_name_list:
        print(name)
        infile_list02 = get_same_list(name, infile_list)
        pinjie(infile_list02,outfile+"\\"+name+".tif")

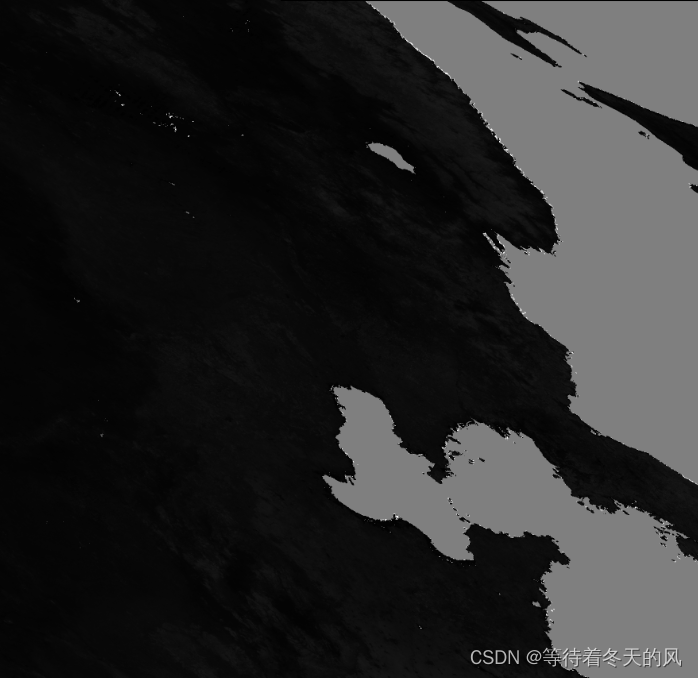
3 批量HAM转WGS投影(重要)
切记:代码中出现的0.01表示1000m分辨率,如果需要换成250m分辨率,请根据代码注释自行更换。


完整代码如下:
import os
from osgeo import gdal
import numpy as np
import math
from osgeo import osr

def get_data_list(file_path, out = ""):
    list1 = []  # 文件的完整路径
    if os.path.isdir(file_path):
        fileList = os.listdir(file_path)
        if out != "":
            for f in fileList:
                out_data = out + "\\" + f
                # out_data = out_data.replace(".HDF", "_ndvi.tif")
                list1.append(out_data)
        else:
            for f in fileList:
                pre_data = file_path + '\\' + f  # 文件的完整路径
                list1.append(pre_data)
        return list1

def H2W(infile,outfile):
    ds = gdal.Open(infile)
    ingeo = ds.GetGeoTransform()
    cols = ds.RasterXSize
    rows = ds.RasterYSize
    or_x = ingeo[0]
    or_y = ingeo[3]
    end_x = ingeo[0] + cols * ingeo[1]
    end_y = ingeo[3] + rows * ingeo[5]
    # X方向分块
    xblocksize = int((cols + 1) / 5)
    # Y方向分块
    yblocksize = int((rows + 1) / 5)
    lon_max = -360
    lon_min = 360
    lat_max = -90
    lat_min = 90
    for i in range(0, rows + 1, yblocksize):
        if i + yblocksize < rows + 1:
            numrows = yblocksize
        else:
            numrows = rows + 1 - i
        for j in range(0, cols + 1, xblocksize):
            if j + xblocksize < cols + 1:
                numcols = xblocksize
            else:
                numcols = cols + 1 - j
            # 计算所有点的Hammer坐标系下X方向坐标数组
            x = ingeo[0] + j * ingeo[1]
            y = ingeo[3] + i * ingeo[5]
            xgrid, ygrid = np.meshgrid(np.linspace(x, x + numcols * ingeo[1], num=numcols),
                                       np.linspace(y, y + numrows * ingeo[5], num=numrows))
            # 将hammer坐标转化为经纬度坐标
            # 首先将Hammer转化为-1到1
            xgrid = np.where(xgrid > (18000.0 * 1000.0), (18000.0 * 1000.0) - xgrid, xgrid)
            xgrid = xgrid / (18000.0 * 1000.0)
            ygrid = np.where(ygrid > (9000.0 * 1000.0), (9000.0 * 1000.0) - ygrid, ygrid)
            ygrid = ygrid / (9000.0 * 1000.0)
            z = np.sqrt(1 - np.square(xgrid) / 2.0 - np.square(ygrid) / 2.0)
            lon = 2 * np.arctan(np.sqrt(2) * xgrid * z / (2.0 * (np.square(z)) - 1))
            xgrid = None
            lat = np.arcsin(np.sqrt(2) * ygrid * z)
            ygrid = None
            z = None
            lon = lon / math.pi * 180.0
            lat = lat / math.pi * 180.0
            lon[lon < 0] = lon[lon < 0] + 360.0
            # lat[lat<0]=lat[lat<0]+180
            lon_max = max(lon_max, np.max(lon))
            lon_min = min(lon_min, np.min(lon))
            lon = None
            lat_max = max(lat_max, np.max(lat))
            lat_min = min(lat_min, np.min(lat))
            lat = None

    newcols = math.ceil((lon_max - lon_min) / 0.01)#切记250m的分辨率需要把0.01换成0.0025
    newrows = math.ceil((lat_max - lat_min) / 0.01)#切记250m的分辨率需要把0.01换成0.0025
    driver = gdal.GetDriverByName("GTiff")
    outds = driver.Create(outfile, newcols, newrows, 1, gdal.GDT_Int16)
    geo2 = (lon_min, 0.01, 0, lat_max, 0, -1 * 0.01)#切记250m的分辨率需要把0.01换成0.0025
    oproj_srs = osr.SpatialReference()
    proj_4 = "+proj=longlat +datum=WGS84 +no_defs"
    oproj_srs.ImportFromProj4(proj_4)
    outds.SetGeoTransform(geo2)
    outds.SetProjection(oproj_srs.ExportToWkt())
    outband = outds.GetRasterBand(1)
    datav = ds.ReadAsArray()
    data = np.full((datav.shape[0] + 1, datav.shape[1] + 1), -32750, dtype=int)
    data[0:datav.shape[0], 0:datav.shape[1]] = datav
    xblocksize = int(newcols / 5)
    yblocksize = int(newrows / 5)
    for i in range(0, newrows, yblocksize):
        if i + yblocksize < newrows:
            numrows = yblocksize
        else:
            numrows = newrows - i
        for j in range(0, newcols, xblocksize):
            if j + xblocksize < newcols:
                numcols = xblocksize
            else:
                numcols = newcols - j
            x = lon_min + j * 0.01 + 0.01 / 2.0 #切记250m的分辨率需要把0.01换成0.0025
            y = lat_max + i * (-1 * 0.01) - 0.01 / 2.0#切记250m的分辨率需要把0.01换成0.0025
            newxgrid, newygrid = np.meshgrid(np.linspace(x, x + numcols * 0.01, num=numcols),#切记250m的分辨率需要把0.01换成0.0025
                                             np.linspace(y, y + numrows * (-1 * 0.01), num=numrows))#切记250m的分辨率需要把0.01换成0.0025
            # 将经纬度坐标转化为Hammer坐标
            newxgrid = np.where(newxgrid > 180.0, newxgrid - 360.0, newxgrid)
            newxgrid = newxgrid / 180.0 * math.pi
            newygrid = newygrid / 180.0 * math.pi
            newz = np.sqrt(1 + np.cos(newygrid) * np.cos(newxgrid / 2.0))
            x = np.cos(newygrid) * np.sin(newxgrid / 2.0) / newz
            newxgrid = None
            y = np.sin(newygrid) / newz
            newygrid = None
            newz = None
            x = x * (18000.0 * 1000.0)
            y = y * (9000.0 * 1000.0)
            x_index = (np.floor((x - or_x) / ingeo[1])).astype(int)
            x_index = np.where(x_index < 0, data.shape[1] - 1, x_index)
            x_index = np.where(x_index >= data.shape[1], data.shape[1] - 1, x_index)
            y_index = (np.floor((y - or_y) / ingeo[5])).astype(int)
            y_index = np.where(y_index < 0, data.shape[0] - 1, y_index)
            y_index = np.where(y_index >= data.shape[0], data.shape[0] - 1, y_index)
            newdata = data[y_index, x_index]
            outband.WriteArray(newdata, j, i)
    outband.SetNoDataValue(-32750)
    outband.FlushCache()

if __name__ == '__main__':
    infile_path = r"C:\Users\Administrator\Desktop\02拼接"
    outfile_path = r"C:\Users\Administrator\Desktop\03WGS"
    infile_list = get_data_list(infile_path)
    outfile_list = get_data_list(infile_path,outfile_path)
    for infile,outfile in zip(infile_list,outfile_list):
        print(infile)
        H2W(infile,outfile)

4 批量掩膜裁剪
请参考本人博客《Python遥感开发之批量掩膜和裁剪》

