1.地图MAp
1. Map.add(item)
这个方法通常是在地图展示区加入各种ui使用,如ui.Label
2.Map.centerObject(object, zoom)
设置地图居中位置,参数object是矢量数据或者影响数据;zoom是缩放级别。
3.Map.addLayer(ee.Object, visParams, name, shown opacity)
地图上添加图层,这是几乎每一个程序都在使用的方法,具体参数如下:
1)ee.Object:图层内容,可以是矢量数据、影像等。
2)visParams:显示图层内容样式参数;
3)name:图层的名称
4)shown:图层是否显示
5)opacity:图层的透明度
其中,visParams参数样式可以设置的内容包括:bands(波段列表)、min(最小值)、max(最大值)、
gamma(伽马系数)、palette(颜色列表)、opacity(透明度)等
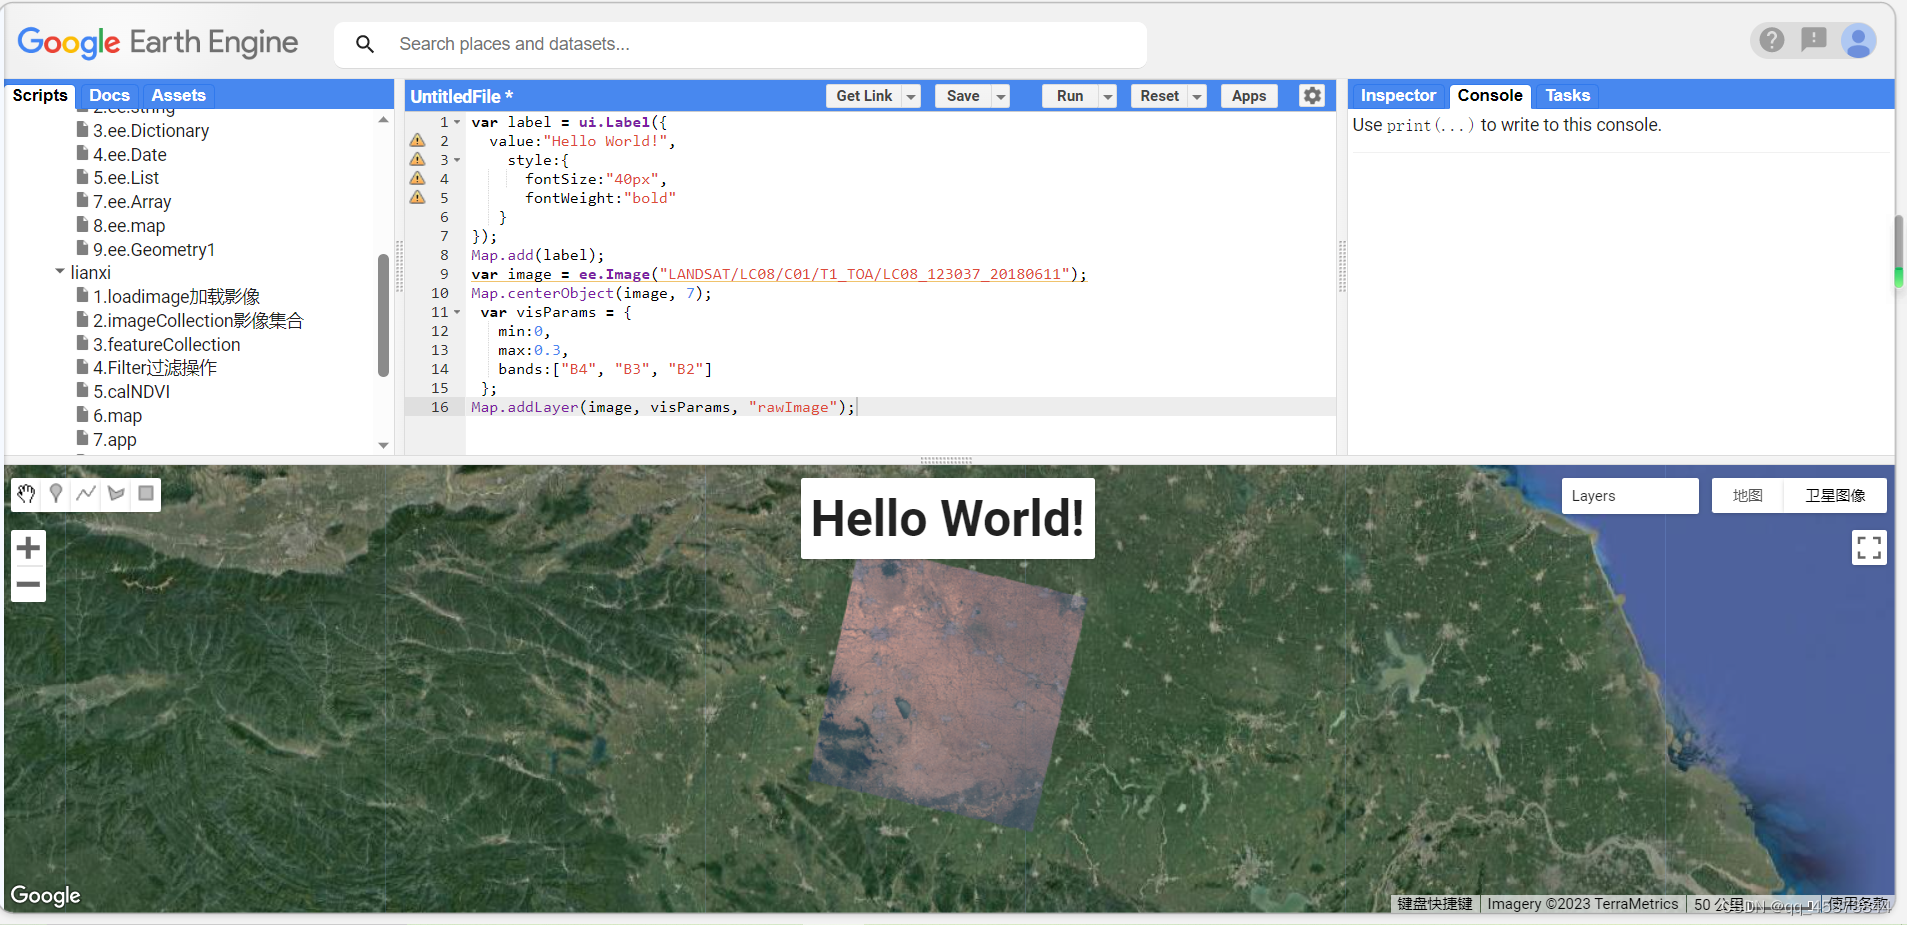
// 1.定义label
 var label = ui.Label({
 	value:"Hello World!",
 		style:{
     	fontSize:"40px",
    	fontWeight:"bold"
   }
});
Map.add(label);
var image = ee.Image("LANDSAT/LC08/C01/T1_TOA/LC08_123037_20180611");
Map.centerObject(image, 7);
 var visParams = {
   min:0,
   max:0.3,
   bands:["B4", "B3", "B2"]
 };
Map.addLayer(image, visParams, "rawImage");
1.2绘制矢量数据
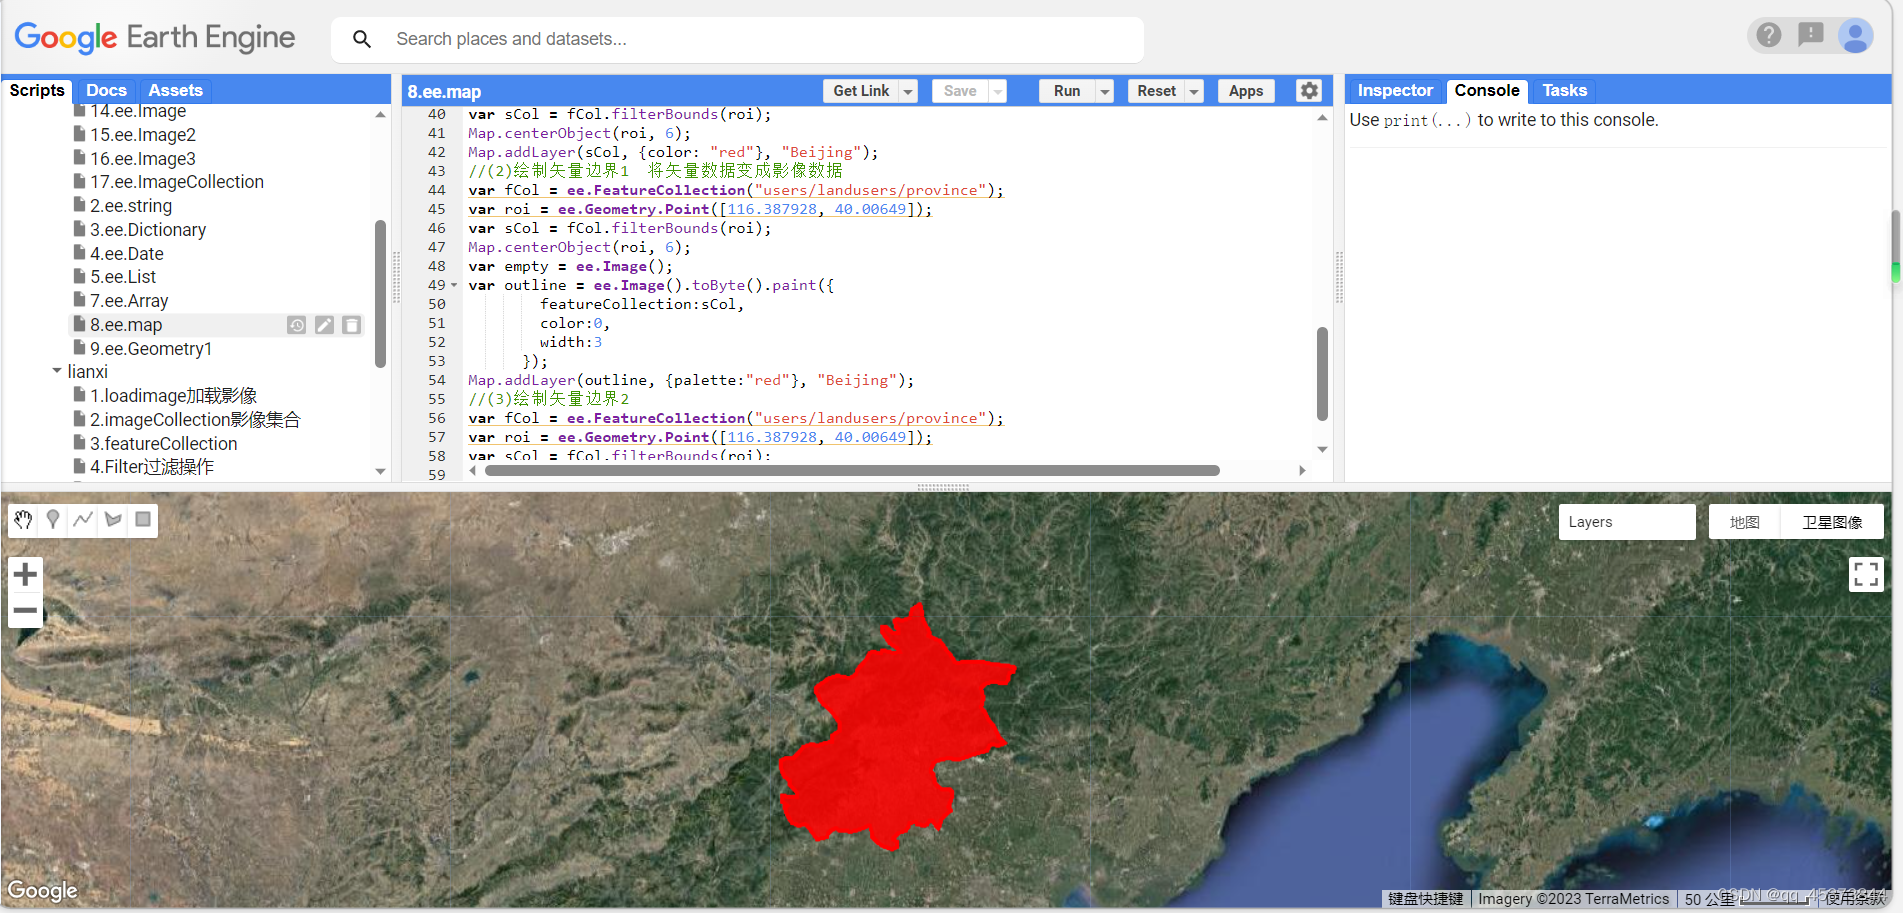
// (1)绘制完全填充的矢量数据  默认的添加模式,只有一个color属性
var fCol = ee.FeatureCollection("users/landusers/province");
var roi = ee.Geometry.Point([116.387928, 40.00649]);
var sCol = fCol.filterBounds(roi);
Map.centerObject(roi, 6);
Map.addLayer(sCol, {color: "red"}, "Beijing");

//(2)绘制矢量边界1  将矢量数据变成影像数据
var fCol = ee.FeatureCollection("users/landusers/province");
var roi = ee.Geometry.Point([116.387928, 40.00649]);
var sCol = fCol.filterBounds(roi);
Map.centerObject(roi, 6);
var empty = ee.Image();
var outline = ee.Image().toByte().paint({
        featureCollection:sCol,
        color:0,
        width:3
      });
Map.addLayer(outline, {palette:"red"}, "Beijing");

//(3)绘制矢量边界2
var fCol = ee.FeatureCollection("users/landusers/province");
var roi = ee.Geometry.Point([116.387928, 40.00649]);
var sCol = fCol.filterBounds(roi);
Map.centerObject(roi, 6);
var styling = {color: 'red', fillColor:'00000000'};
Map.addLayer(sCol, {color: "red"}, "Beijing");
2.几何图形 ee.Geometry
Geometry参数
| 类名 | 含义 |
|---|---|
| ee.Geometry.LineString | 线段:有一系列点组成的直线 |
| ee.Geometry.LineRinf | 环:线段首尾相连接 |
| ee.Geometry.MultiLineString | 复合线段:多个线段组合在一起 |
| ee.Geometry.Point | 点 |
| ee.Geometry.MultiPoint | 复合点:多个点组合在一起 |
| ee.Geometry.Polygon | 多边形 |
| ee.Geometry.Rectangle | 矩形 |
| ee.Geometry.MultiPolygon | 复合矩形:多个矩形组合在一起 |
2.1几何基础方法
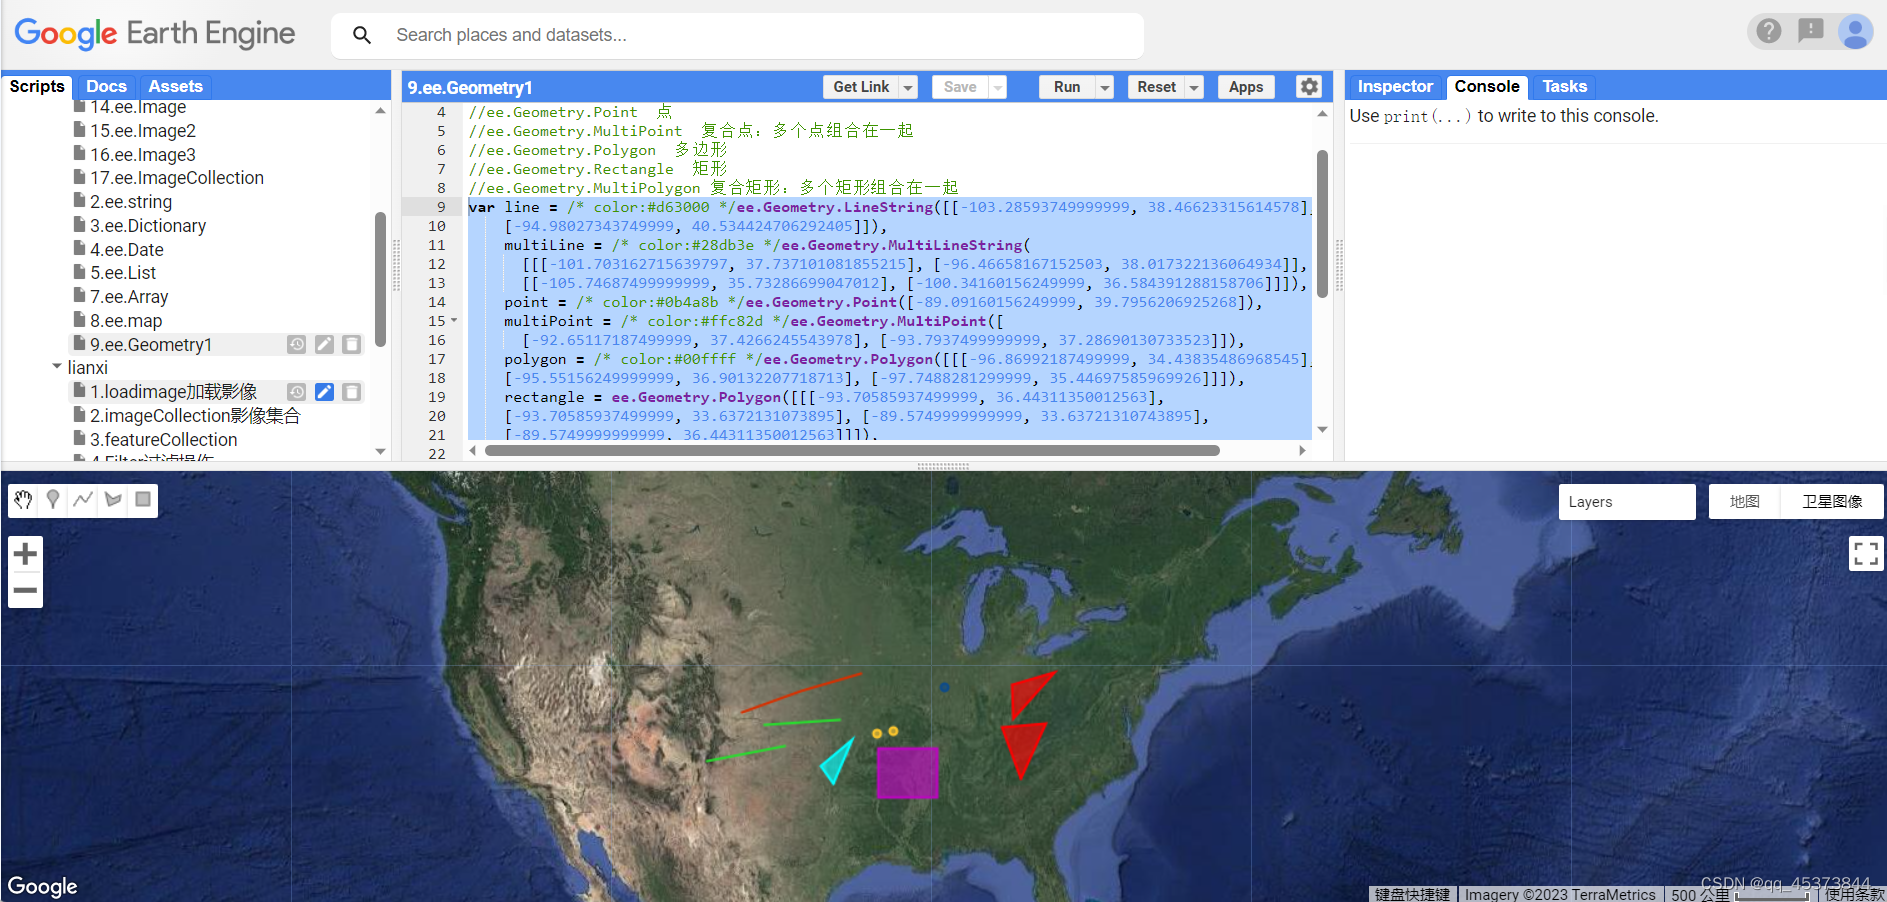
var line = /* color:#d63000 */ee.Geometry.LineString([[-103.28593749999999, 38.46623315614578],
    [-94.98027343749999, 40.534424706292405]]),
    multiLine = /* color:#28db3e */ee.Geometry.MultiLineString(
      [[[-101.703162715639797, 37.737101081855215], [-96.46658167152503, 38.017322136064934]],
      [[-105.74687499999999, 35.73286699047012], [-100.34160156249999, 36.584391288158706]]]),
    point = /* color:#0b4a8b */ee.Geometry.Point([-89.09160156249999, 39.7956206925268]),
    multiPoint = /* color:#ffc82d */ee.Geometry.MultiPoint([
      [-92.65117187499999, 37.4266245543978], [-93.7937499999999, 37.28690130733523]]),
    polygon = /* color:#00ffff */ee.Geometry.Polygon([[[-96.86992187499999, 34.43835486968545],
    [-95.55156249999999, 36.90132207718713], [-97.7488281299999, 35.44697585969926]]]),
    rectangle = ee.Geometry.Polygon([[[-93.70585937499999, 36.44311350012563],
    [-93.70585937499999, 33.6372131073895], [-89.5749999999999, 33.63721310743895],
    [-89.5749999999999, 36.44311350012563]]]),
    multiPolygon = /* color:#ff0000 */ee.Geometry.MultiPolygon(
      [[[[-84.29597208507718, 39.96117602741789], [-84.20893110596711, 38.095486162792234],
      [-81.32717506033146, 40.59421005772966]]],
      [[[-83.68632812499999, 34.7277971009936], [-81.97246093749999, 37.8095219161184],
      [-85.00468749999999, 37.63572230181635]]]]);

Map.addLayer(line, {color:"d63000"}, "line");
Map.addLayer(multiLine, {color:"28db2e"}, "multi_line");
Map.addLayer(point, {color:"0b4a8b"}, "point");
Map.addLayer(multiPoint, {color:"ffc82d"}, "multi_point");
Map.addLayer(polygon, {color:"00ffff"}, "polygon");
Map.addLayer(rectangle, {color:"bf04c2"}, "rectangle");
Map.addLayer(multiPolygon, {color:"ff0000"}, "multi_polygon");
Map.centerObject(point, 4);
2.2几何的空间计算
var polygon1 = /* color:#d63000 */ee.Geometry.Polygon(
  [[[116.18363255709164, 39.73608336682765], [116.62857884615414, 39.75297820506206],
  [116.60660618990414, 40.08580181855619], [116.15067357271664, 40.077395868796174]]]);
var polygon2 = /* color:#ffc82d */ee.Geometry.Polygon(
  [[[116.45728060961198, 40.23636657920226], [116.42981478929948, 39.97166693527704],
  [116.82806918383073, 39.959036508447623], [116.88849398851823, 40.20700637790917]]]);

Map.centerObject(polygon1, 9);
Map.addLayer(polygon1, {color:"red"}, "polygon1");
Map.addLayer(polygon2, {color:"blue"}, "polygon2");
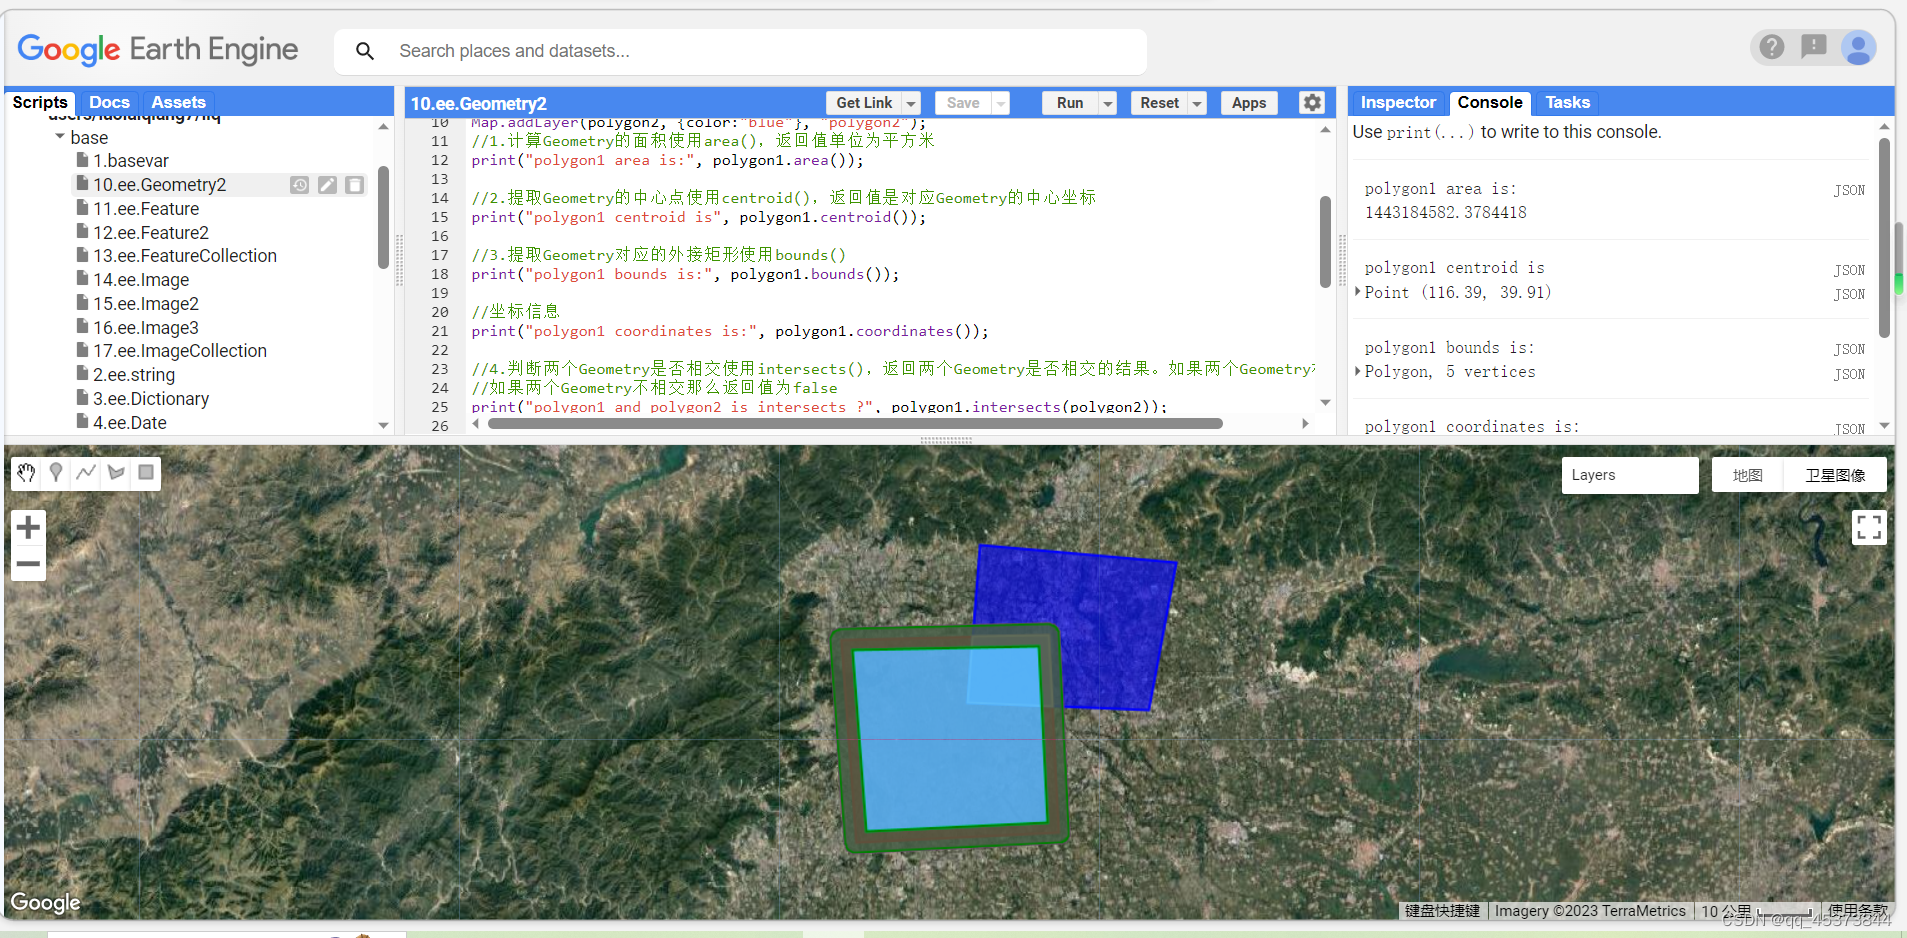
//1.计算Geometry的面积使用area(),返回值单位为平方米
print("polygon1 area is:", polygon1.area());

//2.提取Geometry的中心点使用centroid(),返回值是对应Geometry的中心坐标
print("polygon1 centroid is", polygon1.centroid());

//3.提取Geometry对应的外接矩形使用bounds()
print("polygon1 bounds is:", polygon1.bounds());

//坐标信息
print("polygon1 coordinates is:", polygon1.coordinates());

//4.判断两个Geometry是否相交使用intersects(),返回两个Geometry是否相交的结果。如果两个Geometry相交那么返回值为true,
//如果两个Geometry不相交那么返回值为false
print("polygon1 and polygon2 is intersects ?", polygon1.intersects(polygon2));

//5.取得两个Geometry相交部分内容使用intersection(),返回值是两个Geometry相交的新的Geometry
var intersec = polygon1.intersection(polygon2);
Map.addLayer(intersec, {color:"pink"}, "intersec");

//生成2000m外缓冲区
var bufferPolygon1  = polygon1.buffer(2000);
Map.addLayer(bufferPolygon1, {color:"ff00ff"}, "bufferPolygon1");

//生成2000内缓冲区
var bufferPolygon2 = polygon1.buffer(-2000);
Map.addLayer(bufferPolygon2, {color:"00ffff"}, "bufferPolygon2");

//6.两个Geometry取得不同的部分使用difference(),简单来讲就是在第一个Geometry但不在第二个Geometry的部分
var differ = bufferPolygon1.difference(bufferPolygon2);
Map.addLayer(differ, {color:"green"}, "differ");
3.矢量数据ee.Feature
矢量数据Feature是Earth Engine定义的一种数据类型,相比Geometry多记录了要存储的属性。
3.1ee.Feature基本操作方法
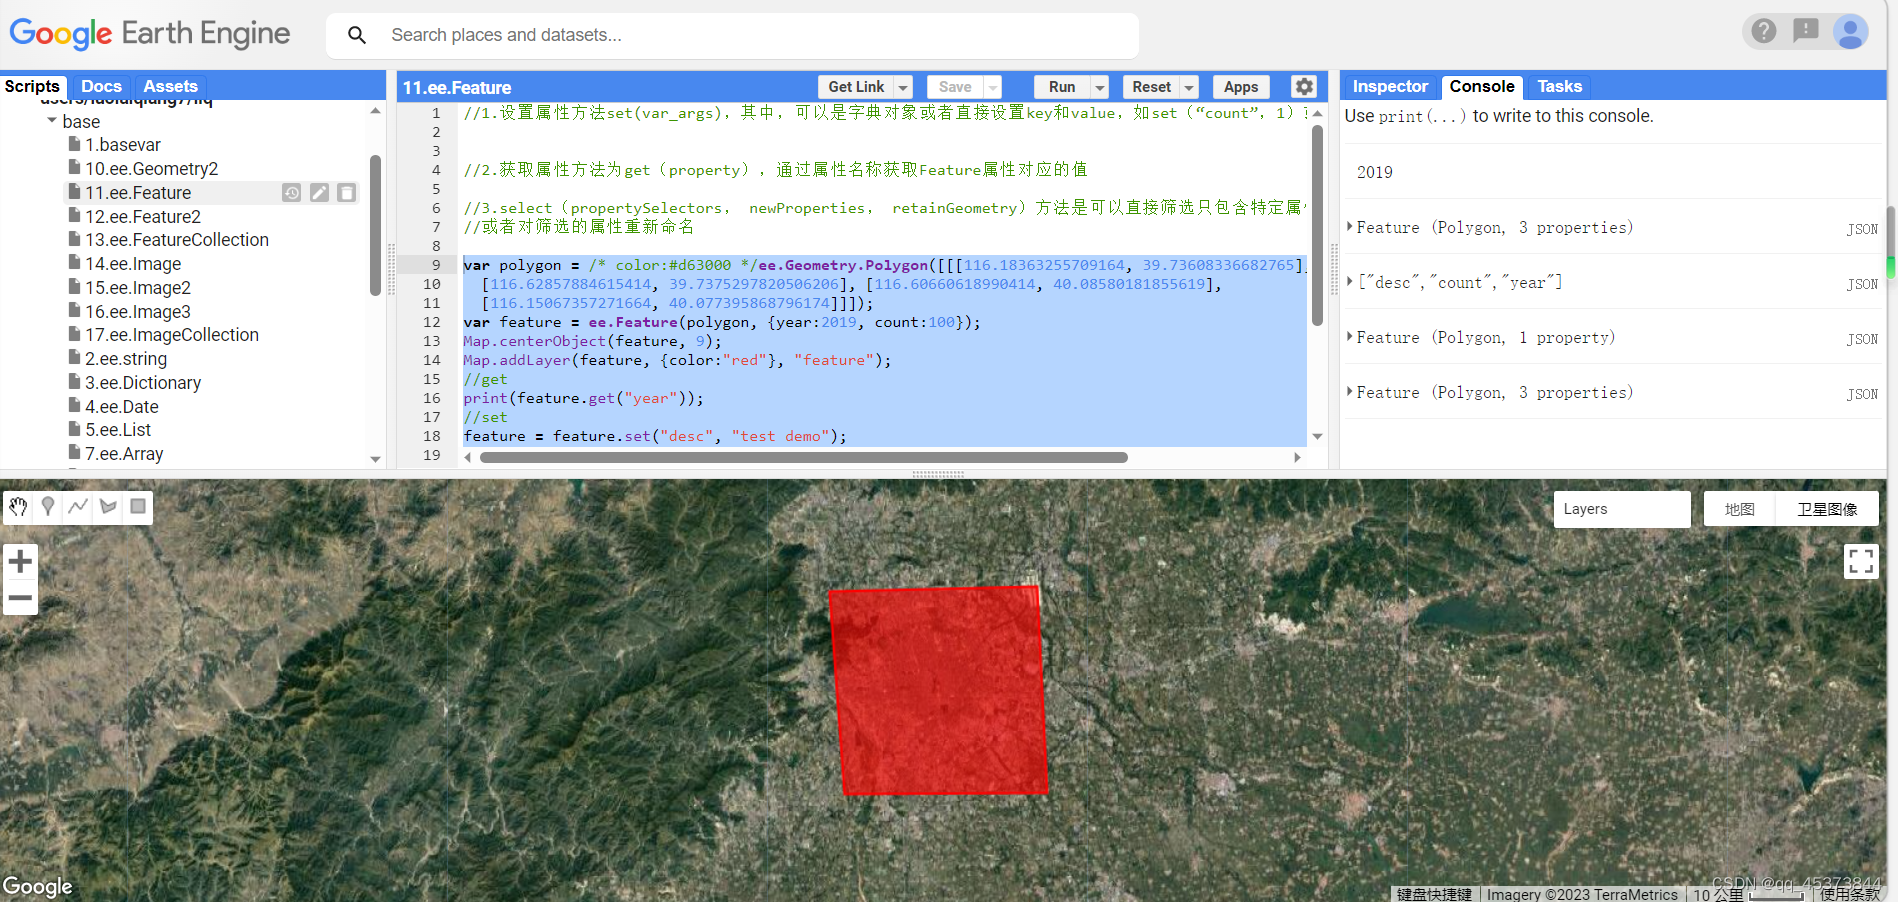
1).设置属性方法set(var_args),其中,可以是字典对象或者直接设置key和value,如set(“count”,1)或者set({“count”:1})
2).获取属性方法为get(property),通过属性名称获取Feature属性对应的值
3).select(propertySelectors, newProperties, retainGeometry)方法是可以直接筛选只包含特定属性的Feature,或者对筛选的属性重新命名
var polygon = /* color:#d63000 */ ee.Geometry.Polygon([[[116.18363255709164, 39.73608336682765],
  [116.62857884615414, 39.7375297820506206], [116.60660618990414, 40.08580181855619],
  [116.15067357271664, 40.077395868796174]]]);
var feature = ee.Feature(polygon, {year:2019, count:100});
Map.centerObject(feature, 9);
Map.addLayer(feature, {color:"red"}, "feature");
//get
print(feature.get("year"));
//set
feature = feature.set("desc", "test demo");
print(feature);
//propertyNames  查看Feature对应的所以属性名称
print(feature.propertyNames());
//select
print(ee.Feature(feature.select(["count"])));
var feature2 = feature.select(
  ["year", "count", "desc"], ["date", "count", "desc"]); //将year属性重新命名为date
feature2 = ee.Feature(feature2);
print(feature2);
3.2矢量数据空间操作
矢量数据的空间操作与Geometry非常类似
Feature空间操作方法
1).获取Feature对应的Geometry:geometry()
2).获取面积:area()平方米
3).提取中心点:centroid(),返回值是对应的中心点坐标
4).对应的外部最大矩形:bounds
5).对Feature做缓冲区:buffer(),如果传入的距离是正数则向外的扩大缓冲区,反之为向内
6).判断两个Feature是否相交:intersects(),返回两个Feature是否相交的结果,若相交那么返回true,反之则为false
7).取得两个Feature相交部分内容:intersection(),返回值是两个Feature相交的新的Feature
8).两个Feature取得不同的部分:difference(),简单来说就是在第一个但不在第二个Feature的部分
var polygon1 = /* color:#d63000 */ee.Geometry.Polygon([[[116.18363255709164, 39.73608336682765],
  [116.62857884615414, 39.7375297820506206], [116.60660618990414, 40.08580181855619],
  [116.15067357271664, 40.077395868796174]]]);
var polygon2 = /* color:#ffc82d */ee.Geometry.Polygon([[[116.45728060961198, 40.23636657920226],
  [116.42981478929948, 39.97166693527704], [116.82806918383073, 39.95903650847623],
  [116.88849398851823, 40.20700637790917]]]);
var feature1 = ee.Feature(polygon1);
var feature2 = ee.Feature(polygon2);
Map.centerObject(feature1, 9);
Map.addLayer(feature1, {color:"red"}, "feature1");
Map.addLayer(feature2, {color:"blue"}, "feature2");
//feature area
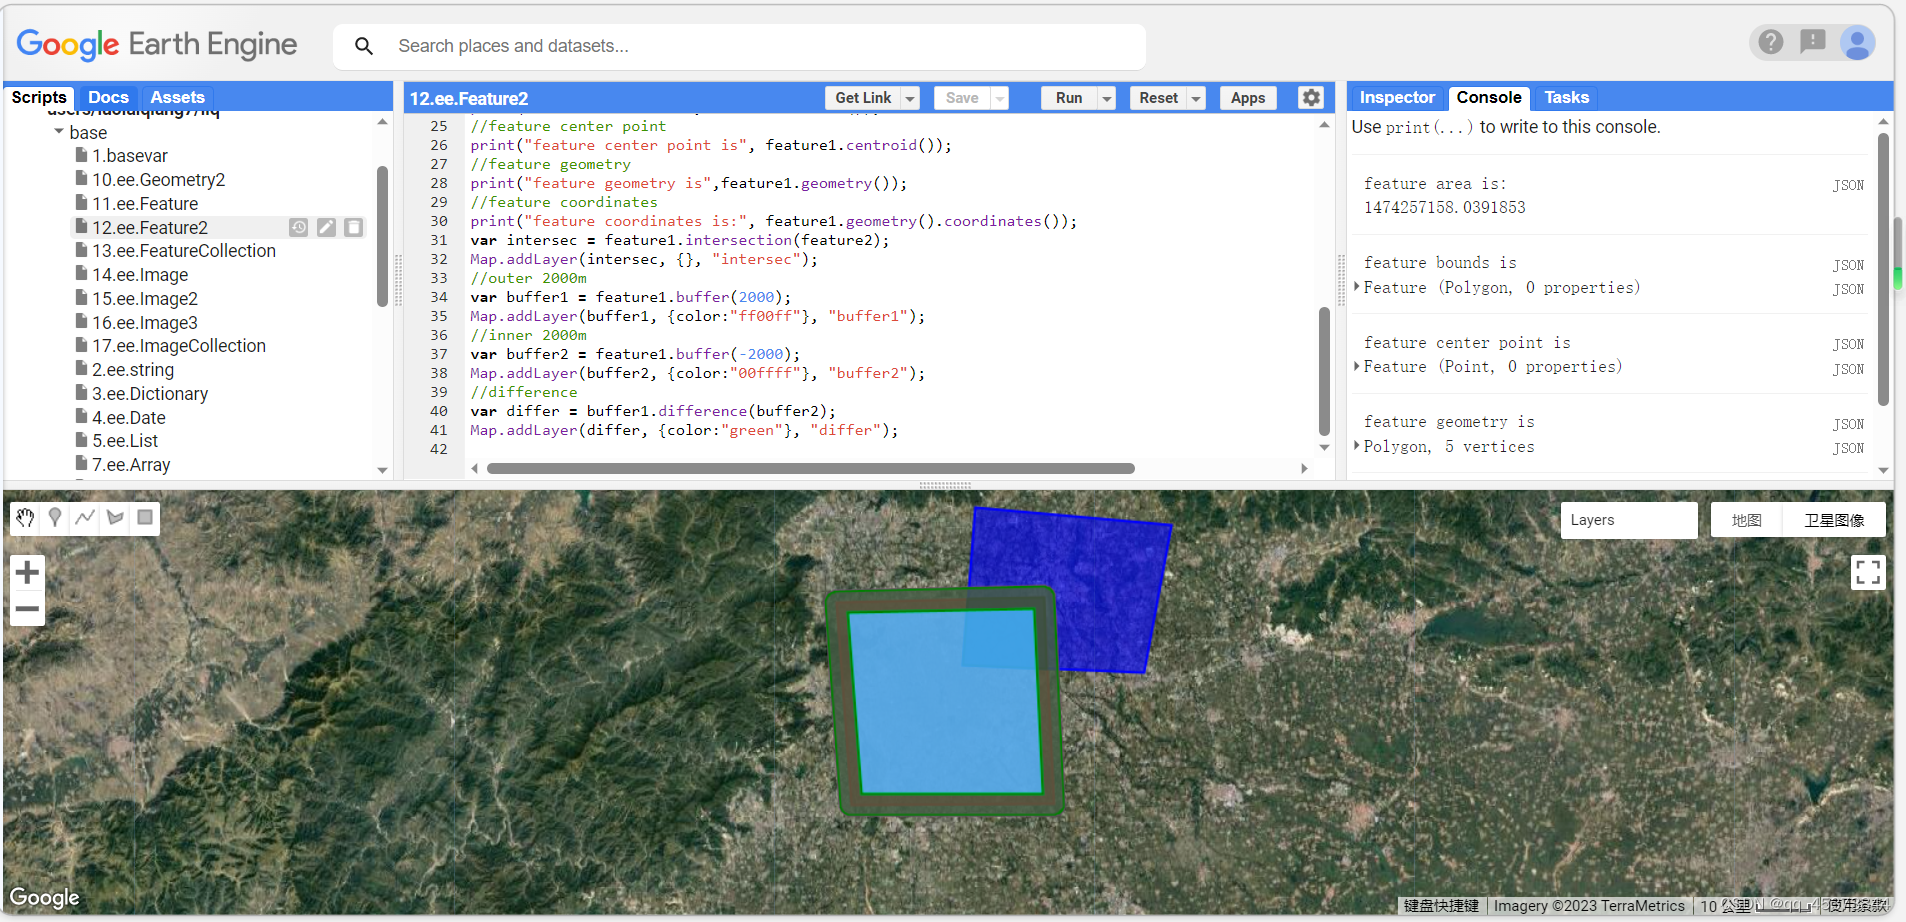
print("feature area is:", feature1.area());
//feature bounds
print("feature bounds is", feature1.bounds());
//feature center point
print("feature center point is", feature1.centroid());
//feature geometry
print("feature geometry is",feature1.geometry());
//feature coordinates
print("feature coordinates is:", feature1.geometry().coordinates());
var intersec = feature1.intersection(feature2);
Map.addLayer(intersec, {}, "intersec");
//outer 2000m
var buffer1 = feature1.buffer(2000);
Map.addLayer(buffer1, {color:"ff00ff"}, "buffer1");
//inner 2000m
var buffer2 = feature1.buffer(-2000);
Map.addLayer(buffer2, {color:"00ffff"}, "buffer2");
//difference
var differ = buffer1.difference(buffer2);
Map.addLayer(differ, {color:"green"}, "differ");
4.矢量数据集合 ee.FeatureCollection
矢量数据集合是开发中常用的数据格式,矢量数据的操作大都是对矢量集合数据的操作。
4.1展示矢量集合数据
使用地图的方法加载有填充的矢量数据和和只显示边界的矢量数据(style方法)。
4.2合并矢量集合数据
导入程序的矢量数据集合是多个时,则需要使用merge方法将所有的矢量集合数据先合并,再做相关操作
var fCol1 = ee.FeatureCollection([
  ee.Feature(null, {count: 1}),
  ee.Feature(null, {count: 2}),
  ee.Feature(null, {count: 3}),
  ]);

var fCol2 = ee.FeatureCollection([
  ee.Feature(null, {count: 11}),
  ee.Feature(null, {count: 21}),
  ee.Feature(null, {count: 31}),
  ]);

var fCol3 = fCol1.merge(fCol2);
print("fCol3", fCol3);
4.3过滤矢量集合数据
过滤矢量集合数据主要包括空间过滤、时间过滤、属性过滤这三个方法
var fCol = ee.FeatureCollection("users/landausers/provice");
var roi = /* color:#00fff */ee.Geometry.Point([116.3965580492448, 39.902170715539306]);
var sCol = fCol.filterBounds(roi);
print("select sCol", sCol);
Map.addLayer(sCol, {}, "sCol");
Map.centerObject(roi, 3);
4.4循环遍历矢量集合数据
a.map循环
var fCol = ee.FeatureCollection("users/landusers/provice");
var sCol = ee.fCol.limit(10);
print("pre sCol", sCol);
sCol = sCol.map(function(feature){
	var area = feature.area();
	feature = feature.set("area", area);
	return feature; });
print("add area properties", area);
代码分析:这段代码代码的主要功能是提取矢量集合中的10个数据,并为每个数据添加‘area’属性用来存储计算当前多边形的面积。
b.iterate循环
iterate是为了弥补map循环的缺点增加的循环方法。map循环的缺陷是只能对集合的所有元素做循环处理,但是没办法操作它目前具体索引或者其他元素.iterate先定义了一个初始值,然后遍历元素,可以实现初始值和这个元素的操作
API:定义iterate(algorithm, first)
algorithm:是回调方法,即每循环一次要调用的方法,格式为function(element_data, first_data){},第一个参数是集合中的每一个元素,第二个参数则是初始化定义的first的数据,返回值是计算的结果并且会重新赋值给first
first:定义的初始化无须是列表类型,但它最终和想要获得的结果是同一类型值
var fCol = ee.FeatureCollection("users/landusers/provice").limit(10);
print("fCol", fCol);
//添加面积属性
var fColList = fCol.iterate(function(data, list){
  data = ee.Feature(data);
  list = ee.List(list);
  var area = data.set("area", area);
  return list.add(data);
}, ee.List([]));
var sCol = ee.FeatureCollection(ee.List(fColList));
print("sCol", sCol);
//计算面积和
var totArea = fCol.iterate(function(data, area){
  data = ee.Feature(data);
  area = ee.Number(area);
  var_area = data.area();
  return area.add(_area);
}, ee.Number(0));
totalArea = ee.Number(totalArea);
print("totalArea", totalArea);
4.5矢量集合数据统计分析aggreate_xxxx
在矢量集合数据的API中,大部分的数据是aggrate_xxx类型的方法,它们的主要作用就是用来做各种数据统计,参数就是矢量数据的具体名称
//generate
var fCol = ee.FeatureCollection([
  ee.Feature(null, {count:1}),
  ee.Feature(null, {count:2}),
  ee.Feature(null, {count:3})
]);
print("count max", fCol.aggregate_max("count"));
print("count min", fCol.aggregate_min("count"));
print("count mean", fCol.aggregate_mean("count"));
4.6矢量数据转换为栅格数据
在Earth Engine 中要实现矢量转换为栅格只需要调用reduceToImage(properties,reducer)
properties是要转为栅格数据的属性,reducer是使用什么计算方式
var roi = /* color:#0b4a8b */ ee.Geometry.Polygon(
  [[[-88.0668203125, 43.29317317568222], [-85.5179921875, 44.80909524778966],
  [-89.9125234375, 47.60613790534617], [-95.0101796875, 46.52860904336895]]]);
Map.centerObject(roi, 6);
var counties = ee.FeatureCollection("TIGER/2018/ounties").filterBounds(roi);
counties = counties.map(function(f){
  return f.set("AWATER", ee.Number(f.get("AWATER"))/divide(1000000));
});
var properties = ["AWATER"];
var image = counties.filter(ee.Filter.neq("AWATER", null)).reduceToImage({
  properties:properties,
  reducer:ee.Reducer.mean()
});
print("generate image", image);
var style = {color:"red", fillColor:"00000000"};
Map.addLayer(image, {min:0, max:3000}, "image");
Map.addLayer(counties.style(style), {}, "counties");
5.影像数据ee.Image
5.1基本属性设置和获取
在Earth Engine中基本属性和设置主要通过set()和get()方法获取,其他属性操作方法如获取波段名称列表方法bandNames()、获取波段类型列表方法bandTypes()、获取ID方法id()等。
//基本属性信息设置和获取
var image = ee.Image("LANDSAT/LC08/C01/T1_TOA/LC08_123037_20180611");
print("image", image);
print("image bandNames", image.bandNames());
print("image bandTypes", image.bandTypes());
print("image date", image.date());
print("image id", image.id());
print("cloud cover", image.get("CLOUD_COVER"));
5.2影像之间数学运算
a.直接数学运算
Map.setOptions("SATELLITE");
var image = ee.Image("LANDSAT/LC08/C01/T1_TOA/LC08_123037_20180611");
Map.centerObject(image, 7);
var b4 = image.select("B4");
var b5 = image.select("B5");
var ndvi = b5.subtract(b4).divide(b5.add(b4));
var visParam = {
  min:-0.2,
  max:0.8,
  palette:'FFFFFF, CE7E45, DF923D, F1B555, FCD163, 99B718, 74A901, 66A000, 529400,' +
  '3E8601, 207401, 056201, 004C00, 023B01, 012E01, 011D01, 011301'
};
Map.addLayer(ndvi, visParam, "ndvi");
b.normalizedDifference
(A - B)/(A + B)公式的缩略写法。
Map.setOptions("SATELLITE");
var image = ee.Image("LANDSAT/LC08/C01/T1_TOA/LC08_123037_20180611");
Map.centerObject(image, 7);
var ndvi = image.normalizedDifference(["B5", "B4"]);
var visParam = {
  min:-0.2,
  max:0.8,
  palette:'FFFFFF, CE7E45, DF923D, F1B555, FCD163, 99B718, 74A901, 66A000, 529400,' +
  '3E8601, 207401, 056201, 004C00, 023B01, 012E01, 011D01, 011301'
};
Map.addLayer(ndvi, visParam, "ndvi");
c.expression
主要用于复杂的指数计算,最大的优点是可以将要计算的内容直观的展示出来。
| + - * / % ** | Add, Subtract, Multiply, Divide, Modulus, Exponent |
| == != < > <= >= | Equal, Not Equal, Less Than, Greater Than, etc… |
| && | |
| ?: | If then else |
//主要用于复杂的指数计算,如EVI
Map.setOptions("SATELLITE");
var image = ee.Image("LANDSAT/LC08/C01/T1_TOA/LC08_123037_20180611");
Map.centerObject(image, 7);
var visParam = {
  min:-0.2,
  max:0.8,
  palette:'FFFFFF, CE7E45, DF923D, F1B555, FCD163, 99B718, 74A901, 66A000, 529400,' +
  '3E8601, 207401, 056201, 004C00, 023B01, 012E01, 011D01, 011301'
};
var EVI = image.expression(
  '2.5 * ((NIR - RED) / (NIR + 6 *RED - 7.5 * BLUE + 1))', {
    'NIR':image.select("B5"),
    'RED':image.select("B4"),
    'BLUE':image.select("B2")
  }).rename("EVI");
Map.addLayer(EVI, visParam, "EVI");
Map.centerObject(image, 6);
5.3统计计算Reducer
a.计算reducer
主要用于对多波段的影像做统计分析,如计算三个波段的均值,ee.Reducer,mean()
Map.setOptions("SATELLITE");
var image = ee.Image("LANDSAT/LC08/C01/T1_TOA/LC08_123037_20180611").select("B[2-4]");
Map.centerObject(image, 7);
var visParam = {
  min:0,
  max:0.3,
  bands:["B4", "B3", "B2"]
};
Map.addLayer(image, visParam, "rawImage");
var mean = image.reduce(ee.Reducer.mean());
print("image reduce value is:", mean);
Map.addLayer(mean, {min:0, max:0.3}, "meanImage");
b.reduceRegion(reducer, geometry, scale, crs, crsTransform, bestEffort, maxPixels, tileScale)
//reducer:计算方法
//geometry:统计区域的边界
//scale:计算统计使用的分辨率
//crs:投影信息
//crsTransform:投影信息参数
//bestEffort:如果统计区域内像素过多,是否只取可以计算的最大像素数据
//maxPixels:统计区域最多可以有多少像素
//tileScale:系统内部优化参数,填写2的N次方,避免出现计算内存不足等问题
//常用参数是:reducer、geometry、scale、maxPixels和tileScale
var roi = /* color:#98ff00 */ee.Geometry.Polygon([[[114.6295974731449, 33.357067677774594],
  [114.63097076416011, 33.32896028884253], [114.68315582275386, 33.33125510961763],
  [114.68178253173824, 33.359361757948754]]]);
Map.centerObject(roi, 7);
Map.setOptions("SATELLITE");
var image = ee.Image("LANDSAT/LC08/C01/T1_TOA/LC08_123037_20180611");
var ndvi = image.normalizedDifference(["B5", "B4"]).rename("NDVI");
var visParam = {
  min:-0.2,
  max:0.8,
  palette:["FFFFFF", "CE7E45", "DF923D", "F1B555", "FCD163", "99B718", "74A901", "66A000",
  "529400", "3E8601", "207401", "056201", "004C00", "023B01", "012E01", "011D01", "011301"]};
Map.addLayer(ndvi, visParam, "NDVI");
Map.addLayer(roi, {color:'red'}, "roi");
//计算指定区域的NDVI均值
var mean = ndvi.reduceRegion({
  reducer:ee.Reducer.mean(),
  geometry:roi,
  scale:30
});
print("reduceRegion value is:", mean);
var ndviValue = ee.Number(mean.get("NDVI"));
print("ndvi mean is:", ndviValue);
c.reduceRegions(collection, reducer, scale, crs, crsTransform, tileScale)
//collection:统计分析使用的矢量集合数据
//reducer:计算方法
//scale:计算统计使用的分辨率
//crs:投影信息
//crsTransform:投影信息参数
//tileScale:系统内部优化参数,填写2的N次方,避免出现计算内存不足等问题
//这个方法实现的功能同reduceRegion()类似,即对指定区域进行统计分析,不同的是这个方法可以对每一个矢量区域做
//统计,如果传入的矢量集合包含多个区域,最终将每个区域计算结果都统计出来,并将结果写入新的矢量数据且返回这个矢量数据
var roi = /* color:#98ff00 */ee.FeatureCollection([ee.Feature(ee.Geometry.Polygon(
  [[[114.62959747314449, 33.357067677774594], [114.63097076416011, 33.32896028884253],
  [114.68315582275386, 33.33125510961763]]]), {"system:index": "0"}),
  ee.Feature(ee.Geometry.Polygon([[[114.72092104073545, 33.35448759404677],
  [114.72778749581357, 33.32580564060472], [114.77585268136045, 33.33039538788689]]]),
  {"system:index":"1"}),
  ee.Feature(ee.Geometry.Polygon([[[114.7181744587042, 33.269561620989904],
  [114.7181744587042, 33.29826208049367], [114.67285585518857, 33.30055770950425]]]),
  {"system:index":"2"})]);
Map.centerObject(roi, 9);
Map.setOptions("SATELLITE");
var image = ee.Image("LANDSAT/LC08/C01/T1_TOA/LC08_123037_20180611");
var ndvi = image.normalizedDifference(["B5", "B4"]).rename("NDVI");
visParam = {
  min:-0.2,
  max:0.8,
  palette:["FFFFFF", "CE7E45", "DF923D", "F1B555", "FCD163", "99B718", "74A901", "66A000",
  "529400", "3E8601", "207401", "056201", "004C00", "023B01", "012E01", "011D01", "011301"]
};
Map.addLayer(ndvi, visParam, "NDVI");
Map.addLayer(roi, {color:"red"}, "roi");
var mean = ndvi.reduceRegions({
  collection:roi,
  reducer:ee.Reducer.mean(),
  scale:30
});
print("reduceRegions value isL", mean);
5.4栅格数据转为矢量数据
//reduceToVectors(reducer, geometry, scale, geometryType, eightConnected, labelProperty, crs,
//crsTransform, bestEffort, maxPixels, tileScale, geometryInNativeProjection)
//reducer:计算方法
//geometry:范围
//scale:分辨率
//crs:投影信息
//crsTransform:投影信息参数
//bestEffort:如果统计区域内像素过多,是否只提取有限像素实现计算要求
//maxPixels:最大像素数量,默认1e8,通常设置为1e13;
//tileScale:系统内部优化参数,填写2的N次方,避免出现计算内存不足等问题
//geometryInNativeProjection:在像素的投影信息下创建矢量数据,默认false
//reduceToVectors
var roi = /* color:#999900 */ee.Geometry.Polygon([[[116.21437502022764, 39.62355024325724],
  [116.82960939522764, 39.75881346356145], [116.75270509835264, 40.213367999414956],
  [115.97816896554014, 40.17140672221596]]]);
Map.centerObject(roi, 8);
var image = ee.Image("NOAA/DMSP-OLS/NIGHTTIME_LIGHTS/F182012").select("stable_lights").clip(roi);
//计算灯光像素值大于30并且小于60的值变为1,大于60的值变为2,小于30的值变为0
var mask = image.gt(30).add(image.gt(60));
//将所有小于等于0,或者为None的数据全部掩膜掉
mask = mask.updateMask(mask);
//添加新的影像数据为新的波段
mask = mask.addBands(image);
print("mask", mask);
var vectors = mask.reduceToVectors({
  reducer:ee.Reducer.mean(),
  geometry:roi,
  scale:1000,
  geometryType:"polygon",
  maxPixels:1e13
});
print("vectors", vectors);
Map.addLayer(mask.select("stable_lights"), {min:1, max:2, palette:["red", "green"]}, "image");
var display = ee.Image().toByte().paint({
  featureCollection:vectors,
  color:null,
  width:1
});
Map.addLayer(display, {palette:"blue"}, "display");
6.影像集合
6.1获取基本属性
可以通过几个方法获得基本属性,获取影像集合大小size()、获取和设置影像集合的属性set()和get()、固定筛选指定个数影像limit()
var l8Col = ee.ImageCollection("LANDSAT/LC08/C01/T1_TOA");
var newCol = l8Col.limit(10);
print(newCol);
print(newCol.size());
6.2过滤筛选
常用的方法有filterBounds、filterDate、filterMetadata、filter等
var roi = /* color:#98ff00 */ee.Geometry.Polygon(
  [[[114.62959747314449, 33.357067677774594], [114.63097076416011, 33.32896028884253],
  [114.68315582275386, 33.33125510961763], [114.68178253173824, 33.359361757948754]]]);
var l8Col_1 = l8Col.filterBounds(roi).filterDate("2018-1-1", "2019-1-1");
print(l8Col_1);
6.3循环遍历
//定义roi,为影像集合数据添加NDVI波段
var roi_1 = /* color:#0b4a8b */ee.Geometry.Polygon(
  [[[120.95600585937495, 23.860418455104288], [121.10981445312495, 23.860418455104288],
  [121.12080078124995, 23.960853112476986], [120.94501953124995, 23.960853112476986]]]);
var l8Col_2 = l8Col.filterBounds(roi_1).filterDate("2018-1-1", "2018-6-1").map(function(image){
  var ndvi = image.normalizedDifference(["B5", "B4"]);
  return image.addBands(ndvi.rename("NDVI"));
}).select("NDVI");
print("l8COl_2", l8Col_2);
6.3.1.map
使用map循环遍历影像集合,计算每一景影像上的roi区域内的NDVI均值,并把这个均值结果记录到ndvi属性中
var sCol1 = l8Col_2.map(function(image){
  var dict = image.reduceRegion({
    reducer:ee.Reducer.mean(),
    geometry:roi,
    scale:30
  });
  var ndvi = ee.Number(dict.get("NDVI"));
  image = image.set("ndvi", ndvi);
  return image;
});
print("sCol1",sCol1);
6.3.2.iterate
计算每一景影像上ndvi值与前一景影像ndvi值的插值
var imgColList = sCol1.iterate(function(data, list){
  data = ee.Image(data);
  list = ee.List(list);
  var preNDVI = ee.Image(list.get(-1)).get("ndvi");
  preNDVI = ee.Number(preNDVI);
  var curNDVI = ee.Number(data.get("ndvi"));
  var differ = curNDVI.subtract(preNDVI);
  data = data.set("differ", differ);
  return list.add(data);
}, ee.List([sCol1.first()]));
imgColList = ee.List(imgColList);
imgColList = imgColList.slice(1);
var sCol2 = ee.ImageCollection.fromImages(imgColList);
print("sCol2", sCol2);
6.5统计计算
6.5.1.reduce(reducer, parallelScale)
//reducer:使用计算方法
//parallelScale:缩放比例
Map.centerObject(roi, 7);
Map.setOptions("SATELLITE");
var l8Col = l8Col.filterBounds(roi).filterDate("2018-1-1", "2019-1-1").map(ee.Algorithms.Landsat.simpleCloudScore)
  .map(function(image){
    return image.updateMask(image.select("cloud").lte(20));
  }).map(function(image){
    var ndvi = image.normalizedDifference(["B5", "B4"]).rename("NDVI");
    return image.addBands(ndvi);
  }).select("NDVI");
//配置显示规则
var visParam = {
  min:-0.2,
  max:0.8,
  palette:["FFFFFF", "CE7E45", "DF923D", "F1B555", "FCD163", "99B718", "74A901", "66A000",
  "529400", "3E8601", "207401", "056201", "004C00", "023B01", "012E01", "011D01", "011301"]
};
var img = l8Col.reduce(ee.Reducer.mean());
Map.addLayer(img, visParam, "NDVI");
Map.addLayer(roi, {color:"red"}, "roi");
6.5.2.reduceColumns(reducer, selectors, weightSelectiors)
//reducer:使用计算方法
//selectors:属性列表
//weightSelectors:属性列表对应的权重信息
Map.centerObject(roi, 7);
Map.setOptions("SATELLITE");
var l8Col = l8Col.filterBounds(roi).filterDate("2018-1-1", "2019-1-1").map(ee.Algorithms.Landsat.simpleCloudScore)
  .map(function(image){
    return image.updateMask(image.select("cloud").lte(20));
  });
  //将影像集合数据中每一个元素的属性system:index聚合在一起以列表形式返回
var indexs = l8Col.reduceColumns(ee.Reducer.toList(), ["system:index"]).get("list");
print("indexs", indexs);








![[ 应急响应基础篇 ] evtx提取安全日志 事件查看器提取安全日志](https://img-blog.csdnimg.cn/ce0be5ee41dc4990bfe0536d72683fdb.png)

