1写在前面
天气开始暖和了☀️,发现旅游的人好多啊!~🥲
不知道自己什么时候能有时间出去看看外面的世界,实在是太忙了。😷
最近用到的有个包感觉很不错,分享给大家,funkyheatmap包。😘
完美可视化数据,包括字符型和数值型。🤩
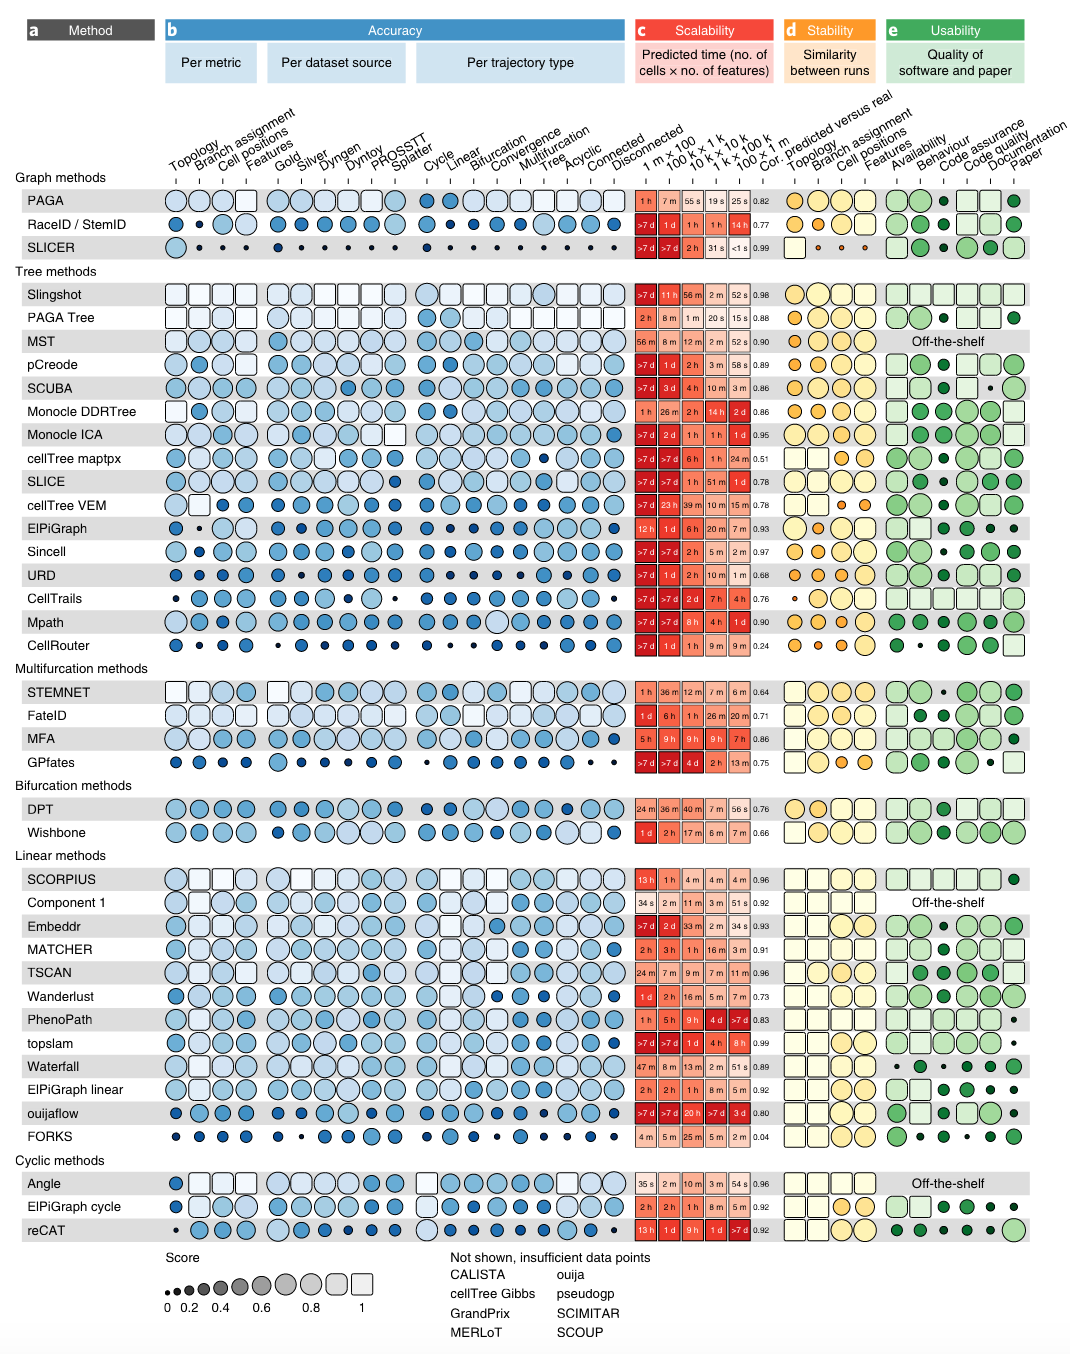
这个包是出自Nature Biotechnology中,文章在这里:👇
Saelens, W., Cannoodt, R., Todorov, H. et al. A comparison of single-cell trajectory inference methods. Nat Biotechnol 37, 547–554 (2019). https://doi.org/10.1038/s41587-019-0071-9
IF: 68.164 Q1 IF: 68.164 Q1

颜值还是蛮高的,大家学起来啊,可以用来可视化临床信息的baseline、基因的基本信息等等。🥰
2用到的包
rm(list = ls())
library(tidyverse)
library(funkyheatmap)
3示例数据
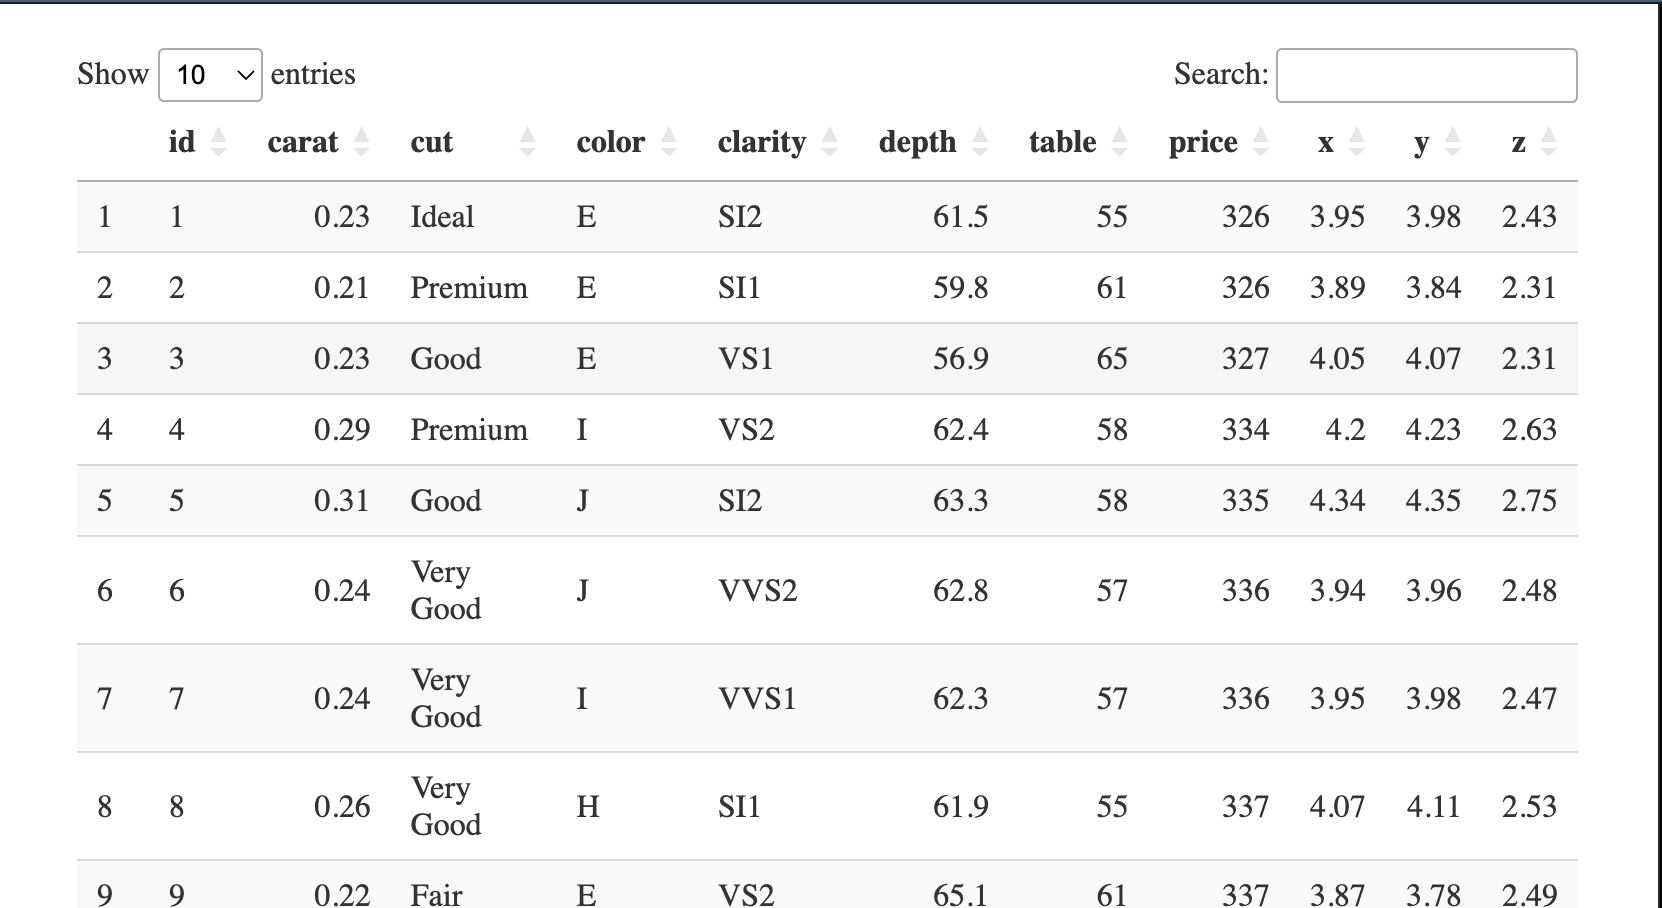
今天用到的是diamonds数据,非常经典的dataset。😙
dat1 <- diamonds %>%
  rownames_to_column(., "id") %>%
  head(20)

DT::datatable(dat1)
4简单可视化
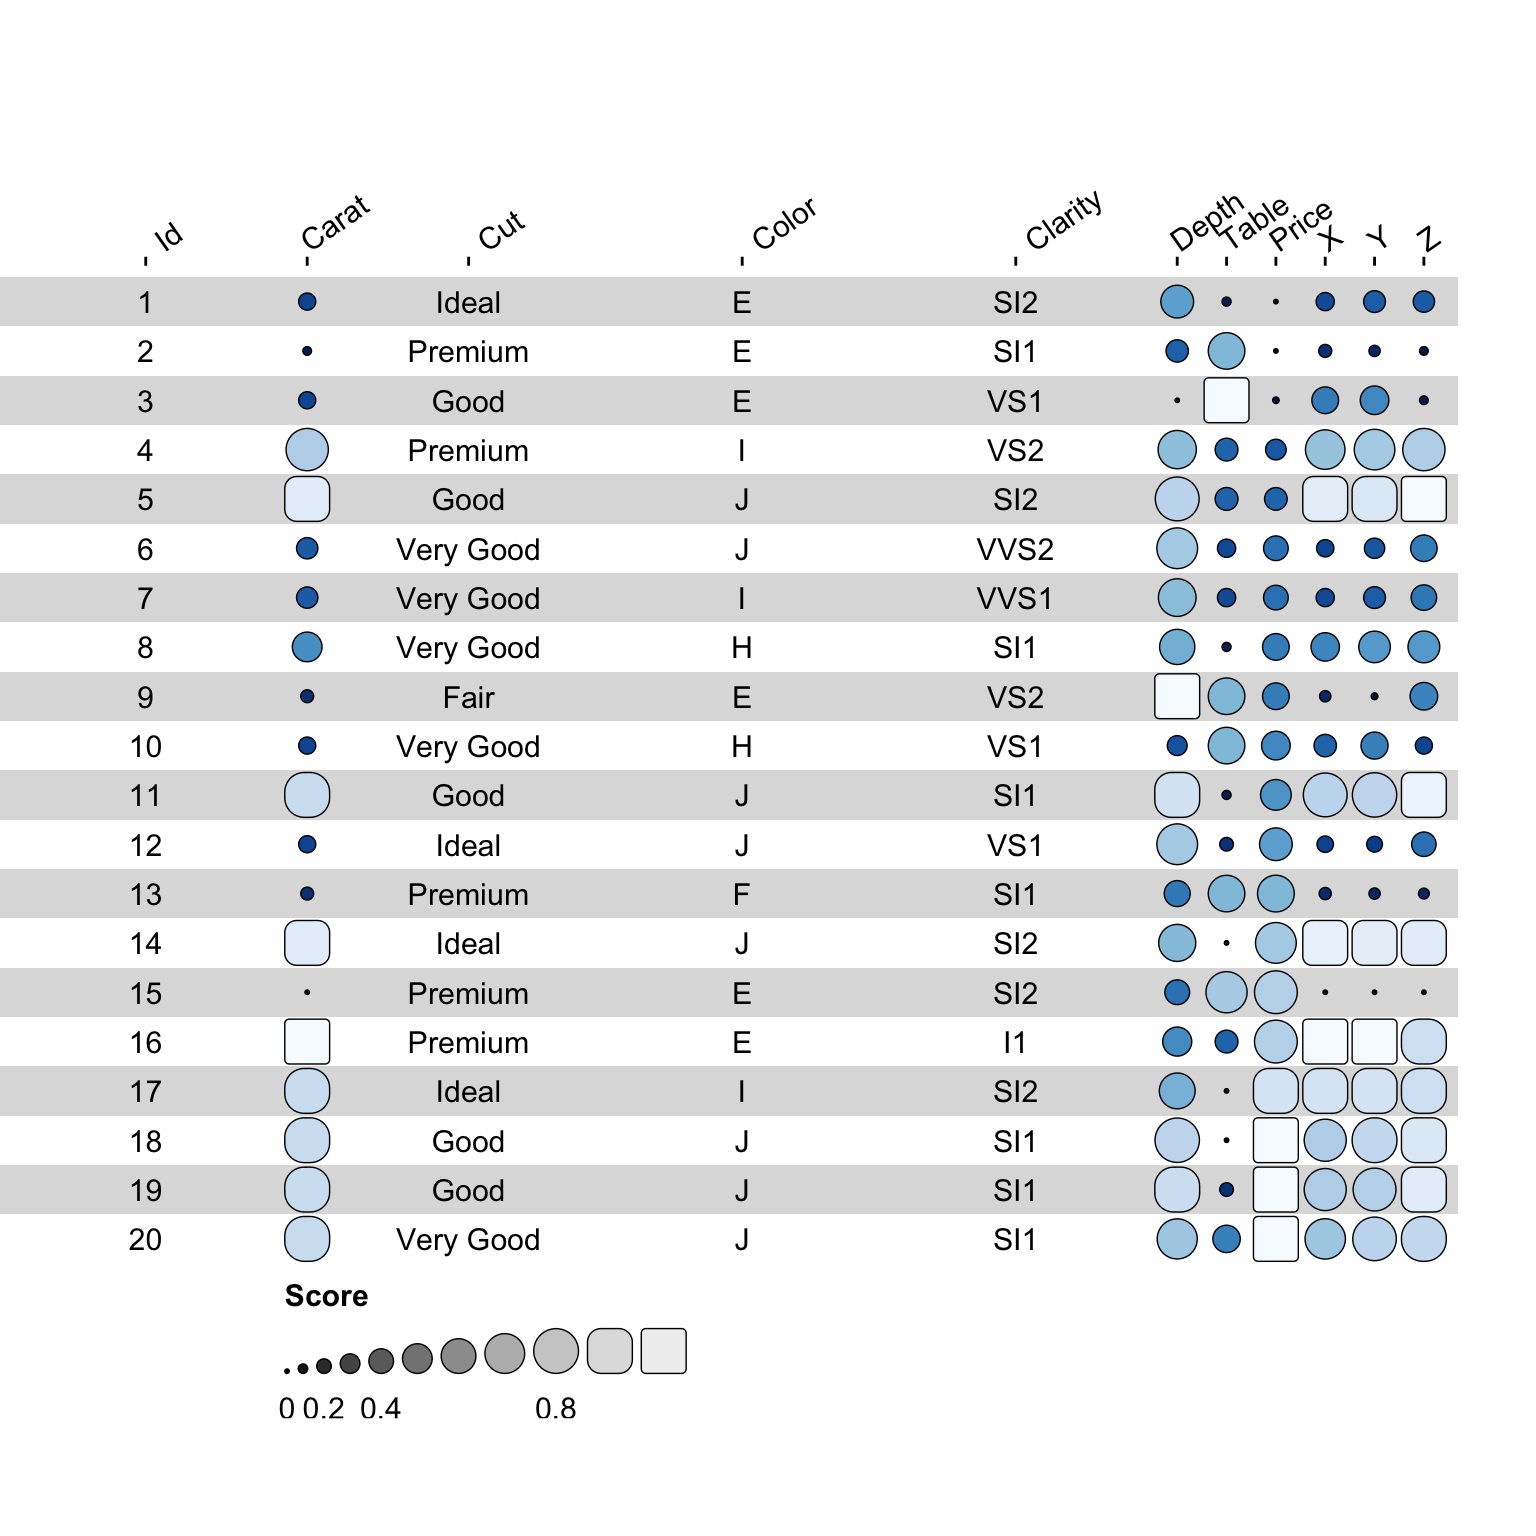
大家直接使用funky_heatmap即可,是不是颜值还不错。😜
funky_heatmap(dat1,
              column_info = NULL,
              row_info = NULL,
              column_groups = NULL,
              row_groups = NULL,
              palettes = NULL,
              scale_column = T,
              add_abc = T,
              col_annot_offset = 3,
              col_annot_angle = 35,
              removed_entries = NULL,
              expand = c(xmin = 0, xmax = 2, ymin = 0, ymax = 0)
              )
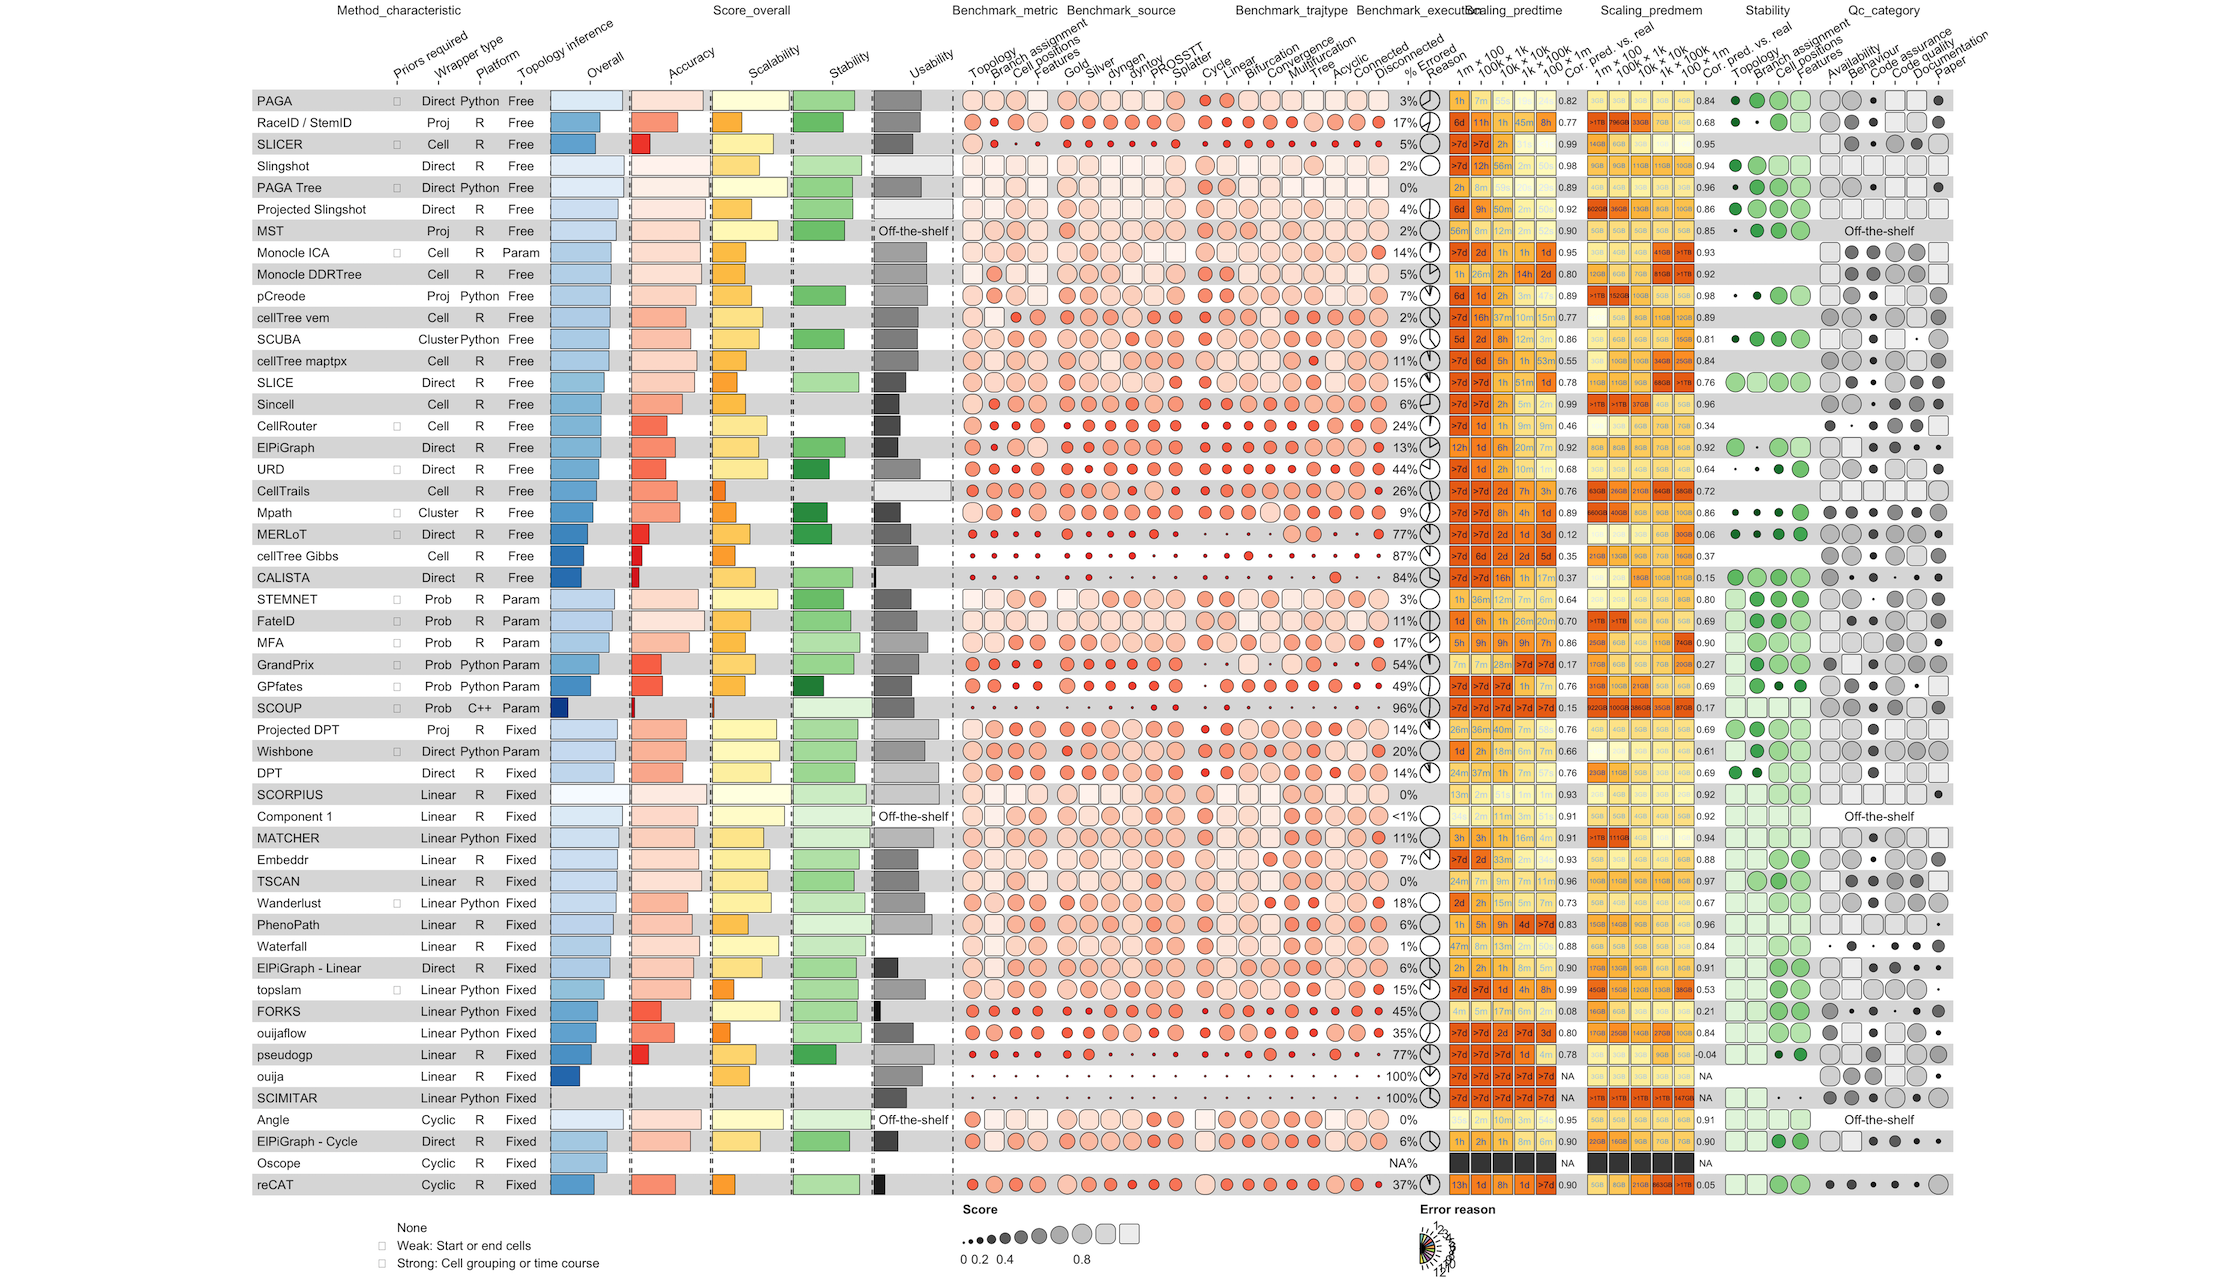
5复杂绘图
我们再复现一下这篇Nature Biotechnology上的图吧,需要用到kableExtra包内的数据。🤩
5.1 加载数据
library(kableExtra)

data("dynbenchmark_data")
5.2 查看数据
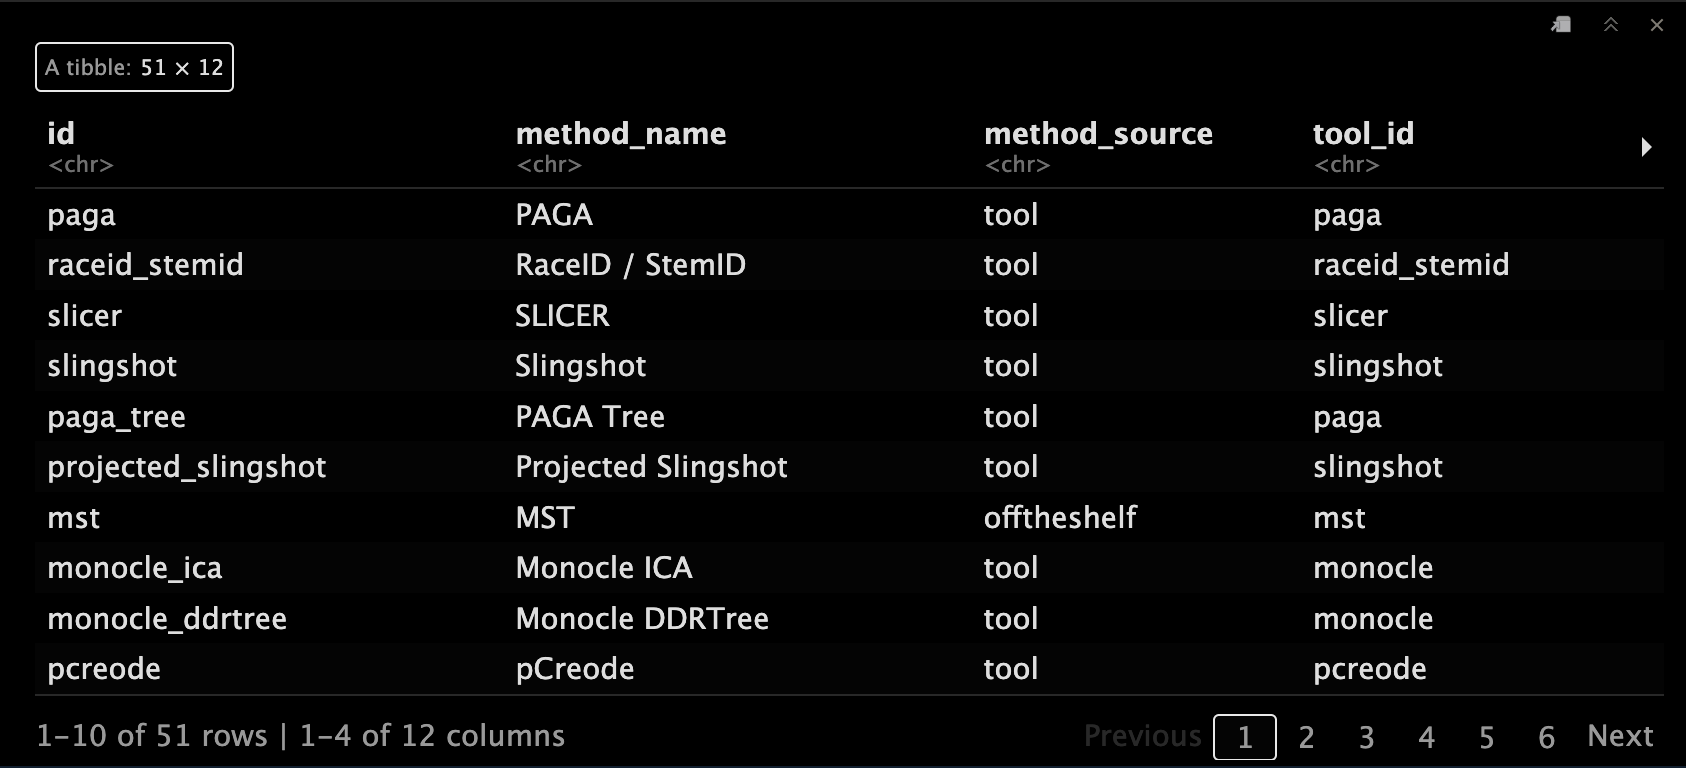
看一下数据类型吧。😘
dat2 <- dynbenchmark_data$data
dat2[,1:12]
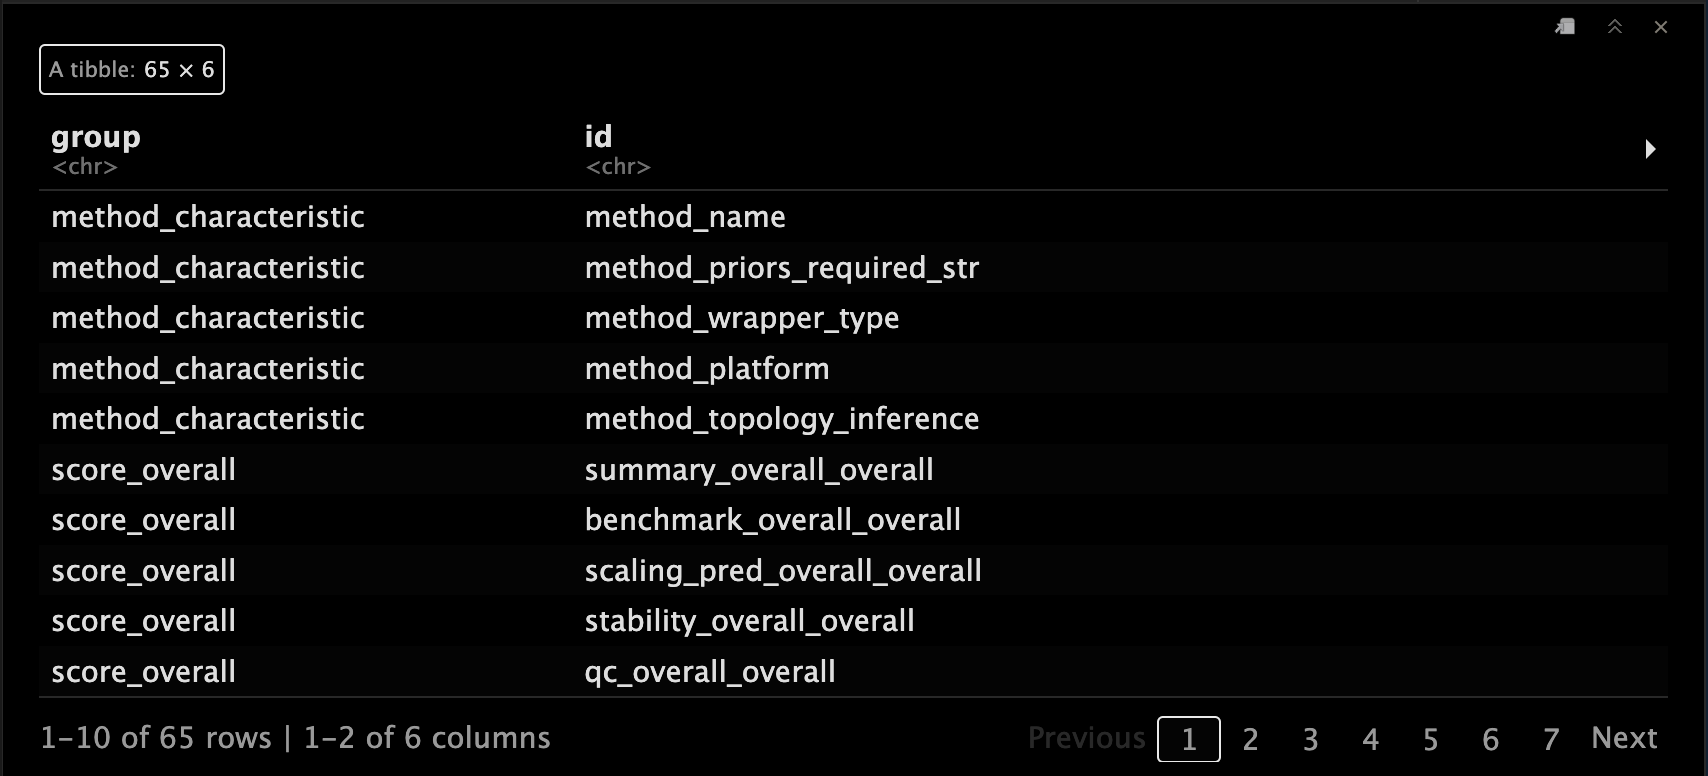
5.3 提取列名
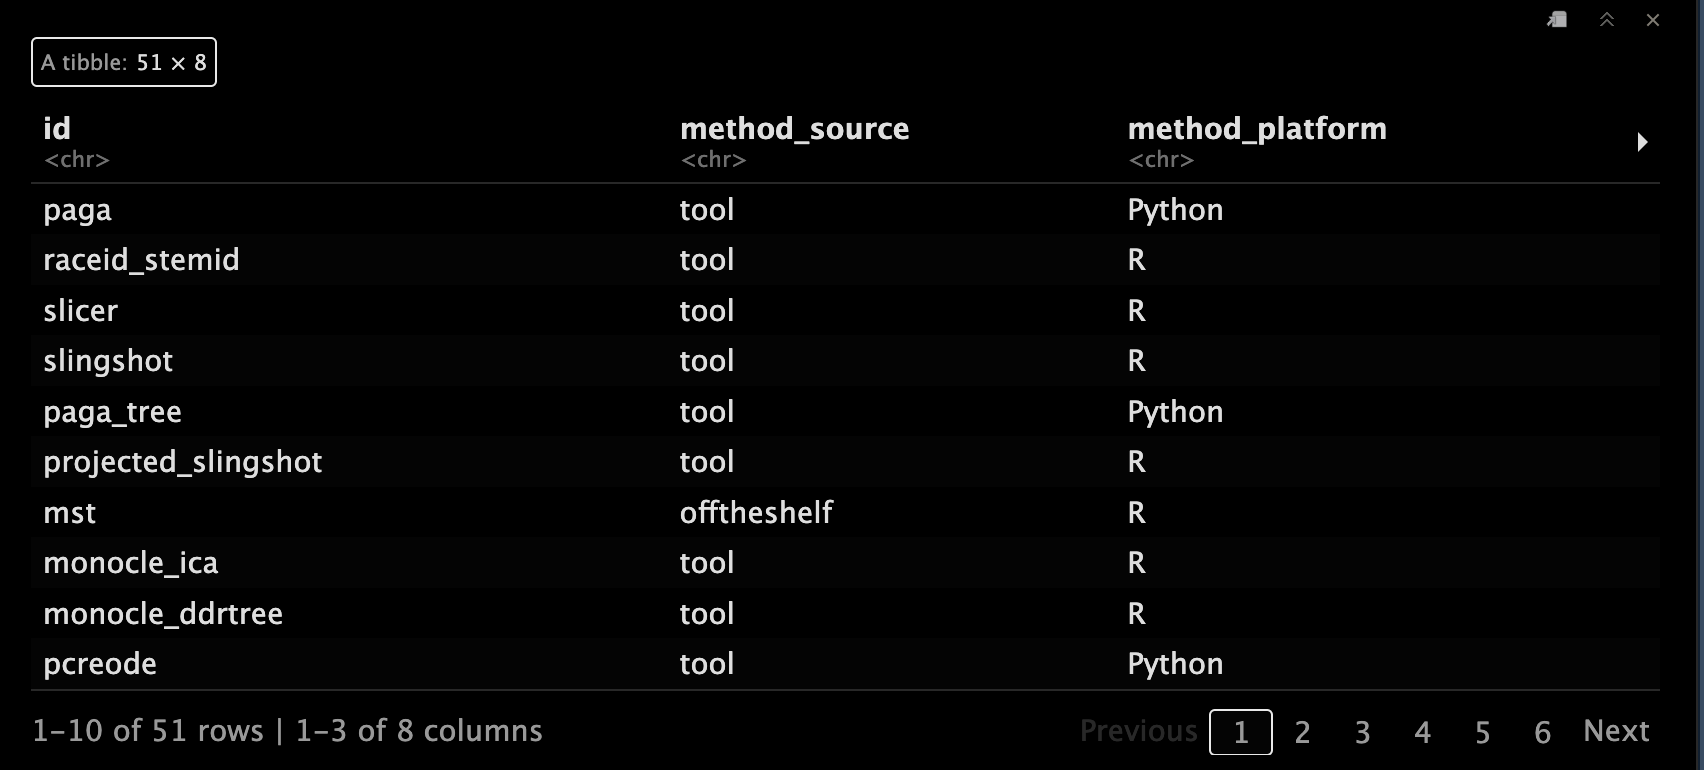
数据太大,我们先只提取其中几列进行可视化吧。😷
preview_cols <- c(
  "id",
  "method_source",
  "method_platform",
  "benchmark_overall_norm_correlation",
  "benchmark_overall_norm_featureimp_wcor",
  "benchmark_overall_norm_F1_branches",
  "benchmark_overall_norm_him",
  "benchmark_overall_overall"
)
dat2[,preview_cols]
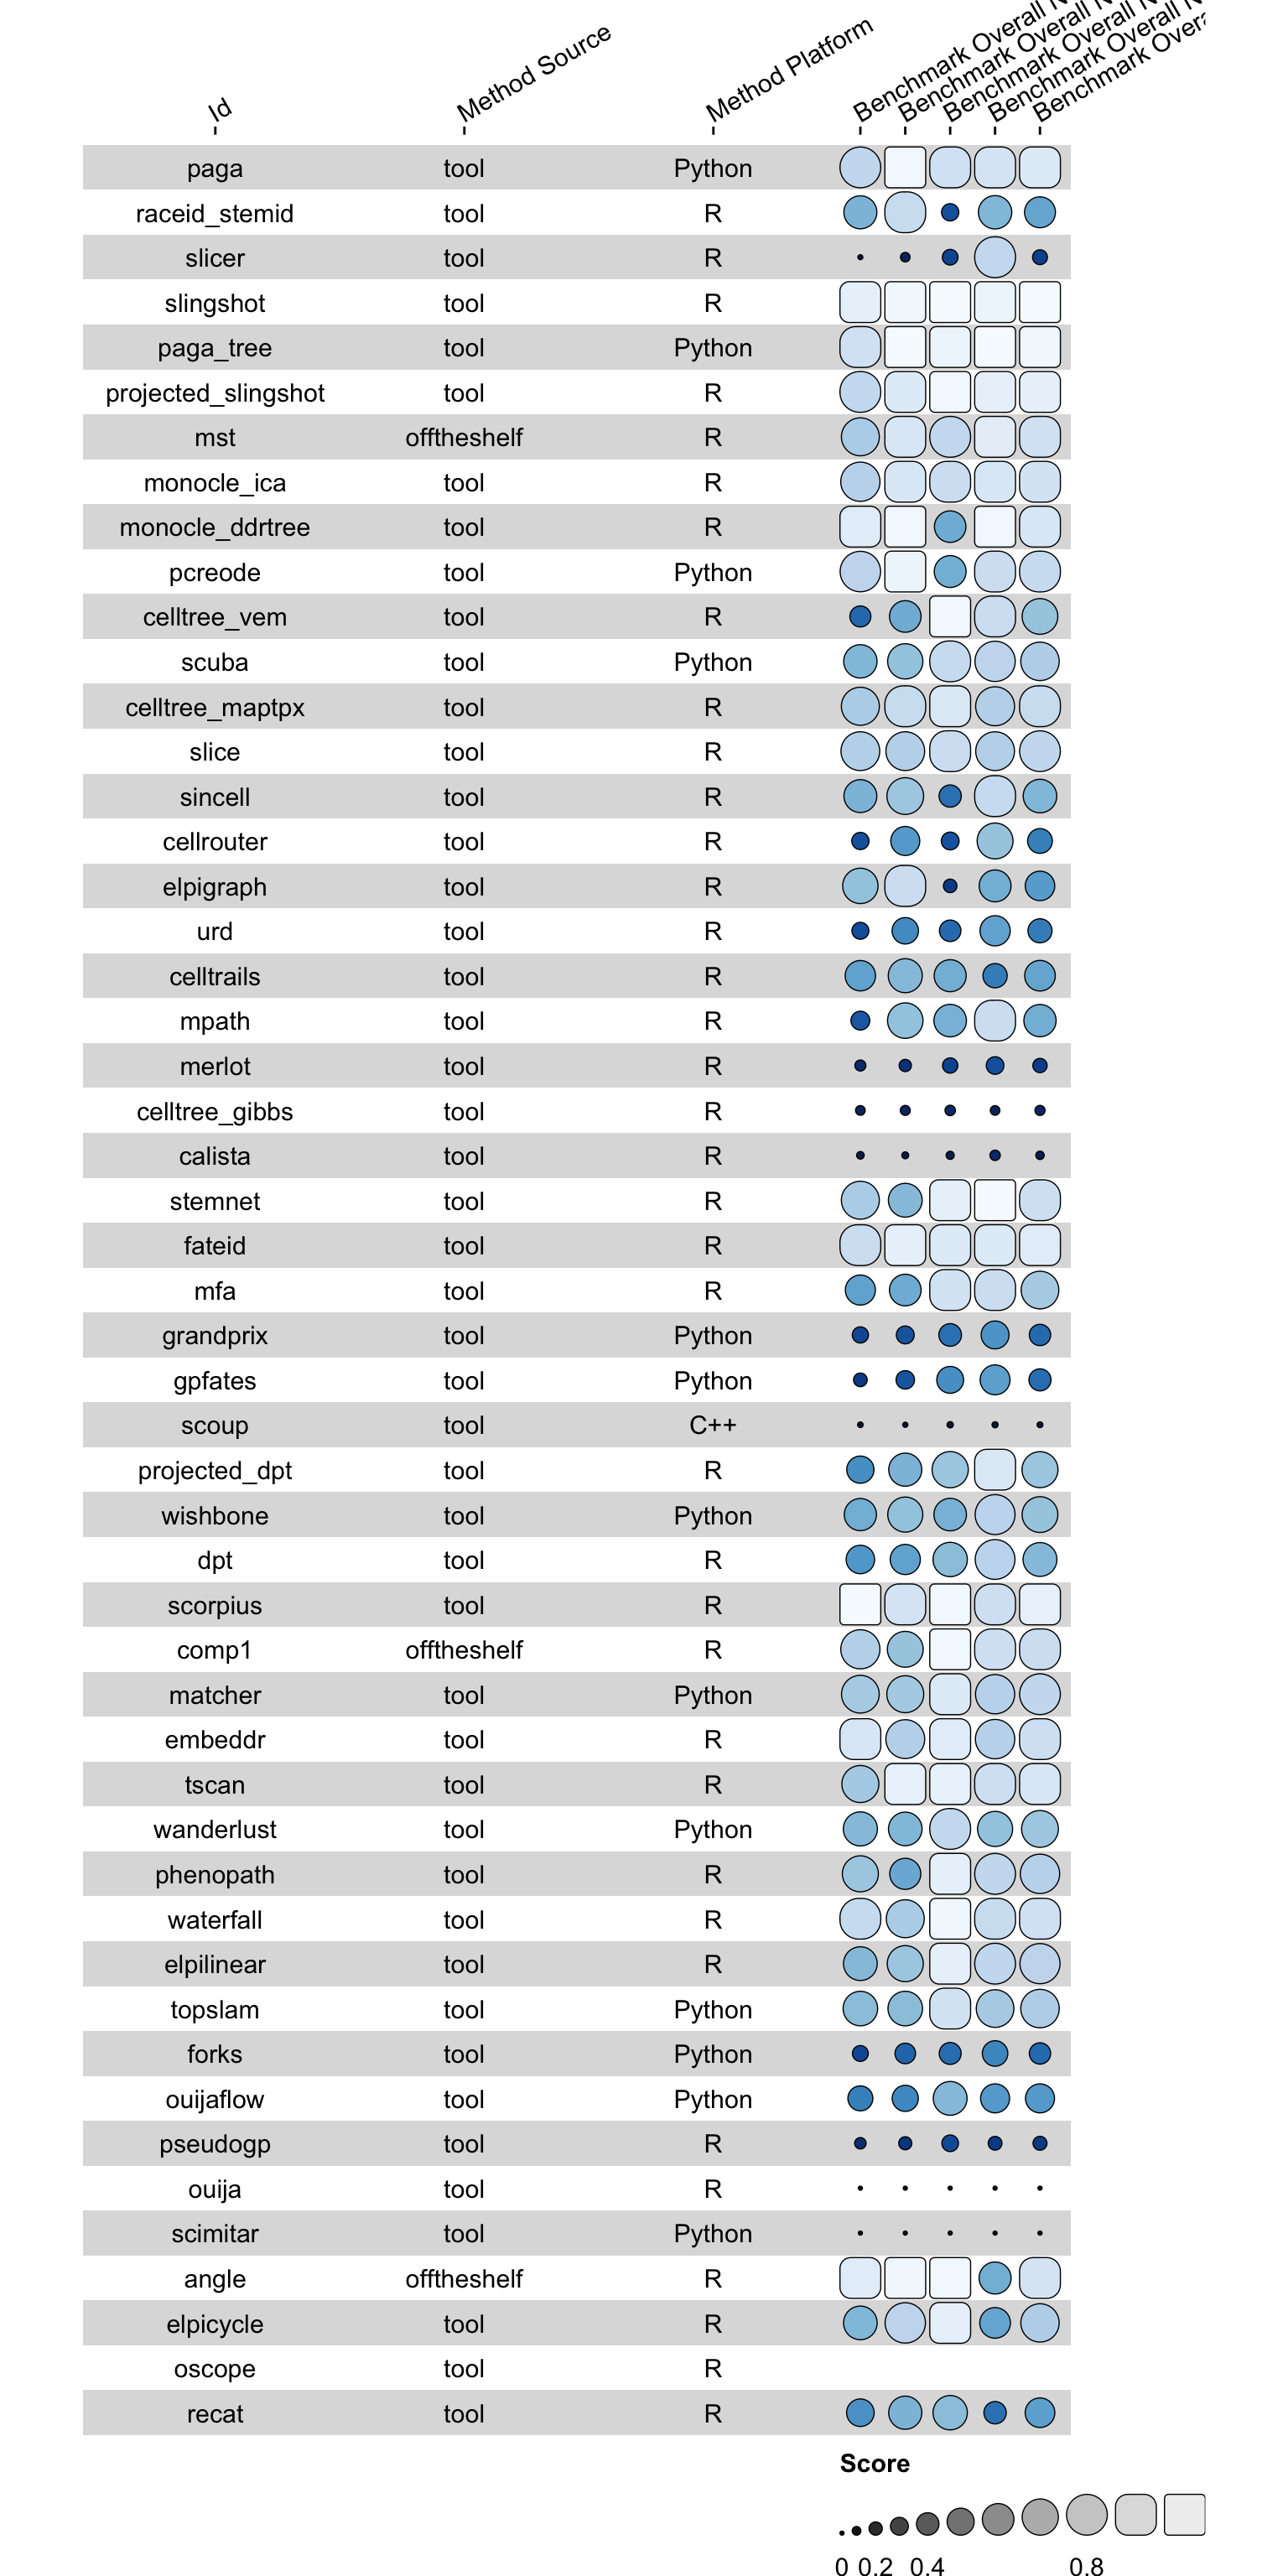
5.4 初步绘图
funky_heatmap(dat2[,preview_cols])
5.5 列信息
提取一下列信息,后面会用到。🤒
column_info <- dynbenchmark_data$column_info
column_info
5.6 再次可视化
把data都输入进去吧,再画一下图看看,颜值高多啦。😂
funky_heatmap(dat2, column_info = column_info)
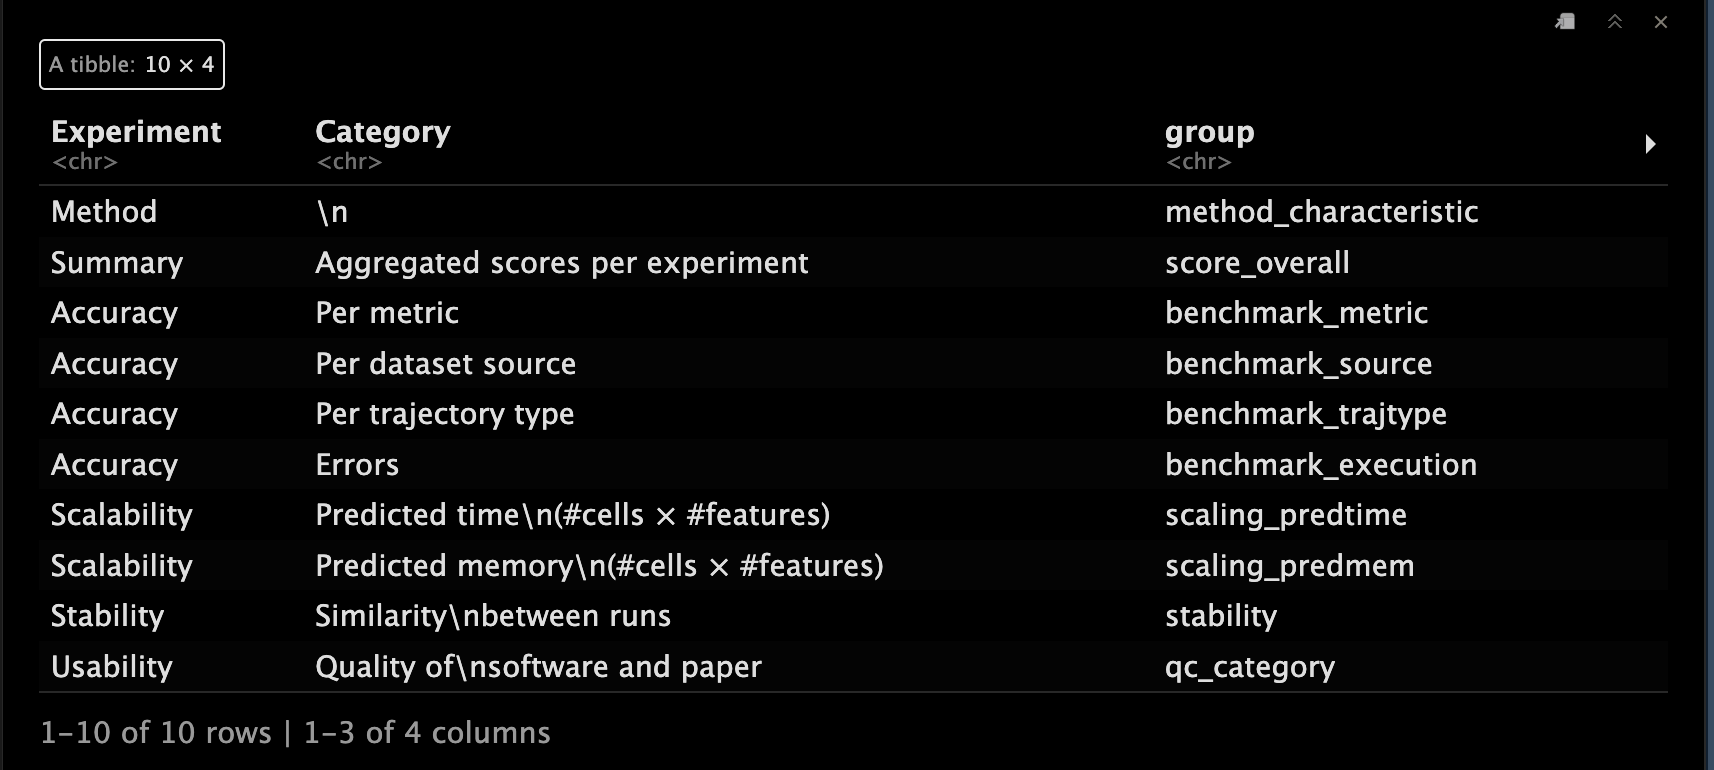
5.7 列的分组信息
column_groups <- dynbenchmark_data$column_groups
column_groups
5.8 行信息
row_info <- dynbenchmark_data$row_info
row_info

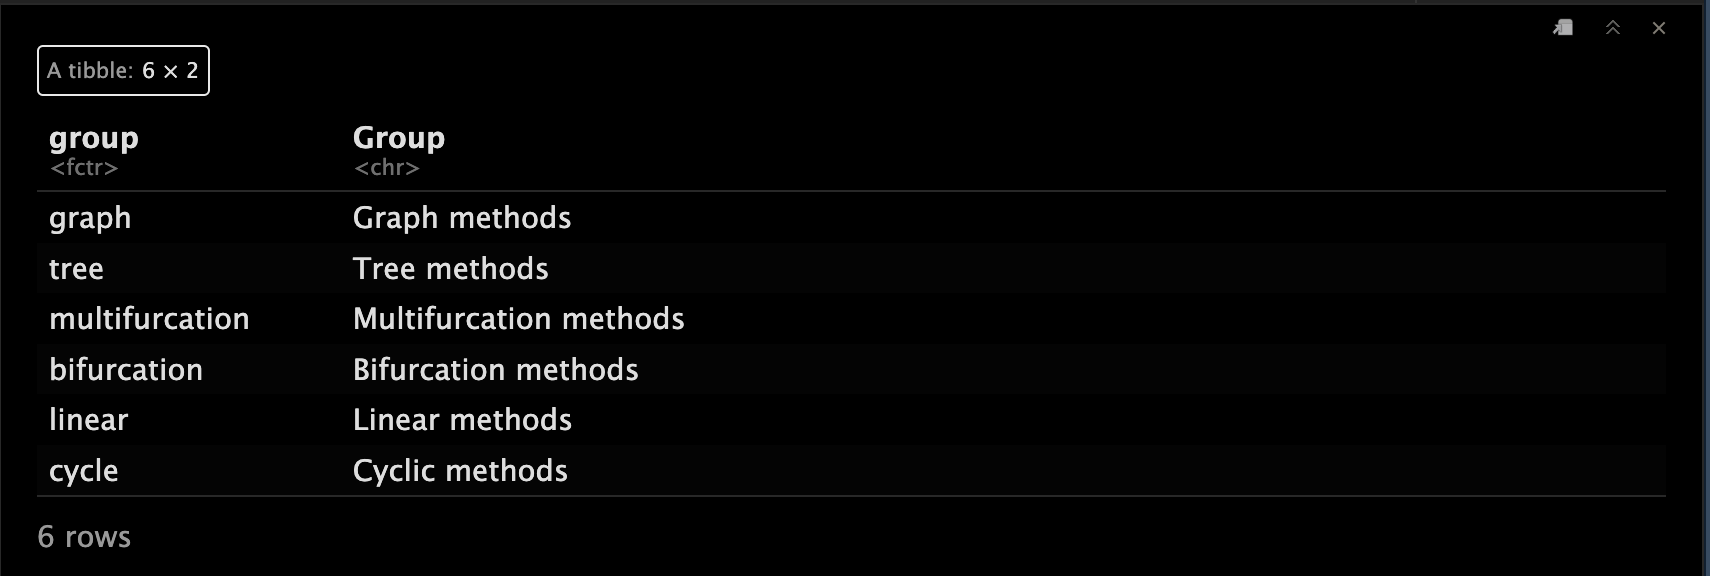
5.9 行的分组信息
row_groups <- dynbenchmark_data$row_groups
row_groups
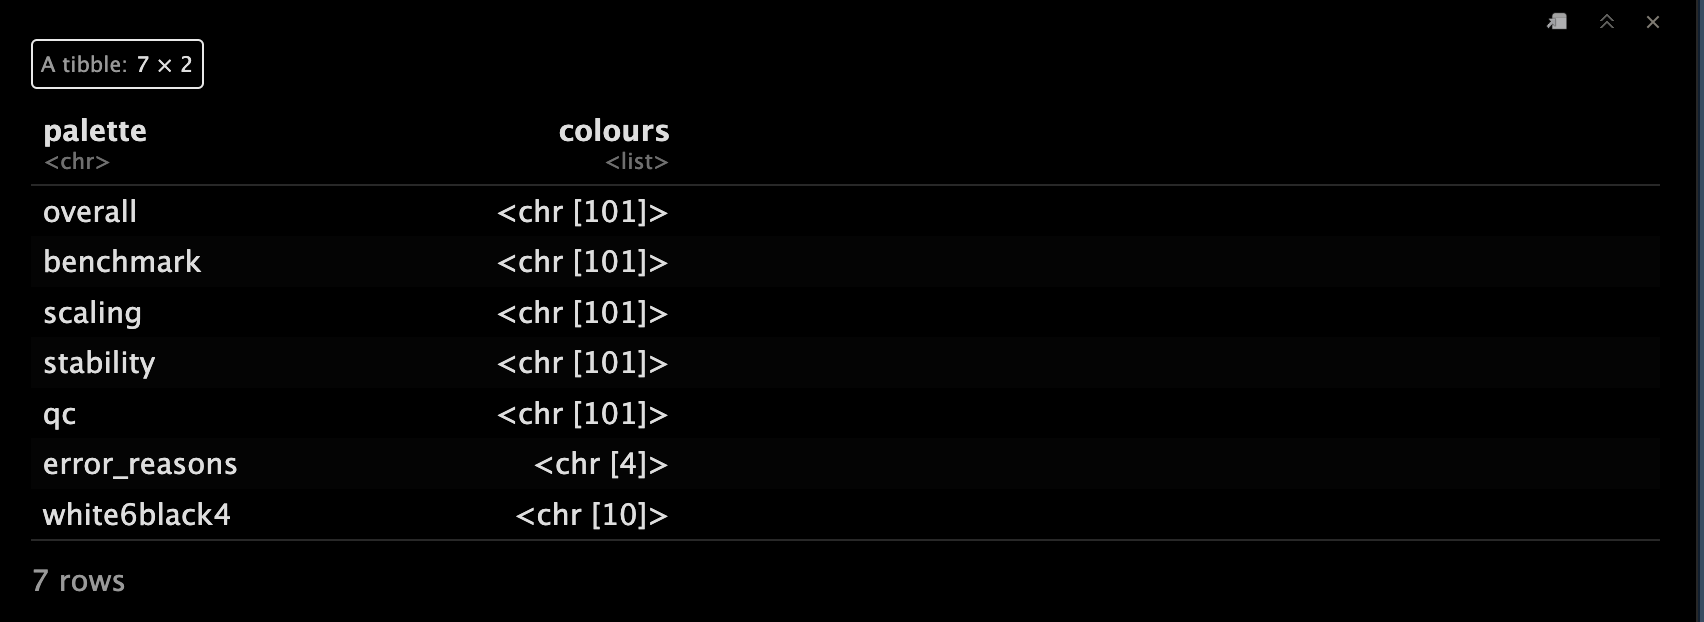
5.10 分组配色
我们给不同分组配上不同的配色。🤩
palettes <- dynbenchmark_data$palettes
print(palettes)
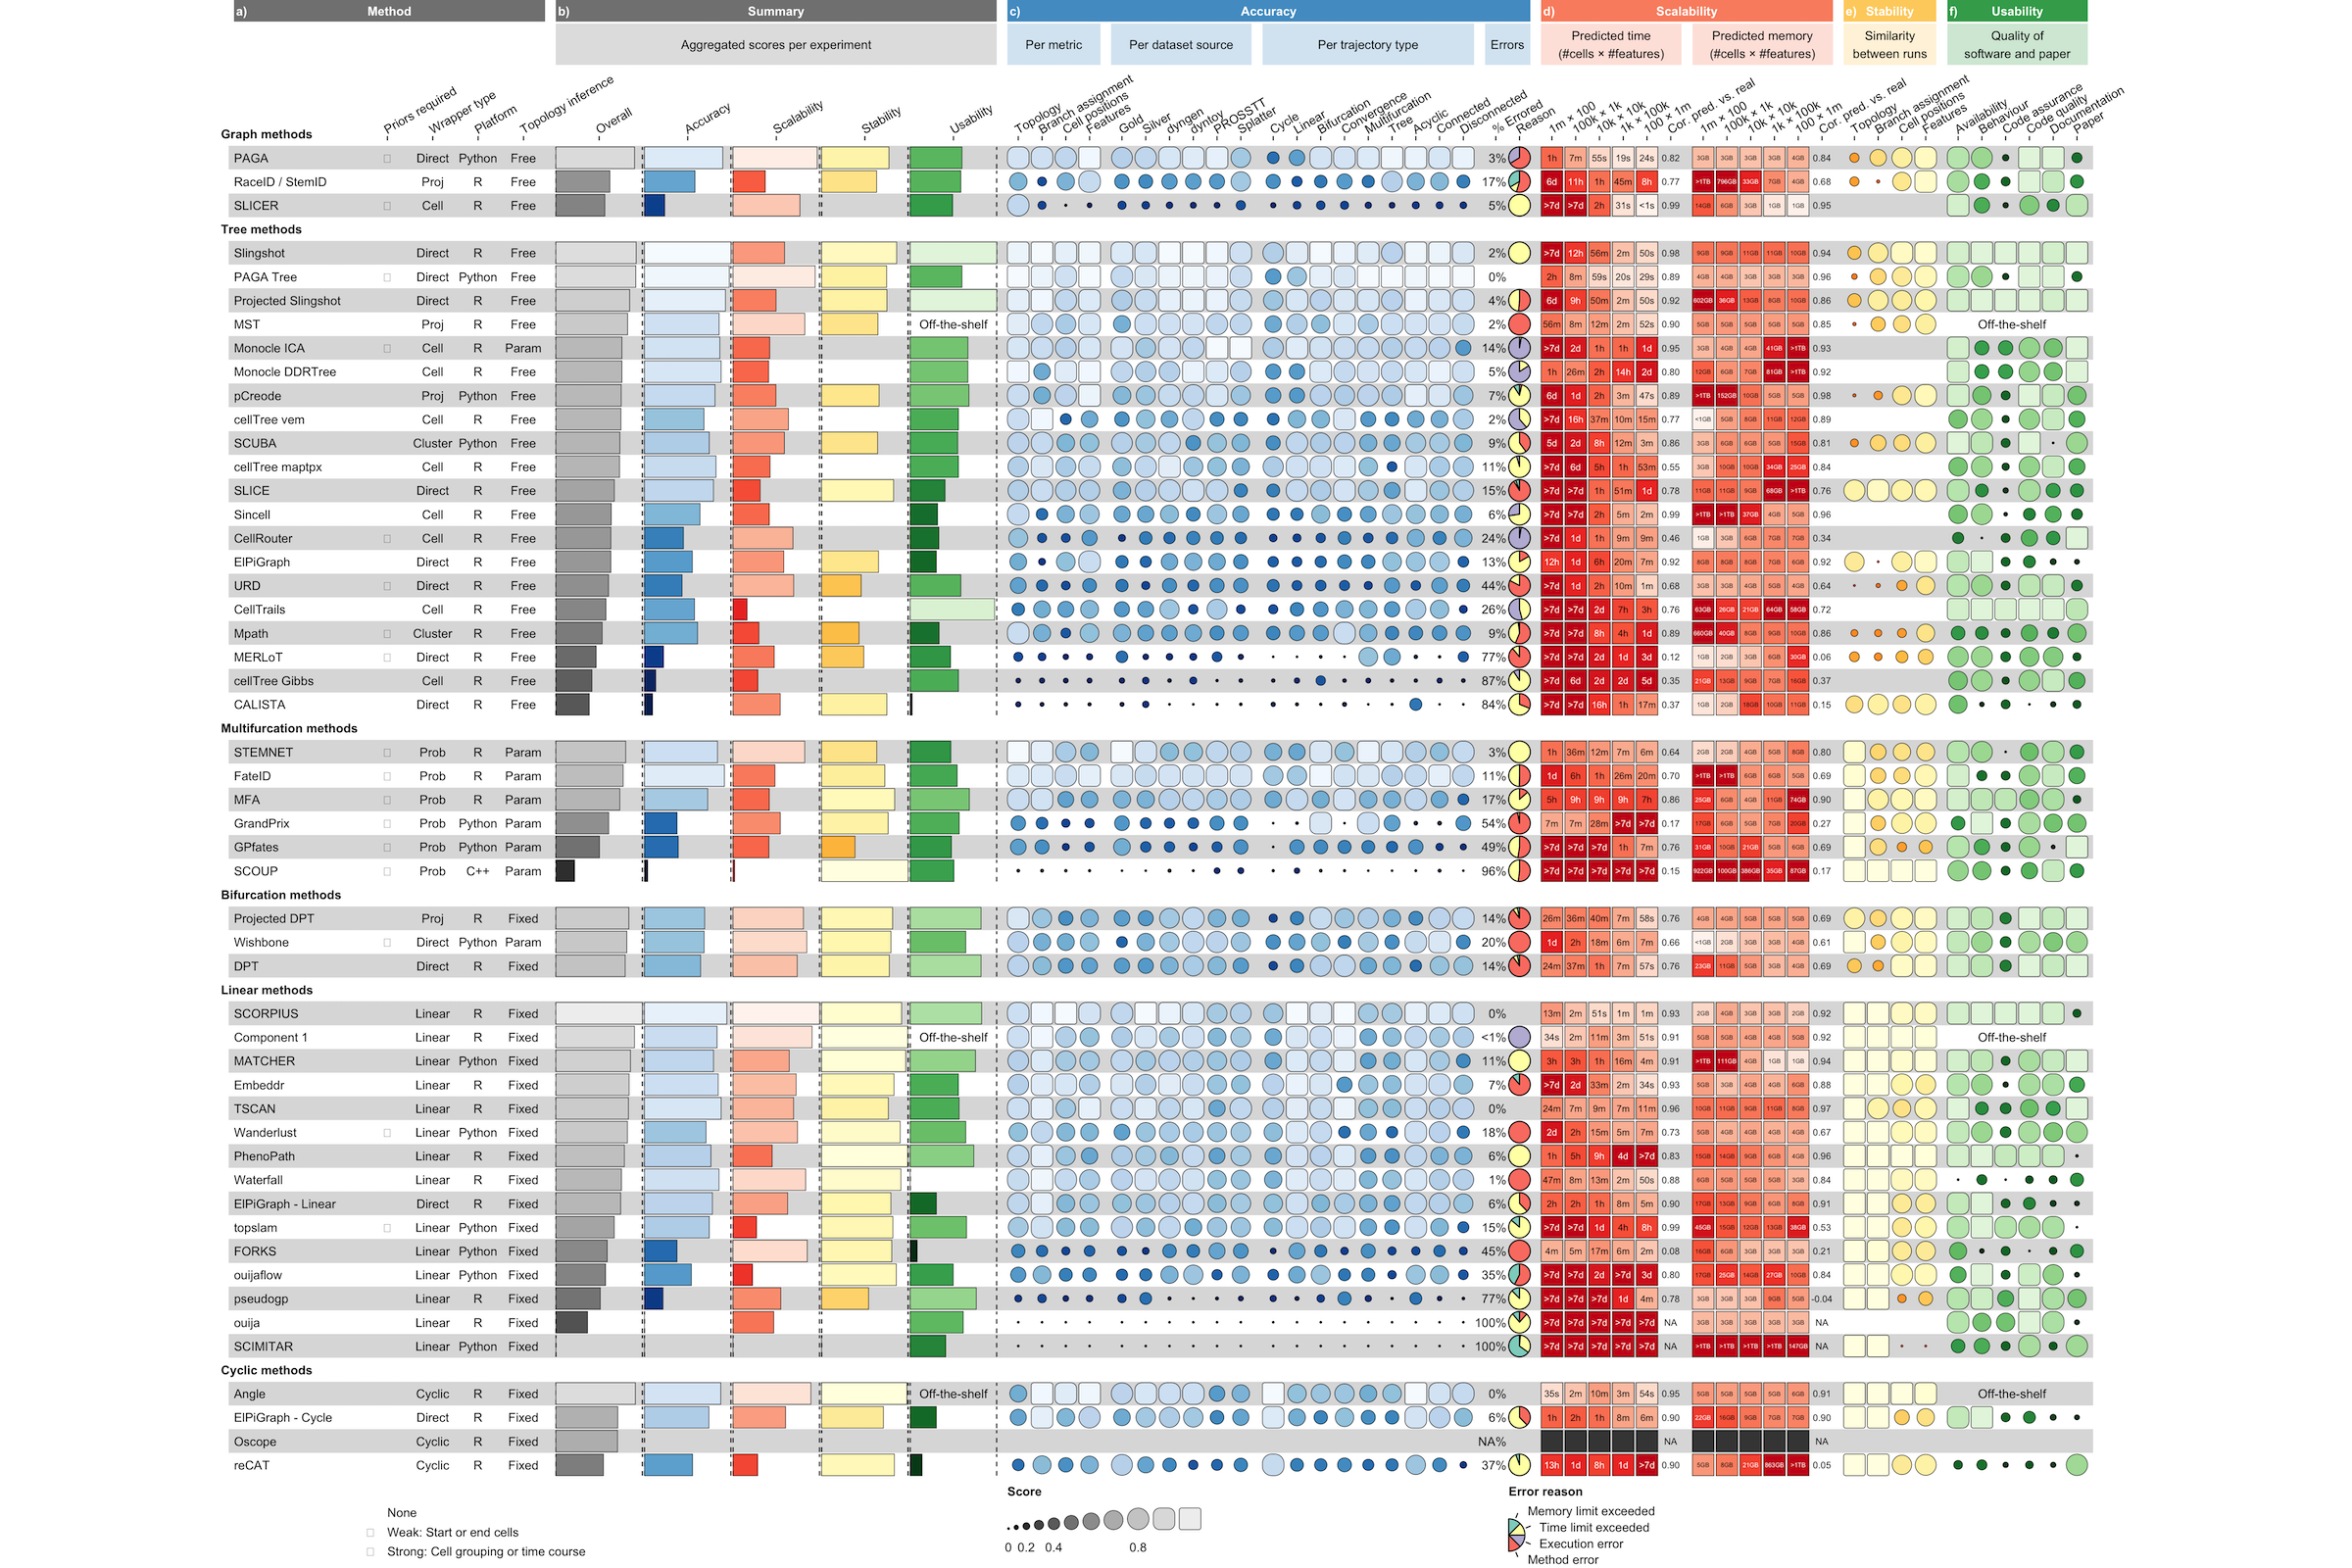
5.11 最终可视化
Perfect!~⭐️
颜值很高,大家都冲啊!~🥳
funky_heatmap(
  data = dat2,
  column_info = column_info,
  column_groups = column_groups,
  row_info = row_info,
  row_groups = row_groups,
  palettes = palettes,
  col_annot_offset = 3.2
)

点个在看吧各位~ ✐.ɴɪᴄᴇ ᴅᴀʏ 〰
📍 🤩 WGCNA | 值得你深入学习的生信分析方法!~
📍 🤩 ComplexHeatmap | 颜狗写的高颜值热图代码!
📍 🤥 ComplexHeatmap | 你的热图注释还挤在一起看不清吗!?
📍 🤨 Google | 谷歌翻译崩了我们怎么办!?(附完美解决方案)
📍 🤩 scRNA-seq | 吐血整理的单细胞入门教程
📍 🤣 NetworkD3 | 让我们一起画个动态的桑基图吧~
📍 🤩 RColorBrewer | 再多的配色也能轻松搞定!~
📍 🧐 rms | 批量完成你的线性回归
📍 🤩 CMplot | 完美复刻Nature上的曼哈顿图
📍 🤠 Network | 高颜值动态网络可视化工具
📍 🤗 boxjitter | 完美复刻Nature上的高颜值统计图
📍 🤫 linkET | 完美解决ggcor安装失败方案(附教程)
📍 ......
本文由 mdnice 多平台发布


![[Openwrt]procd实现hotplug机制介绍](https://img-blog.csdnimg.cn/img_convert/2bf4f636d1c52333ea30e498301762e9.png)